Analysis Summary
Notes:
- 1) No attempt has been made to eliminate the non-significant decimal places.
- 2) This batgrbproduct analysis is done using the HEASARC data.
- 3) This batgrbproduct analysis is using the flight position for the mask-weighting calculation.
======================================================================
BAT GRB EVENT DATA PROCESSING REPORT
Process Script Ver: batgrbproduct v2.46
Process Start Time: Mon Jan 13 04:19:27 EST 2014
Host Name: batevent1
Current Working Dir: /local/data/batevent/batevent_reproc/trigger522586
======================================================================
Trigger: 00522586 Segment: 000
BAT Trigger Time: 359284077.056 [s; MET]
Trigger Stop: 359284089.216 [s; MET]
UTC: 2012-05-21T09:07:48.825220 [includes UTCF correction]
Where From?: TDRSS position message
BAT
RA: 197.013854919207 Dec: -52.7460338744419 [deg; J2000]
Catalogged Source?: NO
Point Source?: YES
GRB Indicated?: YES [ by BAT flight software ]
Image S/N Ratio: 8.56
Image Trigger?: NO
Rate S/N Ratio: 11.6189500386223 [ if not an image trigger ]
Image S/N Ratio: 8.56
Analysis Position: [ source = BAT ]
RA: 197.013854919207 Dec: -52.7460338744419 [deg; J2000]
Refined Position: [ source = BAT pre-slew burst ]
RA: 197.011807975404 Dec: -52.7571518194873 [deg; J2000]
{ 13h 08m 02.8s , -52d 45' 25.7" }
+/- 1.53862798496557 [arcmin] (estimated 90% radius based on SNR)
+/- 0.62430711440556 [arcmin] (formal 1-sigma fit error)
SNR: 16.4355645656268
Angular difference between the analysis and refined position is 0.671206 arcmin
Partial Coding Fraction: 0.3554688 [ including projection effects ]
Duration
T90: 146.832000017166 +/- 27.9444855556604
Measured from: 3.39200001955032
to: 150.224000036716 [s; relative to TRIGTIME]
T50: 55.4560000300407 +/- 24.1445897684261
Measured from: 13.1520000100136
to: 68.6080000400543 [s; relative to TRIGTIME]
Fluence
Peak Flux (peak 1 second)
Measured from: 31.1079999804497
to: 32.1079999804497 [s; relative to TRIGTIME]
Total Fluence
Measured from: 0.351999998092651
to: 170.047999978065 [s; relative to TRIGTIME]
Band 1 Band 2 Band 3 Band 4
15-25 25-50 50-100 100-350 keV
Total 0.611510 1.010987 1.133812 0.204257
0.098204 0.101188 0.091531 0.086529 [error]
Peak 0.030295 0.032908 0.034559 0.008835
0.009379 0.010008 0.008791 0.008029 [error]
[ fluence units of on-axis counts / fully illuminated detector ]
======================================================================
====== Table of the duration information =============================
Value tstart tstop
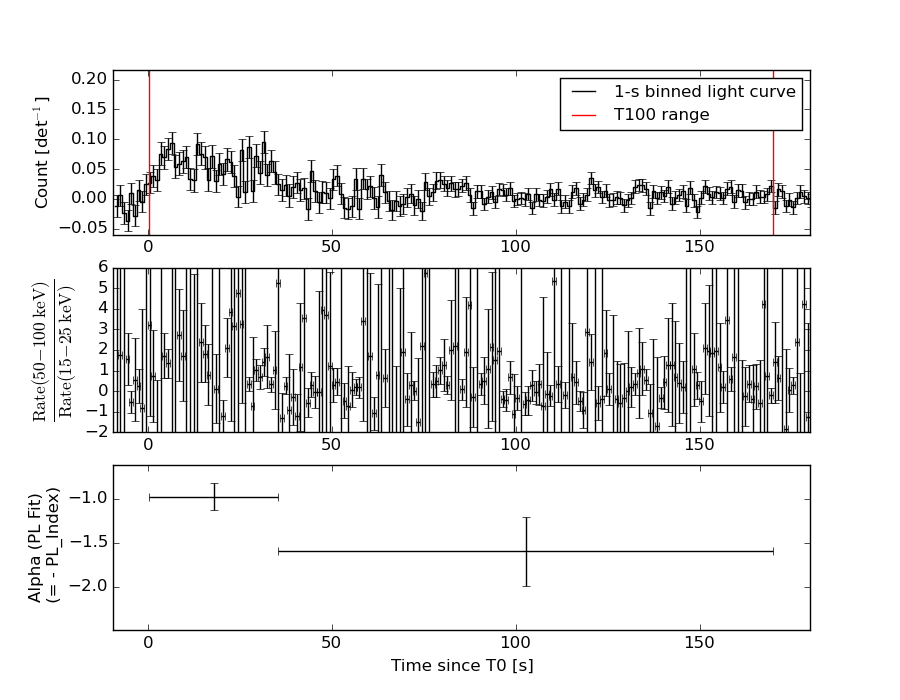
T100 169.696 0.352 170.048
T90 146.832 3.392 150.224
T50 55.456 13.152 68.608
Peak 1.000 31.108 32.108
====== Spectral Analysis Summary =====================================
Model : spectral model: simple power-law (PL) and cutoff power-law (CPL)
Ph_index : photon index: E^{Ph_index}
Ph_90err : 90% error of the photon index
Epeak : Epeak in keV
Epeak_90err: 90% error of Epeak
Norm : normalization at 50 keV in both the PL model and CPL model
Nomr_90err : 90% error of the normalization
chi2 : Chi-Squared
dof : degree of freedo
=== Time-averaged spectral analysis ===
(Best model with acceptable fit: PL)
Model Ph_index Ph_90err_low Ph_90err_hi Epeak Epeak_90err_low Epeak_90err_hi Norm Nomr_90err_low Norm_90err_hi chi2 dof
PL -1.210 -0.165 0.167 - - - 1.21e-03 -1.16e-04 1.16e-04 62.870 57
CPL -0.229 -0.728 0.892 99.003 -23.599 116.722 3.41e-03 -1.80e-03 4.87e-03 57.260 56
=== 1-s peak spectral analysis ===
(Best model with acceptable fit: PL)
Model Ph_index Ph_90err_low Ph_90err_hi Epeak Epeak_90err_low Epeak_90err_hi Norm Nomr_90err_low Norm_90err_hi chi2 dof
PL -1.750 -0.529 0.473 - - - 6.42e-03 -2.08e-03 1.97e-03 62.250 57
CPL -1.371 -0.899 2.218 76.106 -76.106 -76.106 1.03e-02 -1.03e-02 1.69e-01 62.090 56
=== Fluence/Peak Flux Summary ===
Model Band1 Band2 Band3 Band4 Band5 Total
15-25 25-50 50-100 100-350 15-150 15-350 keV
Fluence PL 1.99e-07 4.38e-07 7.57e-07 3.04e-06 2.07e-06 4.43e-06 erg/cm2
90%_error_low -3.52e-08 -4.83e-08 -8.70e-08 -7.04e-07 -2.20e-07 -7.69e-07 erg/cm2
90%_error_hi 3.72e-08 4.78e-08 8.64e-08 8.41e-07 2.22e-07 8.84e-07 erg/cm2
Peak flux PL 3.36e-01 2.92e-01 1.73e-01 1.55e-01 8.68e-01 9.56e-01 ph/cm2/s
90%_error_low -1.29e-01 -7.85e-02 -7.07e-02 -9.56e-02 -2.33e-01 -2.62e-01 ph/cm2/s
90%_error_hi 1.40e-01 7.84e-02 7.12e-02 1.57e-01 2.33e-01 2.66e-01 ph/cm2/s
Fluence CPL 1.59e-07 4.68e-07 8.20e-07 1.01e-06 1.95e-06 2.45e-06 erg/cm2
90%_error_low -4.50e-08 -5.60e-08 -1.02e-07 -4.98e-07 -2.37e-07 -5.45e-07 erg/cm2
90%_error_hi 4.68e-08 5.71e-08 1.05e-07 1.17e-06 2.39e-07 1.17e-06 erg/cm2
Peak flux CPL 3.20e-01 3.05e-01 1.77e-01 9.60e-02 8.57e-01 8.98e-01 ph/cm2/s
90%_error_low -1.50e-01 -2.06e-01 N/A -9.60e-02 -2.33e-01 -2.66e-01 ph/cm2/s
90%_error_hi 1.52e-01 1.03e-01 N/A 1.17e-01 2.37e-01 3.12e-01 ph/cm2/s
======================================================================
Image
Pre-slew 15.0-350.0 keV image (Event data)

#   RAcent    DECcent   POSerr    Theta     Phi              Peak Cts       SNR   Name
  197.0118   -52.7572   0.0117    29.9717   102.0933         2.4844132     16.436 TRIG_00522586

Foreground time interval of the image:
  0.352  57.645 (delta_t =  57.293 [sec])
Background time interval of the image:
-239.056 -40.898 (delta_t = 198.158 [sec])
-40.056   0.352 (delta_t =  40.408 [sec])
Light Curves
Note: The mask-weighted lightcurves have units of either count/det or counts/sec/det, where a det is 0.4 x 0.4 = 0.16 sq cm.
Full-time range; 1 s binning
Other quick-look light curves:
- 64 ms binning (zoomed)
- 16 ms binning (zoomed)
- 8 ms binning (zoomed)
- 2 ms binning (zoomed)
- SN=5 or 10 s binning (full-time range)
- Raw light curve
Spectra
- 64 ms binning (zoomed)
- 16 ms binning (zoomed)
- 8 ms binning (zoomed)
- 2 ms binning (zoomed)
- SN=5 or 10 s binning (full-time range)
- Raw light curve
Spectra
Notes:
- 1) The fitting includes the systematic errors.
- 2) When the burst includes telescope slew time periods, the fitting uses an average response file made from multiple 5-s response files through out the slew time plus single time preiod for the non-slew times, and weighted by the total counts in the corresponding time period using addrmf. An average response file is needed becuase a spectral fit using the pre-slew DRM will introduce some errors in both a spectral shape and a normalization if the PHA file contains a lot of the slew/post-slew time interval.
- 3) For fits to more complicated models (e.g. a power-law over a cutoff power-law), the BAT team has decided to require a chi-square improvement of more than 6 for each extra dof.
Time averaged spectrum fit using the average DRM
Power-law model
Time interval is from    0.352 sec. to  170.048 sec.

Spectral model in power-law:
------------------------------------------------------------
Parameters  : value       lower 90%   higher 90%
Photon index: -1.20984     ( -0.164698   0.166819 )
Norm@50keV  : 1.20715E-03    ( -0.000116202   0.000116202 )
------------------------------------------------------------
#Fit statistic : Chi-Squared =          62.87 using 59 PHA bins.
# Reduced chi-squared =          1.103 for     57 degrees of freedom
# Null hypothesis probability =   2.762008e-01

Photon flux (15-150 keV)    in 169.7 sec: 0.141895 ( -0.014071  0.014105 ) ph/cm2/s
Energy fluence (15-150 keV)             : 2.07282e-06 ( -2.1979e-07  2.21543e-07 ) ergs/cm2
Cutoff power-law model
Time interval is from    0.352 sec. to  170.048 sec.
Spectral model in the cutoff power-law:
------------------------------------------------------------
Parameters  : value       lower 90%   higher 90%
Photon index: -0.228551     ( -0.728011   0.892295 )
Epeak [keV] : 99.0032      ( -23.5985 116.722 )
Norm@50keV  : 3.40927E-03    ( -0.00179738   0.00487008 )
------------------------------------------------------------
#Fit statistic : Chi-Squared =          57.26 using 59 PHA bins.
# Reduced chi-squared =          1.023 for     56 degrees of freedom
# Null hypothesis probability =   4.280169e-01

Photon flux (15-150 keV)    in 169.7 sec: 0.135104 ( -0.015091  0.015011 ) ph/cm2/s
Energy fluence (15-150 keV)             : 1.95323e-06 ( -2.37134e-07  2.39382e-07 ) ergs/cm2
1-s peak spectrum fit
Power-law model
Time interval is from   31.108 sec. to   32.108 sec.

Spectral model in power-law:
------------------------------------------------------------
Parameters  : value       lower 90%   higher 90%
Photon index: -1.74996     ( -0.528982   0.473194 )
Norm@50keV  : 6.41770E-03    ( -0.00207966   0.00196657 )
------------------------------------------------------------
#Fit statistic : Chi-Squared =          62.25 using 59 PHA bins.
# Reduced chi-squared =          1.092 for     57 degrees of freedom
# Null hypothesis probability =   2.948783e-01

Photon flux (15-150 keV)    in 1 sec: 0.867809 ( -0.23307  0.233131 ) ph/cm2/s
Energy fluence (15-150 keV)             : 5.92284e-08 ( -1.89214e-08  1.9763e-08 ) ergs/cm2
Cutoff power-law model
Time interval is from   31.108 sec. to   32.108 sec.
Spectral model in the cutoff power-law:
------------------------------------------------------------
Parameters  : value       lower 90%   higher 90%
Photon index: -1.3712     ( -0.89911   2.21798 )
Epeak [keV] : 76.1064      ( -76.1003 -76.1003 )
Norm@50keV  : 1.03385E-02    ( -0.0103393   0.168526 )
------------------------------------------------------------
#Fit statistic : Chi-Squared =          62.09 using 59 PHA bins.
# Reduced chi-squared =          1.109 for     56 degrees of freedom
# Null hypothesis probability =   2.681121e-01

Photon flux (15-150 keV)    in 1 sec: 0.857348 ( -0.233197  0.237212 ) ph/cm2/s
Energy fluence (15-150 keV)             : 5.74315e-08 ( -1.97785e-08  2.05713e-08 ) ergs/cm2
Time-resolved spectra
Distribution
T90 vs. Hardness ratio plot
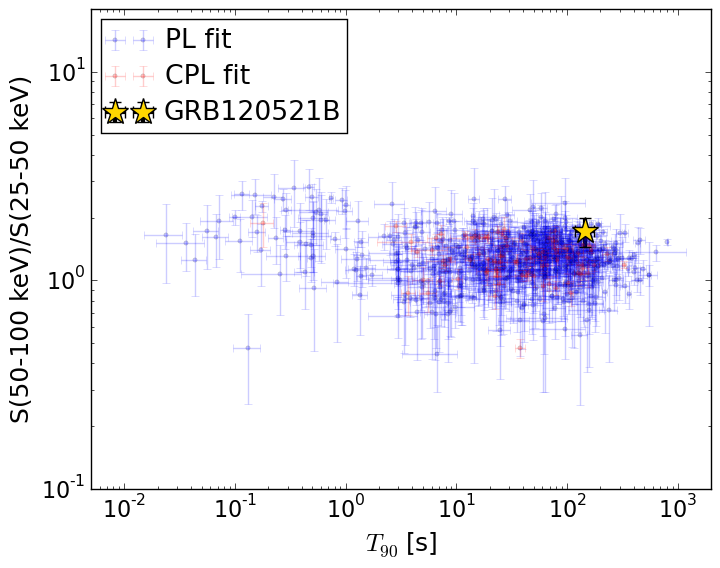
T90                                   = 146.832 sec.
Hardness ratio (energy fluence ratio) = 1.72929878055
S(15-50 keV) vs. S(50-150 keV) plot
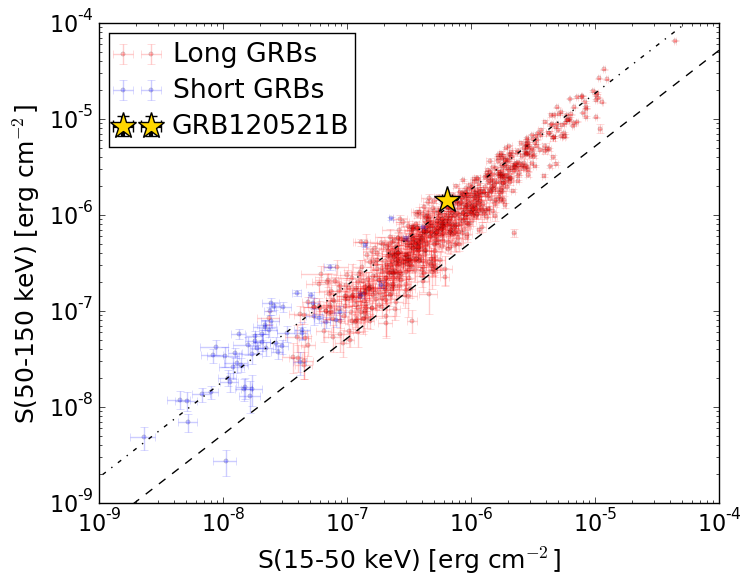
S(15-50 keV)  = 6.37376e-07
S(50-150 keV) = 1.4354507e-06
The dash-dotted line and the dashed line traces the fluences calculated from the Band function with Epeak = 15 and 150 keV, respectively. Both lines assume a canonical values of alpha = -1 and beta = -2.5.
Mask shadow pattern
IMX = -1.208197273612199E-01, IMY = -5.638948055288383E-01
Spacecraft aspect plot
Bright source in the pre-burst/pre-slew/post-slew images
Pre-burst image of 15-350 keV band
Time interval of the image:
-239.056000 -40.898100
-40.056000 0.352000

# RAcent  DECcent POSerr Theta    Phi  PeakCts   SNR AngSep     Name
#  [deg]    [deg]    ['] [deg]  [deg]                   [']
135.4856 -40.5748    1.8  12.8  -64.6   1.1711   6.3    2.3	Vela X-1
170.1664 -60.7077    4.5  16.6  128.0   0.5115   2.5    6.7	Cen X-3
186.5835 -62.8612    2.5  24.5  124.4   1.1720   4.6    5.8	GX 301-2
203.4249 -57.4811    2.7  32.6  112.4   1.5174   4.3 ------	UNKNOWN
136.8135 -31.2425    2.7  20.2  -43.7   0.8320   4.2 ------	UNKNOWN
 26.4435 -62.6748    3.8  59.0 -166.2   4.3395   3.1 ------	UNKNOWN
 36.8511 -60.3491    3.7  57.3 -160.1   3.5990   3.2 ------	UNKNOWN
 35.8622 -58.8589    3.7  58.7 -159.2   4.9201   3.1 ------	UNKNOWN
 39.6625 -57.9229    3.5  58.0 -156.8   4.1682   3.3 ------	UNKNOWN
Pre-slew background subtracted image of 15-350 keV band
Time interval of the image:
0.352000 57.644600

# RAcent  DECcent POSerr Theta    Phi  PeakCts   SNR AngSep     Name
#  [deg]    [deg]    ['] [deg]  [deg]                   [']
135.6515 -40.7172    6.3  12.6  -64.7   0.1719   1.8   11.2	Vela X-1
170.1979 -60.4820    4.9  16.5  127.3   0.2397   2.3    9.1	Cen X-3
186.6052 -62.6282    9.2  24.5  123.9   0.1547   1.3    8.6	GX 301-2
197.0118 -52.7572    0.7  30.0  102.1   2.4849  16.4 ------	UNKNOWN
Post-slew image of 15-350 keV band
Time interval of the image:
108.244600 963.052500

# RAcent  DECcent POSerr Theta    Phi  PeakCts   SNR AngSep     Name
#  [deg]    [deg]    ['] [deg]  [deg]                   [']
135.6678 -40.4704    4.5  42.5  -69.3   7.2721   2.5    8.1	Vela X-1
170.4125 -60.6311    2.2  16.4  -99.7   2.9930   5.3    2.9	Cen X-3
186.6684 -62.7638    0.9  11.4 -126.1   5.9608  12.4    0.5	GX 301-2
255.8640 -37.9534    7.3  42.6  123.5   3.3544   1.6    8.8	4U 1700-377
264.7693 -44.4509  105.9  43.9  137.0   0.2079   0.1    1.1	4U 1735-44
248.5286 -47.4094    0.9  32.8  131.2  12.1080  13.3 ------	UNKNOWN
 31.0873 -71.5808    9.0  55.3 -145.2   6.0200   1.3 ------	UNKNOWN