Analysis Summary
Notes:
- 1) No attempt has been made to eliminate the non-significant decimal places.
- 2) This batgrbproduct analysis is done using the HEASARC data.
- 3) This batgrbproduct analysis is using the flight position for the mask-weighting calculation.
======================================================================
                  BAT GRB EVENT DATA PROCESSING REPORT
    Process Script Ver: batgrbproduct v2.46
    Process Start Time: Mon Jan 13 04:09:39 EST 2014
             Host Name: batevent1
   Current Working Dir: /local/data/batevent/batevent_reproc/trigger524128
======================================================================

  Trigger: 00524128      Segment: 000

  BAT Trigger Time: 361159528   [s; MET]
      Trigger Stop: 361159592   [s; MET]
               UTC: 2012-06-12T02:05:19.691840    [includes UTCF correction]
       Where From?: TDRSS position message

  BAT
    RA: 126.726052283175   Dec: -17.577825111582  [deg; J2000]

     Catalogged Source?: NO
     Point Source?:      YES
     GRB Indicated?:     YES    [ by BAT flight software ]
     Image S/N Ratio:    8.4
     Image Trigger?:     YES
     Rate S/N Ratio:     0  [ if not an image trigger ]
     Image S/N Ratio:    8.4

  Analysis Position:   [ source = BAT ]
    RA: 126.726052283175   Dec: -17.577825111582  [deg; J2000]

  Refined Position:   [ source = BAT pre-slew burst ]
    RA: 126.72284837313   Dec: -17.597999107596  [deg; J2000]
        { 08h 26m 53.5s , -17d 35' 52.8" }
         +/- 1.69675414180813 [arcmin] (estimated 90% radius based on SNR)
         +/- 0.67757012647635 [arcmin] (formal 1-sigma fit error)
    SNR: 14.2919455944608

  Angular difference between the analysis and refined position is 1.224232 arcmin

  Partial Coding Fraction: 0.671875    [ including projection effects ]

  Duration
     T90: 90.2839999198914 +/- 13.5885753730475
        Measured from: 22.8240000009537
                   to: 113.107999920845     [s; relative to TRIGTIME]
     T50: 40.6639999747276 +/- 10.1964278336431
        Measured from: 34.4599999785423
                   to: 75.12399995327     [s; relative to TRIGTIME]


  Fluence
     Peak Flux  (peak 1 second)
        Measured from: 30.1999999880791
                   to: 31.1999999880791     [s; relative to TRIGTIME]
     Total Fluence
        Measured from: 16.972000002861
                   to: 125.364000022411     [s; relative to TRIGTIME]

             Band 1     Band 2     Band 3     Band 4
              15-25      25-50     50-100    100-350     keV
 Total     0.484831   0.725222   0.623681   0.135028
           0.064498   0.066918   0.059616   0.053641 [error]
 Peak      0.012825   0.016530   0.018550   0.018308
           0.006579   0.006879   0.006267   0.005586 [error]

     [ fluence units of on-axis counts / fully illuminated detector ]

======================================================================


====== Table of the duration information =============================

        Value   tstart    tstop
T100  108.392   16.972  125.364
T90    90.284   22.824  113.108
T50    40.664   34.460   75.124
Peak    1.000   30.200   31.200


====== Spectral Analysis Summary =====================================

Model      : spectral model: simple power-law (PL) and cutoff power-law (CPL)
Ph_index   : photon index: E^{Ph_index}
Ph_90err   : 90% error of the photon index
Epeak      : Epeak in keV
Epeak_90err: 90% error of Epeak
Norm       : normalization at 50 keV in both the PL model and CPL model
Nomr_90err : 90% error of the normalization
chi2       : Chi-Squared
dof        : degree of freedo

=== Time-averaged spectral analysis ===
(Best model with acceptable fit: PL)

Model Ph_index Ph_90err_low Ph_90err_hi  Epeak  Epeak_90err_low  Epeak_90err_hi  Norm       Nomr_90err_low    Norm_90err_hi    chi2    dof
PL      -1.364    -0.166      0.167       -           -               -         1.23e-03     -1.22e-04          1.21e-04      51.010   57
CPL     -0.608    -0.685      0.824       92.241     -25.788       314.034      2.95e-03     -1.59e-03          4.51e-03      47.420   56


=== 1-s peak spectral analysis ===
(Best model with acceptable fit: PL)

Model Ph_index Ph_90err_low Ph_90err_hi  Epeak  Epeak_90err_low  Epeak_90err_hi  Norm       Nomr_90err_low    Norm_90err_hi    chi2    dof
PL      -0.948     -0.626     0.747       -           -               -         4.08e-03     -1.46e-03          1.36e-03      50.850   57
CPL     -0.957     -0.615     1.079     9999.340    -9999.340      -9999.340      4.11e-03     -1.47e-03          2.03e-02      50.860   56


=== Fluence/Peak Flux Summary ===

              Model    Band1     Band2     Band3     Band4     Band5     Total
                       15-25     25-50    50-100    100-350    15-150    15-350    keV
Fluence         PL   1.50e-07  2.99e-07  4.65e-07  1.59e-06  1.30e-06  2.50e-06   erg/cm2
      90%_error_low -2.49e-08 -3.15e-08 -5.78e-08 -3.85e-07 -1.42e-07 -4.35e-07   erg/cm2
      90%_error_hi   2.60e-08  3.12e-08  5.75e-08  4.63e-07  1.44e-07  4.99e-07   erg/cm2
Peak flux       PL   9.92e-02  1.39e-01  1.44e-01  2.74e-01  4.68e-01  6.55e-01   ph/cm2/s
      90%_error_low -6.53e-02 -6.61e-02 -5.04e-02 -1.67e-01 -1.60e-01 -2.22e-01   ph/cm2/s
      90%_error_hi   8.60e-02  6.10e-02  4.85e-02  3.14e-01  1.62e-01  2.61e-01   ph/cm2/s

Fluence        CPL   1.32e-07  3.23e-07  4.85e-07  5.72e-07  1.22e-06  1.51e-06   erg/cm2
      90%_error_low -2.99e-08 -3.85e-08 -6.44e-08 -3.21e-07 -1.59e-07 -3.55e-07   erg/cm2
      90%_error_hi   3.06e-08  4.00e-08  6.54e-08  8.50e-07  1.60e-07  8.43e-07   erg/cm2
Peak flux      CPL   9.93e-02  1.39e-01  1.44e-01  2.70e-01  4.68e-01  6.93e-01   ph/cm2/s
      90%_error_low     N/A   -8.03e-02     N/A       N/A   -1.60e-01     N/A     ph/cm2/s
      90%_error_hi      N/A    7.34e-02     N/A       N/A    1.62e-01     N/A     ph/cm2/s

======================================================================
Image
Pre-slew 15.0-350.0 keV image (Event data)
#   RAcent    DECcent   POSerr    Theta     Phi              Peak Cts       SNR   Name
  126.7228   -17.5980   0.0135    27.3339   150.9184         1.6218716     14.292 TRIG_00524128

Foreground time interval of the image:
 16.972  78.901 (delta_t =  61.929 [sec])
Background time interval of the image:
-239.000  16.972 (delta_t = 255.972 [sec])
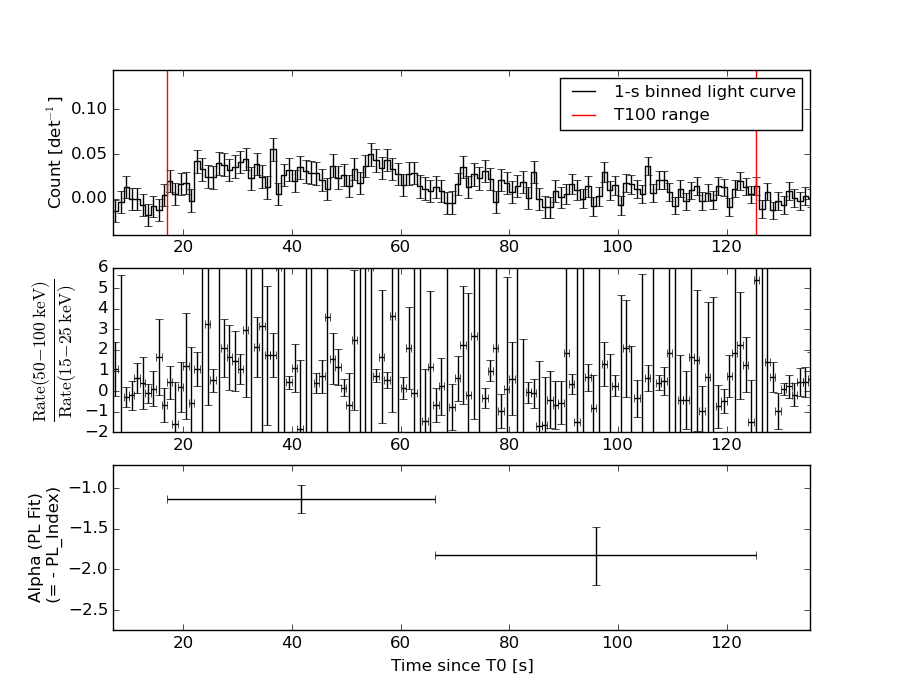
Light Curves
Note: The mask-weighted lightcurves have units of either count/det or counts/sec/det, where a det is 0.4 x 0.4 = 0.16 sq cm.
Full-time range; 1 s binning
Other quick-look light curves:
- 64 ms binning (zoomed)
- 16 ms binning (zoomed)
- 8 ms binning (zoomed)
- 2 ms binning (zoomed)
- SN=5 or 10 s binning (full-time range)
- Raw light curve
Spectra
- 64 ms binning (zoomed)
- 16 ms binning (zoomed)
- 8 ms binning (zoomed)
- 2 ms binning (zoomed)
- SN=5 or 10 s binning (full-time range)
- Raw light curve
Spectra
Notes:
- 1) The fitting includes the systematic errors.
- 2) When the burst includes telescope slew time periods, the fitting uses an average response file made from multiple 5-s response files through out the slew time plus single time preiod for the non-slew times, and weighted by the total counts in the corresponding time period using addrmf. An average response file is needed becuase a spectral fit using the pre-slew DRM will introduce some errors in both a spectral shape and a normalization if the PHA file contains a lot of the slew/post-slew time interval.
- 3) For fits to more complicated models (e.g. a power-law over a cutoff power-law), the BAT team has decided to require a chi-square improvement of more than 6 for each extra dof.
Time averaged spectrum fit using the average DRM
Power-law model
Time interval is from   16.972 sec. to  125.364 sec.

Spectral model in power-law:
------------------------------------------------------------
Parameters  : value       lower 90%   higher 90%
Photon index: -1.36362     ( -0.166091   0.166609 )
Norm@50keV  : 1.22891E-03    ( -0.000121504   0.000121259 )
------------------------------------------------------------
#Fit statistic : Chi-Squared =          51.01 using 59 PHA bins.
# Reduced chi-squared =         0.8950 for     57 degrees of freedom
# Null hypothesis probability =   6.979789e-01

Photon flux (15-150 keV)    in 108.4 sec: 0.148471 ( -0.014781  0.014803 ) ph/cm2/s
Energy fluence (15-150 keV)             : 1.2973e-06 ( -1.42252e-07  1.43685e-07 ) ergs/cm2
Cutoff power-law model
Time interval is from   16.972 sec. to  125.364 sec.
Spectral model in the cutoff power-law:
------------------------------------------------------------
Parameters  : value       lower 90%   higher 90%
Photon index: -0.608428     ( -0.684947   0.82449 )
Epeak [keV] : 92.2413      ( -25.7881 314.034 )
Norm@50keV  : 2.94865E-03    ( -0.00158916   0.00451483 )
------------------------------------------------------------
#Fit statistic : Chi-Squared =          47.42 using 59 PHA bins.
# Reduced chi-squared =         0.8467 for     56 degrees of freedom
# Null hypothesis probability =   7.860126e-01

Photon flux (15-150 keV)    in 108.4 sec: 0.143669 ( -0.015494  0.015459 ) ph/cm2/s
Energy fluence (15-150 keV)             : 1.22084e-06 ( -1.58514e-07  1.59919e-07 ) ergs/cm2
1-s peak spectrum fit
Power-law model
Time interval is from   30.200 sec. to   31.200 sec.

Spectral model in power-law:
------------------------------------------------------------
Parameters  : value       lower 90%   higher 90%
Photon index: -0.948242     ( -0.62607   0.747316 )
Norm@50keV  : 4.07755E-03    ( -0.00146373   0.00135762 )
------------------------------------------------------------
#Fit statistic : Chi-Squared =          50.85 using 59 PHA bins.
# Reduced chi-squared =         0.8921 for     57 degrees of freedom
# Null hypothesis probability =   7.036367e-01

Photon flux (15-150 keV)    in 1 sec: 0.468439 ( -0.160067  0.161686 ) ph/cm2/s
Energy fluence (15-150 keV)             : 4.49345e-08 ( -1.54428e-08  1.56163e-08 ) ergs/cm2
Cutoff power-law model

Time interval is from   30.200 sec. to   31.200 sec.
Spectral model in the cutoff power-law:
------------------------------------------------------------
Parameters  : value       lower 90%   higher 90%
Photon index: -0.9573     ( -0.616177   1.07759 )
Epeak [keV] : 9999.34      ( -9999.36 -9999.36 )
Norm@50keV  : 4.11234E-03    ( -0.00147317   0.0202714 )
------------------------------------------------------------
#Fit statistic : Chi-Squared =          50.86 using 59 PHA bins.
# Reduced chi-squared =         0.9082 for     56 degrees of freedom
# Null hypothesis probability =   6.692632e-01

Photon flux (15-150 keV)    in 1 sec: 0.468394 ( -0.160135  0.161606 ) ph/cm2/s
Energy fluence (15-150 keV)             : 4.49915e-08 ( -1.86743e-08  1.87908e-08 ) ergs/cm2
Time-resolved spectra
Distribution
T90 vs. Hardness ratio plot
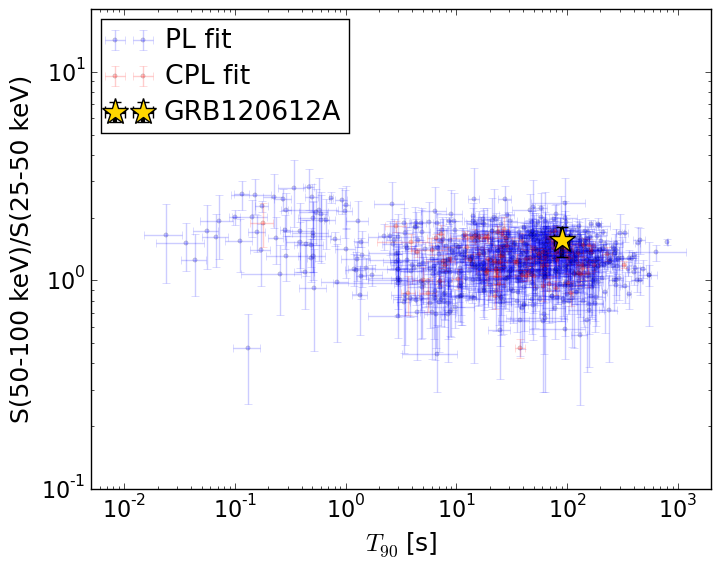
T90                                   = 90.284 sec.
Hardness ratio (energy fluence ratio) = 1.55442642729
S(15-50 keV) vs. S(50-150 keV) plot
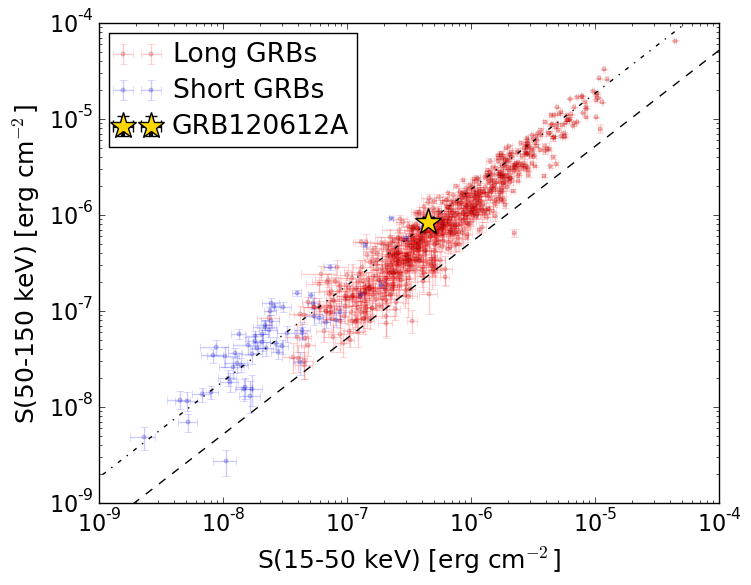
S(15-50 keV)  = 4.487701e-07
S(50-150 keV) = 8.485301e-07
The dash-dotted line and the dashed line traces the fluences calculated from the Band function with Epeak = 15 and 150 keV, respectively. Both lines assume a canonical values of alpha = -1 and beta = -2.5.
Mask shadow pattern
IMX = -4.517223554067246E-01, IMY = -2.512359227247116E-01
Spacecraft aspect plot
Bright source in the pre-burst/pre-slew/post-slew images
Pre-burst image of 15-350 keV band
Time interval of the image:
-239.000000 16.972000

# RAcent  DECcent POSerr Theta    Phi  PeakCts   SNR AngSep     Name
#  [deg]    [deg]    ['] [deg]  [deg]                   [']
147.1726 -13.5247    2.3  29.4  108.0   1.5486   4.9 ------	UNKNOWN
100.9518 -22.6149    3.5  42.3 -173.6   1.0475   3.3 ------	UNKNOWN
 79.2055 -21.6409    5.1  57.9 -156.9   2.6588   2.3 ------	UNKNOWN
 77.6460 -11.6699    3.8  55.2 -145.2   4.1832   3.0 ------	UNKNOWN
 84.3511  11.8679    4.0  43.8 -116.5   2.5840   2.9 ------	UNKNOWN
 82.3997   6.8401    3.2  46.1 -123.4   3.3471   3.6 ------	UNKNOWN
Pre-slew background subtracted image of 15-350 keV band
Time interval of the image:
16.972000 78.900590

# RAcent  DECcent POSerr Theta    Phi  PeakCts   SNR AngSep     Name
#  [deg]    [deg]    ['] [deg]  [deg]                   [']
166.6933  25.2191    2.9  39.1   27.9   0.6558   4.0 ------	UNKNOWN
126.7229 -17.5980    0.8  27.3  150.9   1.6218  14.3 ------	UNKNOWN
145.2670  60.7542    2.4  52.5  -23.7   1.1840   4.9 ------	UNKNOWN
Post-slew image of 15-350 keV band
Time interval of the image:
127.500590 963.118800

# RAcent  DECcent POSerr Theta    Phi  PeakCts   SNR AngSep     Name
#  [deg]    [deg]    ['] [deg]  [deg]                   [']
135.5392 -40.5388    0.7  24.2  123.0   9.1276  15.5    1.1	Vela X-1
146.8778 -41.4848    2.3  29.5  107.9   3.7907   5.1 ------	UNKNOWN
 86.7757 -54.5503    2.4  48.0  169.6   5.7952   4.8 ------	UNKNOWN
138.1546   0.9231    3.2  21.6   -8.0   1.6970   3.6 ------	UNKNOWN
 84.4792  -3.0550    4.8  43.9 -116.1   5.8064   2.4 ------	UNKNOWN