Analysis Summary
Notes:
- 1) No attempt has been made to eliminate the non-significant decimal places.
- 2) This batgrbproduct analysis is done using the HEASARC data.
- 3) This batgrbproduct analysis is using the flight position for the mask-weighting calculation.
======================================================================
                  BAT GRB EVENT DATA PROCESSING REPORT
    Process Script Ver: batgrbproduct v2.46
    Process Start Time: Mon Jan 13 04:03:33 EST 2014
             Host Name: batevent1
   Current Working Dir: /local/data/batevent/batevent_reproc/trigger525068
======================================================================

  Trigger: 00525068      Segment: 000

  BAT Trigger Time: 362269182.016   [s; MET]
      Trigger Stop: 362269183.04   [s; MET]
               UTC: 2012-06-24T22:19:33.661820    [includes UTCF correction]
       Where From?: TDRSS position message

  BAT
    RA: 170.941840070123   Dec: 8.93369375766324  [deg; J2000]

     Catalogged Source?: NO
     Point Source?:      YES
     GRB Indicated?:     YES    [ by BAT flight software ]
     Image S/N Ratio:    7.74
     Image Trigger?:     NO
     Rate S/N Ratio:     21.2602916254693  [ if not an image trigger ]
     Image S/N Ratio:    7.74

  Analysis Position:   [ source = BAT ]
    RA: 170.941840070123   Dec: 8.93369375766324  [deg; J2000]

  Refined Position:   [ source = BAT pre-slew burst ]
    RA: 170.882824115002   Dec: 8.93146303341047  [deg; J2000]
        { 11h 23m 31.9s , +08d 55' 53.3" }
         +/- 0.48399954807925 [arcmin] (estimated 90% radius based on SNR)
         +/- 0.110939663549127 [arcmin] (formal 1-sigma fit error)
    SNR: 85.7708810482761

  Angular difference between the analysis and refined position is 3.500571 arcmin

  Partial Coding Fraction: 0.8671875    [ including projection effects ]

  Duration
     T90: 179.663999915123 +/- 1.46002191717733
        Measured from: 7.16400003433228
                   to: 186.827999949455     [s; relative to TRIGTIME]
     T50: 128.143999934196 +/- 1.46369944835646
        Measured from: 39.1080000400543
                   to: 167.251999974251     [s; relative to TRIGTIME]


  Fluence
     Peak Flux  (peak 1 second)
        Measured from: 138.056000053883
                   to: 139.056000053883     [s; relative to TRIGTIME]
     Total Fluence
        Measured from: -15.12399995327
                   to: 192.772000014782     [s; relative to TRIGTIME]

             Band 1     Band 2     Band 3     Band 4
              15-25      25-50     50-100    100-350     keV
 Total     8.853346  14.344203  14.094987   4.862000
           0.106657   0.119570   0.115880   0.096811 [error]
 Peak      0.129778   0.237015   0.274322   0.083077
           0.008267   0.010104   0.010501   0.008339 [error]

     [ fluence units of on-axis counts / fully illuminated detector ]

======================================================================


====== Table of the duration information =============================

        Value   tstart    tstop
T100  207.896  -15.124  192.772
T90   179.664    7.164  186.828
T50   128.144   39.108  167.252
Peak    1.000  138.056  139.056


====== Spectral Analysis Summary =====================================

Model      : spectral model: simple power-law (PL) and cutoff power-law (CPL)
Ph_index   : photon index: E^{Ph_index}
Ph_90err   : 90% error of the photon index
Epeak      : Epeak in keV
Epeak_90err: 90% error of Epeak
Norm       : normalization at 50 keV in both the PL model and CPL model
Nomr_90err : 90% error of the normalization
chi2       : Chi-Squared
dof        : degree of freedo

=== Time-averaged spectral analysis ===
(Best model with acceptable fit: PL)

Model Ph_index Ph_90err_low Ph_90err_hi  Epeak  Epeak_90err_low  Epeak_90err_hi  Norm       Nomr_90err_low    Norm_90err_hi    chi2    dof
PL      -1.116    -0.027      0.027       -           -               -         1.37e-02     -2.04e-04          2.03e-04      38.770   57
CPL     -1.109    -0.028      0.054     9996.950    -9996.950      -9996.950      1.37e-02     -1.84e-04          1.90e-04      39.120   56


=== 1-s peak spectral analysis ===
(Best model with acceptable fit: CPL)

Model Ph_index Ph_90err_low Ph_90err_hi  Epeak  Epeak_90err_low  Epeak_90err_hi  Norm       Nomr_90err_low    Norm_90err_hi    chi2    dof
PL      -0.966     -0.077     0.078       -           -               -         4.78e-02     -2.11e-03          2.11e-03      51.340   57
CPL     -0.501     -0.316     0.342      185.881     -54.917       249.223      7.68e-02     -2.07e-02          3.07e-02      44.820   56


=== Fluence/Peak Flux Summary ===

              Model    Band1     Band2     Band3     Band4     Band5     Total
                       15-25     25-50    50-100    100-350    15-150    15-350    keV
Fluence         PL   2.54e-06  5.90e-06  1.09e-05  4.82e-05  2.96e-05  6.75e-05   erg/cm2
      90%_error_low -8.59e-08 -1.18e-07 -1.53e-07 -1.66e-06 -4.02e-07 -1.67e-06   erg/cm2
      90%_error_hi   8.74e-08  1.18e-07  1.53e-07  1.70e-06  4.03e-07  1.71e-06   erg/cm2
Peak flux       PL   5.92e-04  7.16e-03  6.02e-02  6.92e+00  2.66e-01  4.73e+00   ph/cm2/s
      90%_error_low     N/A       N/A       N/A       N/A       N/A       N/A     ph/cm2/s
      90%_error_hi      N/A       N/A       N/A       N/A       N/A       N/A     ph/cm2/s

Fluence        CPL   2.53e-06  5.90e-06  1.09e-05  4.79e-05  2.96e-05  6.95e-05   erg/cm2
      90%_error_low    N/A    -1.18e-07 -1.53e-07    N/A    -4.02e-07    N/A      erg/cm2
      90%_error_hi     N/A     1.18e-07  1.53e-07    N/A     3.99e-07    N/A      erg/cm2
Peak flux      CPL   1.04e+00  1.67e+00  1.77e+00  2.00e+00  5.39e+00  6.48e+00   ph/cm2/s
      90%_error_low -1.34e-01 -9.57e-02 -1.04e-01 -4.96e-01 -2.55e-01 -5.62e-01   ph/cm2/s
      90%_error_hi   1.38e-01  9.63e-02  1.05e-01  7.04e-01  2.54e-01  7.36e-01   ph/cm2/s

======================================================================
Image
Pre-slew 15.0-350.0 keV image (Event data)
#   RAcent    DECcent   POSerr    Theta     Phi              Peak Cts       SNR   Name
  170.8828     8.9315   0.0022    15.6865  -108.9418        23.9560912     85.771 TRIG_00525068

Foreground time interval of the image:
-15.124 139.885 (delta_t = 155.009 [sec])
Background time interval of the image:
-239.016 -15.124 (delta_t = 223.892 [sec])
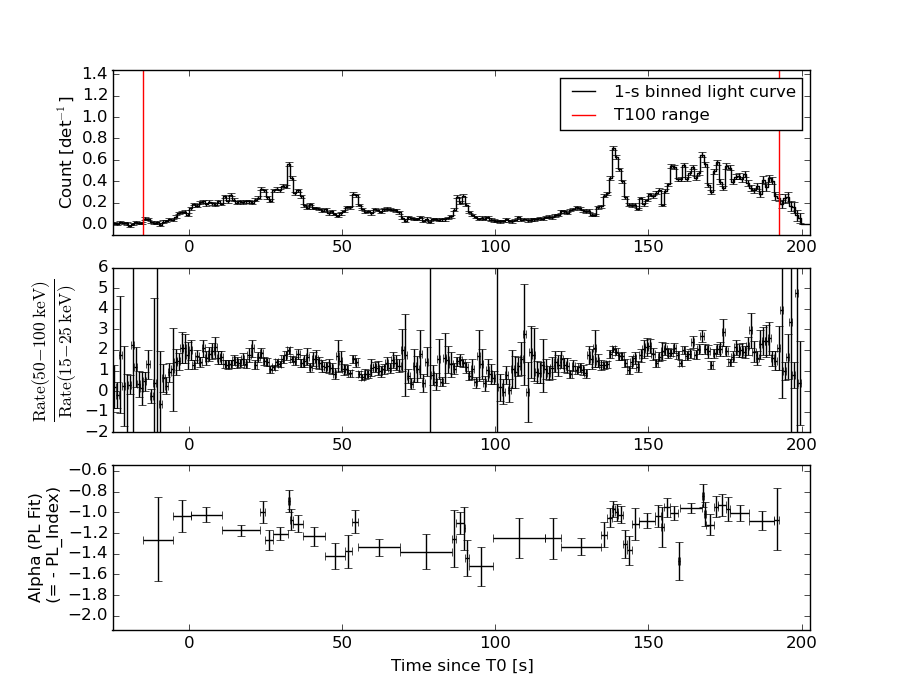
Light Curves
Note: The mask-weighted lightcurves have units of either count/det or counts/sec/det, where a det is 0.4 x 0.4 = 0.16 sq cm.
Full-time range; 1 s binning
Other quick-look light curves:
- 64 ms binning (zoomed)
- 16 ms binning (zoomed)
- 8 ms binning (zoomed)
- 2 ms binning (zoomed)
- SN=5 or 10 s binning (full-time range)
- Raw light curve
Spectra
- 64 ms binning (zoomed)
- 16 ms binning (zoomed)
- 8 ms binning (zoomed)
- 2 ms binning (zoomed)
- SN=5 or 10 s binning (full-time range)
- Raw light curve
Spectra
Notes:
- 1) The fitting includes the systematic errors.
- 2) When the burst includes telescope slew time periods, the fitting uses an average response file made from multiple 5-s response files through out the slew time plus single time preiod for the non-slew times, and weighted by the total counts in the corresponding time period using addrmf. An average response file is needed becuase a spectral fit using the pre-slew DRM will introduce some errors in both a spectral shape and a normalization if the PHA file contains a lot of the slew/post-slew time interval.
- 3) For fits to more complicated models (e.g. a power-law over a cutoff power-law), the BAT team has decided to require a chi-square improvement of more than 6 for each extra dof.
Time averaged spectrum fit using the average DRM
Power-law model
Time interval is from  -15.124 sec. to  192.772 sec.

Spectral model in power-law:
------------------------------------------------------------
Parameters  : value       lower 90%   higher 90%
Photon index: -1.11617     ( -0.0268945   0.0270059 )
Norm@50keV  : 1.36740E-02    ( -0.00020404   0.000203042 )
------------------------------------------------------------
#Fit statistic : Chi-Squared =          38.77 using 59 PHA bins.
# Reduced chi-squared =         0.6801 for     57 degrees of freedom
# Null hypothesis probability =   9.692294e-01

Photon flux (15-150 keV)    in 207.9 sec: 1.58867 ( -0.02579  0.02594 ) ph/cm2/s
Energy fluence (15-150 keV)             : 2.95736e-05 ( -4.02353e-07  4.03178e-07 ) ergs/cm2
Cutoff power-law model
Time interval is from  -15.124 sec. to  192.772 sec.
Spectral model in the cutoff power-law:
------------------------------------------------------------
Parameters  : value       lower 90%   higher 90%
Photon index: -1.10939     ( -0.0280785   0.0540108 )
Epeak [keV] : 9996.95      ( -9997.82 -9997.82 )
Norm@50keV  : 1.37407E-02    ( -0.000185058   0.00018889 )
------------------------------------------------------------
#Fit statistic : Chi-Squared =          39.12 using 59 PHA bins.
# Reduced chi-squared =         0.6986 for     56 degrees of freedom
# Null hypothesis probability =   9.578284e-01

Photon flux (15-150 keV)    in 207.9 sec: 1.58793 ( -0.02582  0.02591 ) ph/cm2/s
Energy fluence (15-150 keV)             : 2.95675e-05 ( -4.0237e-07  3.98856e-07 ) ergs/cm2
1-s peak spectrum fit
Power-law model
Time interval is from  138.056 sec. to  139.056 sec.

Spectral model in power-law:
------------------------------------------------------------
Parameters  : value       lower 90%   higher 90%
Photon index: -0.966001     ( -0.0773949   0.0778721 )
Norm@50keV  : 4.77714E-02    ( -0.00211306   0.00211202 )
------------------------------------------------------------
#Fit statistic : Chi-Squared =          51.34 using 59 PHA bins.
# Reduced chi-squared =         0.9007 for     57 degrees of freedom
# Null hypothesis probability =   6.864192e-01

Photon flux (15-150 keV)    in 1 sec: 0.265536 (    ) ph/cm2/s
Energy fluence (15-150 keV)             : 5.22998e-07 ( -2.60969e-08  2.62013e-08 ) ergs/cm2
Cutoff power-law model
Time interval is from  138.056 sec. to  139.056 sec.
Spectral model in the cutoff power-law:
------------------------------------------------------------
Parameters  : value       lower 90%   higher 90%
Photon index: -0.500761     ( -0.316328   0.342005 )
Epeak [keV] : 185.881      ( -54.9171 249.223 )
Norm@50keV  : 7.67773E-02    ( -0.0207001   0.0307 )
------------------------------------------------------------
#Fit statistic : Chi-Squared =          44.82 using 59 PHA bins.
# Reduced chi-squared =         0.8004 for     56 degrees of freedom
# Null hypothesis probability =   8.581297e-01

Photon flux (15-150 keV)    in 1 sec: 5.38895 ( -0.25483  0.25449 ) ph/cm2/s
Energy fluence (15-150 keV)             : 5.11246e-07 ( -2.78311e-08  2.77307e-08 ) ergs/cm2
Time-resolved spectra
Distribution
T90 vs. Hardness ratio plot
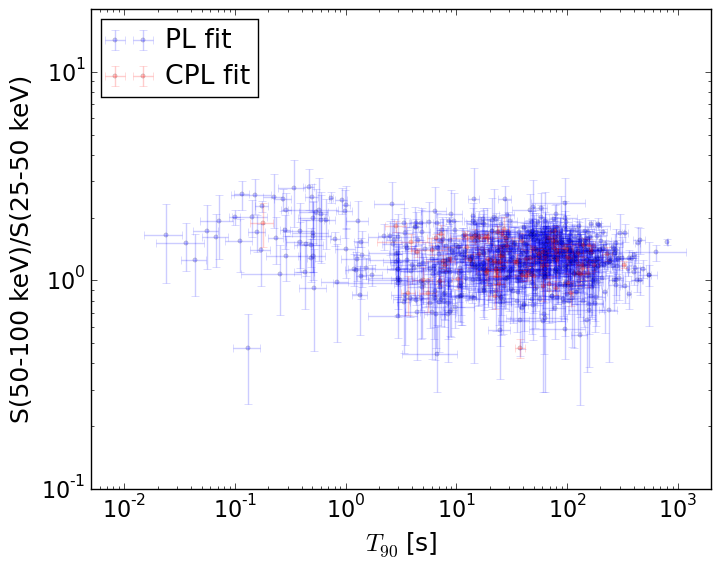
T90                                   = N/A sec.
Hardness ratio (energy fluence ratio) = N/A
S(15-50 keV) vs. S(50-150 keV) plot
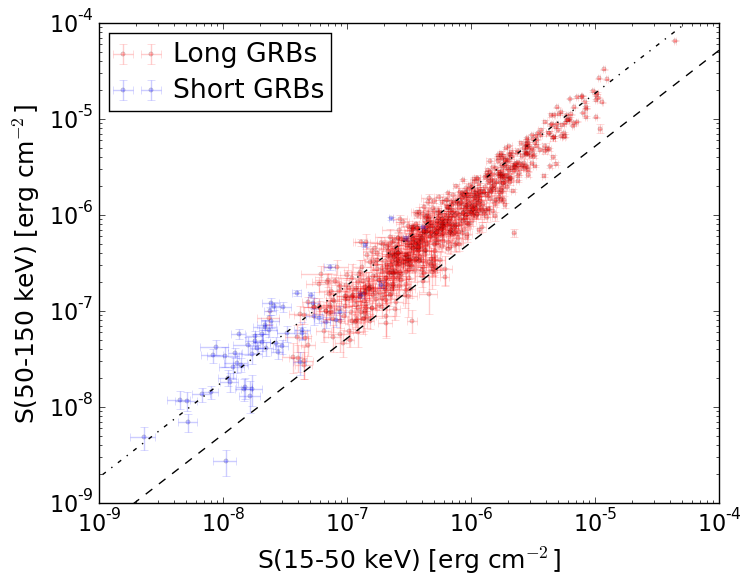
S(15-50 keV)  = N/A
S(50-150 keV) = N/A
The dash-dotted line and the dashed line traces the fluences calculated from the Band function with Epeak = 15 and 150 keV, respectively. Both lines assume a canonical values of alpha = -1 and beta = -2.5.
Mask shadow pattern
IMX = -9.116022833228478E-02, IMY = 2.656252137694277E-01
Spacecraft aspect plot
Bright source in the pre-burst/pre-slew/post-slew images
Pre-burst image of 15-350 keV band
Time interval of the image:
-239.016000 -15.124000

# RAcent  DECcent POSerr Theta    Phi  PeakCts   SNR AngSep     Name
#  [deg]    [deg]    ['] [deg]  [deg]                   [']
227.7513   7.2905    3.0  40.6   71.4   2.9745   3.8 ------	UNKNOWN
231.5882  48.6514    2.2  54.2   16.7   5.4234   5.3 ------	UNKNOWN
212.4656  44.7032    2.4  41.7    9.3   1.4665   4.9 ------	UNKNOWN
148.8587 -22.8481    2.4  49.2 -149.9   2.1765   4.8 ------	UNKNOWN
Pre-slew background subtracted image of 15-350 keV band
Time interval of the image:
-15.124000 139.884590

# RAcent  DECcent POSerr Theta    Phi  PeakCts   SNR AngSep     Name
#  [deg]    [deg]    ['] [deg]  [deg]                   [']
232.6529  42.9948    3.2  52.1   23.4   5.3529   3.6 ------	UNKNOWN
189.0461 -42.5255    2.7  52.0  159.5   5.5157   4.3 ------	UNKNOWN
215.3490  58.1905    3.1  53.4   -0.1   3.4395   3.7 ------	UNKNOWN
170.8828   8.9315    0.1  15.7 -108.9  23.9556  85.8 ------	UNKNOWN
192.3601  59.5283    2.6  50.3  -14.7   2.7196   4.4 ------	UNKNOWN
162.3136  15.4163    2.4  24.6  -91.9   1.6955   4.9 ------	UNKNOWN
Post-slew image of 15-350 keV band
Time interval of the image:
264.084590 439.784600

# RAcent  DECcent POSerr Theta    Phi  PeakCts   SNR AngSep     Name
#  [deg]    [deg]    ['] [deg]  [deg]                   [']
186.5878 -62.7182    2.7  40.8  -78.9   3.5913   4.2    3.7	GX 301-2
244.9791 -15.6383    0.6  31.7   41.4   5.2342  19.1    0.1	Sco X-1
255.9887 -37.8348    0.6   8.3   64.8   3.1737  18.8    0.6	4U 1700-377
256.6624 -36.3518    5.5   9.9   67.4   0.3761   2.1   11.8	GX 349+2
262.9888 -24.9014    5.5  22.2   79.4   0.4908   2.1    9.4	GX 1+4
264.8556 -44.6463    0.0   7.0  141.3   0.1301   0.7   12.7	4U 1735-44
270.3348 -25.1231    4.4  24.3   95.5   0.6435   2.7    3.8	GX 5-1
270.1825 -25.6387    5.5  23.8   95.8   0.5185   2.2    9.0	GRS 1758-258
273.9379 -14.1192    7.1  35.7   92.7   0.7865   1.6    6.3	GX 17+2
275.9968 -30.4327    4.3  22.5  113.4   0.6266   2.7    5.4	H1820-303
284.9686 -24.9414   42.8  31.9  118.9  -0.0870  -0.3    3.9	HT1900.1-2455
263.1042 -33.8160    3.9  13.7   89.2   0.5502   2.9    5.8	GX 354-0
  6.4305 -70.8028    3.2  53.2 -142.1   3.9363   3.6 ------	UNKNOWN
  6.6320 -67.5154    4.4  55.3 -145.3   3.9733   2.6 ------	UNKNOWN
186.7600 -36.5756    3.8  50.6  -44.6   2.8618   3.1 ------	UNKNOWN
 13.4432 -82.0456    2.6  48.0 -129.1   3.5699   4.6 ------	UNKNOWN