Analysis Summary
Notes:
- 1) No attempt has been made to eliminate the non-significant decimal places.
- 2) This batgrbproduct analysis is done using the HEASARC data.
- 3) This batgrbproduct analysis is using the flight position for the mask-weighting calculation.
======================================================================
BAT GRB EVENT DATA PROCESSING REPORT
Process Script Ver: batgrbproduct v2.46
Process Start Time: Mon Jan 13 03:54:17 EST 2014
Host Name: batevent1
Current Working Dir: /local/data/batevent/batevent_reproc/trigger525477
======================================================================
Trigger: 00525477 Segment: 000
BAT Trigger Time: 362821850.944 [s; MET]
Trigger Stop: 362821851.456 [s; MET]
UTC: 2012-07-01T07:50:41.566840 [includes UTCF correction]
Where From?: TDRSS position message
BAT
RA: 80.3524070788699 Dec: -58.5615086474503 [deg; J2000]
Catalogged Source?: NO
Point Source?: YES
GRB Indicated?: YES [ by BAT flight software ]
Image S/N Ratio: 8.78
Image Trigger?: NO
Rate S/N Ratio: 11.8743420870379 [ if not an image trigger ]
Image S/N Ratio: 8.78
Analysis Position: [ source = BAT ]
RA: 80.3524070788699 Dec: -58.5615086474503 [deg; J2000]
Refined Position: [ source = BAT pre-slew burst ]
RA: 80.3347479628263 Dec: -58.5318969948123 [deg; J2000]
{ 05h 21m 20.3s , -58d 31' 54.8" }
+/- 1.23024974295862 [arcmin] (estimated 90% radius based on SNR)
+/- 0.477526642567372 [arcmin] (formal 1-sigma fit error)
SNR: 22.6233308696194
Angular difference between the analysis and refined position is 1.860734 arcmin
Partial Coding Fraction: 0.609375 [ including projection effects ]
Duration
T90: 14.1599999666214 +/- 0.6541070433896
Measured from: 0.467999994754791
to: 14.6279999613762 [s; relative to TRIGTIME]
T50: 7.99599993228912 +/- 1.37199566468285
Measured from: 3.96799999475479
to: 11.9639999270439 [s; relative to TRIGTIME]
Fluence
Peak Flux (peak 1 second)
Measured from: 10.3600000143051
to: 11.3600000143051 [s; relative to TRIGTIME]
Total Fluence
Measured from: -0.0160000324249268
to: 15.3560000061989 [s; relative to TRIGTIME]
Band 1 Band 2 Band 3 Band 4
15-25 25-50 50-100 100-350 keV
Total 0.341187 0.626239 0.703032 0.216484
0.031530 0.033596 0.032107 0.029757 [error]
Peak 0.029825 0.057739 0.085361 0.027145
0.008084 0.008900 0.009056 0.007868 [error]
[ fluence units of on-axis counts / fully illuminated detector ]
======================================================================
====== Table of the duration information =============================
Value tstart tstop
T100 15.372 -0.016 15.356
T90 14.160 0.468 14.628
T50 7.996 3.968 11.964
Peak 1.000 10.360 11.360
====== Spectral Analysis Summary =====================================
Model : spectral model: simple power-law (PL) and cutoff power-law (CPL)
Ph_index : photon index: E^{Ph_index}
Ph_90err : 90% error of the photon index
Epeak : Epeak in keV
Epeak_90err: 90% error of Epeak
Norm : normalization at 50 keV in both the PL model and CPL model
Nomr_90err : 90% error of the normalization
chi2 : Chi-Squared
dof : degree of freedo
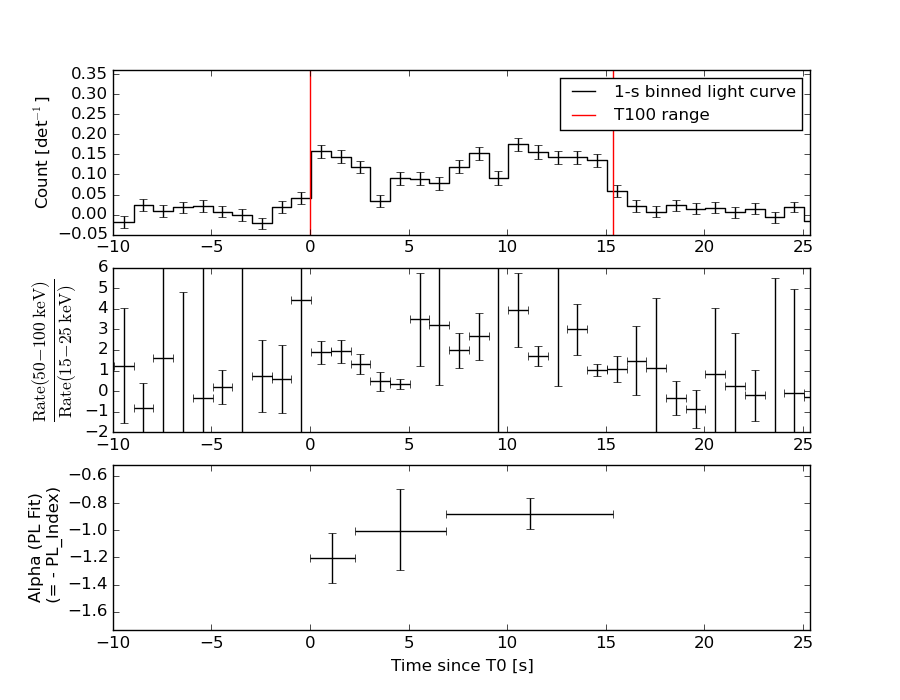
=== Time-averaged spectral analysis ===
(Best model with acceptable fit: PL)
Model Ph_index Ph_90err_low Ph_90err_hi Epeak Epeak_90err_low Epeak_90err_hi Norm Nomr_90err_low Norm_90err_hi chi2 dof
PL -0.967 -0.097 0.099 - - - 8.60e-03 -4.65e-04 4.63e-04 59.210 57
CPL -0.897 -0.244 0.327 930.171 -930.171 -930.171 9.22e-03 -1.03e-03 3.30e-03 59.260 56
=== 1-s peak spectral analysis ===
(Best model with acceptable fit: PL)
Model Ph_index Ph_90err_low Ph_90err_hi Epeak Epeak_90err_low Epeak_90err_hi Norm Nomr_90err_low Norm_90err_hi chi2 dof
PL -0.705 -0.233 0.249 - - - 1.35e-02 -1.96e-03 1.91e-03 59.370 57
CPL -0.469 -0.445 0.971 415.611 -415.611 -415.611 1.68e-02 -4.57e-03 2.72e-02 59.190 56
=== Fluence/Peak Flux Summary ===
Model Band1 Band2 Band3 Band4 Band5 Total
15-25 25-50 50-100 100-350 15-150 15-350 keV
Fluence PL 1.03e-07 2.62e-07 5.36e-07 2.77e-06 1.45e-06 3.67e-06 erg/cm2
90%_error_low -1.18e-08 -1.80e-08 -3.05e-08 -3.62e-07 -8.09e-08 -3.76e-07 erg/cm2
90%_error_hi 1.23e-08 1.78e-08 3.04e-08 4.02e-07 8.11e-08 4.11e-07 erg/cm2
Peak flux PL 2.62e-01 4.24e-01 5.21e-01 1.26e+00 1.56e+00 2.47e+00 ph/cm2/s
90%_error_low -7.72e-02 -8.20e-02 -6.70e-02 -3.29e-01 -2.10e-01 -3.58e-01 ph/cm2/s
90%_error_hi 8.79e-02 8.11e-02 6.68e-02 4.06e-01 2.12e-01 3.88e-01 ph/cm2/s
Fluence CPL 3.52e-08 4.69e-08 4.83e-08 1.15e-07 1.61e-07 2.66e-07 erg/cm2
90%_error_low -1.80e-08 -1.20e-08 -2.64e-08 N/A N/A N/A erg/cm2
90%_error_hi 8.56e-09 2.38e-08 1.95e-08 N/A N/A N/A erg/cm2
Peak flux CPL 2.41e-01 4.25e-01 5.37e-01 1.02e+00 1.55e+00 2.22e+00 ph/cm2/s
90%_error_low -1.03e-01 -8.47e-02 -7.95e-02 -5.52e-01 -2.17e-01 -6.11e-01 ph/cm2/s
90%_error_hi 1.04e-01 8.35e-02 9.32e-02 3.35e-01 2.18e-01 4.66e-01 ph/cm2/s
======================================================================
Image
Pre-slew 15.0-350.0 keV image (Event data)
#   RAcent    DECcent   POSerr    Theta     Phi              Peak Cts       SNR   Name
   80.3347   -58.5319   0.0085    32.7365   162.1812         1.2691040     22.623 TRIG_00525477

Foreground time interval of the image:
 -0.016  10.757 (delta_t =  10.773 [sec])
Background time interval of the image:
-182.243  -0.016 (delta_t = 182.227 [sec])
Light Curves
Note: The mask-weighted lightcurves have units of either count/det or counts/sec/det, where a det is 0.4 x 0.4 = 0.16 sq cm.
Full-time range; 1 s binning
Other quick-look light curves:
- 64 ms binning (zoomed)
- 16 ms binning (zoomed)
- 8 ms binning (zoomed)
- 2 ms binning (zoomed)
- SN=5 or 10 s binning (full-time range)
- Raw light curve
Spectra
- 64 ms binning (zoomed)
- 16 ms binning (zoomed)
- 8 ms binning (zoomed)
- 2 ms binning (zoomed)
- SN=5 or 10 s binning (full-time range)
- Raw light curve
Spectra
Notes:
- 1) The fitting includes the systematic errors.
- 2) When the burst includes telescope slew time periods, the fitting uses an average response file made from multiple 5-s response files through out the slew time plus single time preiod for the non-slew times, and weighted by the total counts in the corresponding time period using addrmf. An average response file is needed becuase a spectral fit using the pre-slew DRM will introduce some errors in both a spectral shape and a normalization if the PHA file contains a lot of the slew/post-slew time interval.
- 3) For fits to more complicated models (e.g. a power-law over a cutoff power-law), the BAT team has decided to require a chi-square improvement of more than 6 for each extra dof.
Time averaged spectrum fit using the average DRM
Power-law model
Time interval is from   -0.016 sec. to   15.356 sec.

Spectral model in power-law:
------------------------------------------------------------
Parameters  : value       lower 90%   higher 90%
Photon index: -0.967414     ( -0.0970661   0.0988848 )
Norm@50keV  : 8.59557E-03    ( -0.000464721   0.000462709 )
------------------------------------------------------------
#Fit statistic : Chi-Squared =          59.21 using 59 PHA bins.
# Reduced chi-squared =          1.039 for     57 degrees of freedom
# Null hypothesis probability =   3.948076e-01

Photon flux (15-150 keV)    in 15.37 sec: 0.988131 ( -0.054354  0.054539 ) ph/cm2/s
Energy fluence (15-150 keV)             : 1.44562e-06 ( -8.08668e-08  8.11166e-08 ) ergs/cm2
Cutoff power-law model
Time interval is from   -0.016 sec. to   15.356 sec.
Spectral model in the cutoff power-law:
------------------------------------------------------------
Parameters  : value       lower 90%   higher 90%
Photon index: -0.961213     ( -0.240037   0.331159 )
Epeak [keV] : 9998.51      ( -9998.51 -9998.51 )
Norm@50keV  : 8.64849E-03    ( -0.000459874   0.00386522 )
------------------------------------------------------------
#Fit statistic : Chi-Squared =          59.21 using 59 PHA bins.
# Reduced chi-squared =          1.057 for     56 degrees of freedom
# Null hypothesis probability =   3.593678e-01

Photon flux (15-150 keV)    in 15.37 sec: 0.987805 ( -0.054744  0.054345 ) ph/cm2/s
Energy fluence (15-150 keV)             : 1.61233e-07 ( 0  0 ) ergs/cm2
1-s peak spectrum fit
Power-law model

Time interval is from   10.360 sec. to   11.360 sec.

Spectral model in power-law:
------------------------------------------------------------
Parameters  : value       lower 90%   higher 90%
Photon index: -0.704711     ( -0.233166   0.249203 )
Norm@50keV  : 1.35412E-02    ( -0.00195647   0.00190596 )
------------------------------------------------------------
#Fit statistic : Chi-Squared =          59.37 using 59 PHA bins.
# Reduced chi-squared =          1.042 for     57 degrees of freedom
# Null hypothesis probability =   3.891701e-01

Photon flux (15-150 keV)    in 1 sec: 1.56465 ( -0.21047  0.2116 ) ph/cm2/s
Energy fluence (15-150 keV)             : 1.64957e-07 ( -2.20051e-08  2.20638e-08 ) ergs/cm2
Cutoff power-law model
Time interval is from   10.360 sec. to   11.360 sec.
Spectral model in the cutoff power-law:
------------------------------------------------------------
Parameters  : value       lower 90%   higher 90%
Photon index: -0.468631     ( -0.444881   0.970943 )
Epeak [keV] : 415.611      ( -415.612 -415.612 )
Norm@50keV  : 1.67835E-02    ( -0.00456608   0.027186 )
------------------------------------------------------------
#Fit statistic : Chi-Squared =          59.19 using 59 PHA bins.
# Reduced chi-squared =          1.057 for     56 degrees of freedom
# Null hypothesis probability =   3.598718e-01

Photon flux (15-150 keV)    in 1 sec: 1.55098 ( -0.21684  0.21802 ) ph/cm2/s
Energy fluence (15-150 keV)             : 1.64059e-07 ( -2.26979e-08  2.24286e-08 ) ergs/cm2
Time-resolved spectra
Distribution
T90 vs. Hardness ratio plot
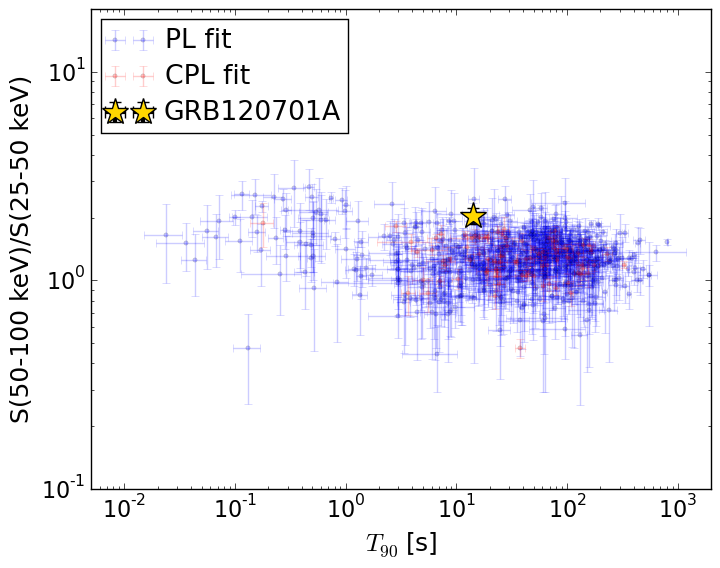
T90                                   = 14.16 sec.
Hardness ratio (energy fluence ratio) = 2.04569028636
S(15-50 keV) vs. S(50-150 keV) plot
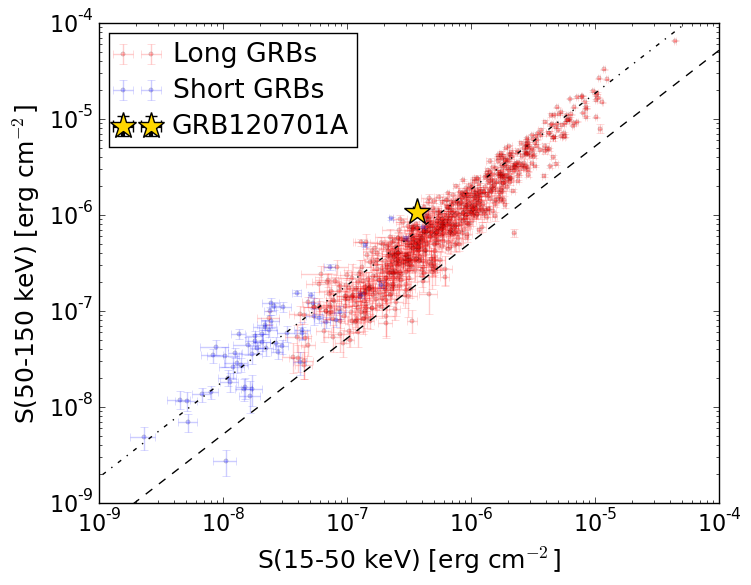
S(15-50 keV)  = 3.646508e-07
S(50-150 keV) = 1.0809724e-06
The dash-dotted line and the dashed line traces the fluences calculated from the Band function with Epeak = 15 and 150 keV, respectively. Both lines assume a canonical values of alpha = -1 and beta = -2.5.
Mask shadow pattern
IMX = -6.120485563868362E-01, IMY = -1.967291612168200E-01
Spacecraft aspect plot
Bright source in the pre-burst/pre-slew/post-slew images
Pre-burst image of 15-350 keV band
Time interval of the image:
-182.243400 -0.016000

# RAcent  DECcent POSerr Theta    Phi  PeakCts   SNR AngSep     Name
#  [deg]    [deg]    ['] [deg]  [deg]                   [']
135.4685 -40.5334    1.7   5.9  -23.1   1.1935   6.8    3.0	Vela X-1
170.1113 -60.6051    2.0  28.0   72.6   1.6441   5.7    6.1	Cen X-3
186.6405 -62.9000    4.1  36.1   74.5   1.3672   2.8    7.8	GX 301-2
184.2869 -20.6593    2.5  50.4   14.2   2.3689   4.6 ------	UNKNOWN
128.9717 -43.1877    1.4   2.1  -91.8   1.4316   8.1 ------	UNKNOWN
108.5398  -8.1598    3.4  41.4  -99.0   3.2690   3.4 ------	UNKNOWN
Pre-slew background subtracted image of 15-350 keV band
Time interval of the image:
-0.016000 10.756590

# RAcent  DECcent POSerr Theta    Phi  PeakCts   SNR AngSep     Name
#  [deg]    [deg]    ['] [deg]  [deg]                   [']
135.2617 -40.4934    0.0   5.9  -24.6  -0.0198  -0.5   12.7	Vela X-1
170.2986 -60.6201   51.8  28.1   72.5  -0.0155  -0.2    0.5	Cen X-3
186.5681 -62.7110   12.2  36.1   74.2   0.1044   0.9    4.3	GX 301-2
 80.3347 -58.5319    0.5  32.7  162.2   1.2691  22.6 ------	UNKNOWN
178.3507 -10.8029    2.2  53.4    0.2   0.6728   5.2 ------	UNKNOWN
154.6933 -12.4847    2.6  38.7  -25.1   0.2485   4.4 ------	UNKNOWN
Post-slew image of 15-350 keV band
Time interval of the image:
63.156600 962.143300

# RAcent  DECcent POSerr Theta    Phi  PeakCts   SNR AngSep     Name
#  [deg]    [deg]    ['] [deg]  [deg]                   [']
135.5238 -40.5596    1.0  38.6  -21.5   7.9844  11.4    0.4	Vela X-1
170.2994 -60.6170    4.7  41.9   24.2   2.5877   2.4    0.6	Cen X-3
186.6168 -62.7697 2700.0  46.2   33.9   0.0021   0.0    1.1	GX 301-2
203.4402 -68.1940    4.3  46.6   46.0   6.5978   2.7 ------	UNKNOWN
353.8721 -71.7460    3.7  34.9  104.5   4.1731   3.1 ------	UNKNOWN
  1.0725 -53.0828    2.9  42.2  132.8   7.3244   4.1 ------	UNKNOWN
128.9722 -43.1769    1.3  33.3  -24.3   5.4082   8.9 ------	UNKNOWN
 52.1975 -15.3860    2.6  48.0 -146.4   5.8411   4.4 ------	UNKNOWN
 75.0125 -15.0348    2.9  43.7 -116.1   8.8671   4.0 ------	UNKNOWN