Analysis Summary
Notes:
- 1) No attempt has been made to eliminate the non-significant decimal places.
- 2) This batgrbproduct analysis is done using the HEASARC data.
- 3) This batgrbproduct analysis is using the flight position for the mask-weighting calculation.
======================================================================
BAT GRB EVENT DATA PROCESSING REPORT
Process Script Ver: batgrbproduct v2.46
Process Start Time: Mon Jan 13 03:44:02 EST 2014
Host Name: batevent1
Current Working Dir: /local/data/batevent/batevent_reproc/trigger526270
======================================================================
Trigger: 00526270 Segment: 000
BAT Trigger Time: 363669072 [s; MET]
Trigger Stop: 363669136 [s; MET]
UTC: 2012-07-11T03:11:02.587440 [includes UTCF correction]
Where From?: TDRSS position message
BAT
RA: 331.668154858708 Dec: 60.0195598602082 [deg; J2000]
Catalogged Source?: NO
Point Source?: YES
GRB Indicated?: YES [ by BAT flight software ]
Image S/N Ratio: 7.65
Image Trigger?: YES
Rate S/N Ratio: 0 [ if not an image trigger ]
Image S/N Ratio: 7.65
Analysis Position: [ source = BAT ]
RA: 331.668154858708 Dec: 60.0195598602082 [deg; J2000]
Refined Position: [ source = BAT pre-slew burst ]
RA: 331.668 Dec: 60.0196 [deg; J2000]
{ 22h 06m 40.3s , +60d 01' 10.6" }
+/- 2.78147568926 [arcmin] (estimated 90% radius based on SNR)
SNR: 7.05498740443
Angular difference between the analysis and refined position is 0.005230 arcmin
Partial Coding Fraction: 0.8046875 [ including projection effects ]
Duration
T90: 60.0960000157356 +/- 20.144552825529
Measured from: -11.0640000104904
to: 49.0320000052452 [s; relative to TRIGTIME]
T50: 23.8719999790192 +/- 21.0544436621287
Measured from: 8.07200002670288
to: 31.944000005722 [s; relative to TRIGTIME]
Fluence
Peak Flux (peak 1 second)
Measured from: 13.1079999804497
to: 14.1079999804497 [s; relative to TRIGTIME]
Total Fluence
Measured from: -12.0879999995232
to: 51.3999999761581 [s; relative to TRIGTIME]
Band 1 Band 2 Band 3 Band 4
15-25 25-50 50-100 100-350 keV
Total 0.294071 0.440013 0.207852 0.112954
0.056935 0.058844 0.056538 0.056769 [error]
Peak 0.013137 0.010775 0.019682 0.018122
0.007153 0.007474 0.007137 0.007149 [error]
[ fluence units of on-axis counts / fully illuminated detector ]
======================================================================
====== Table of the duration information =============================
Value tstart tstop
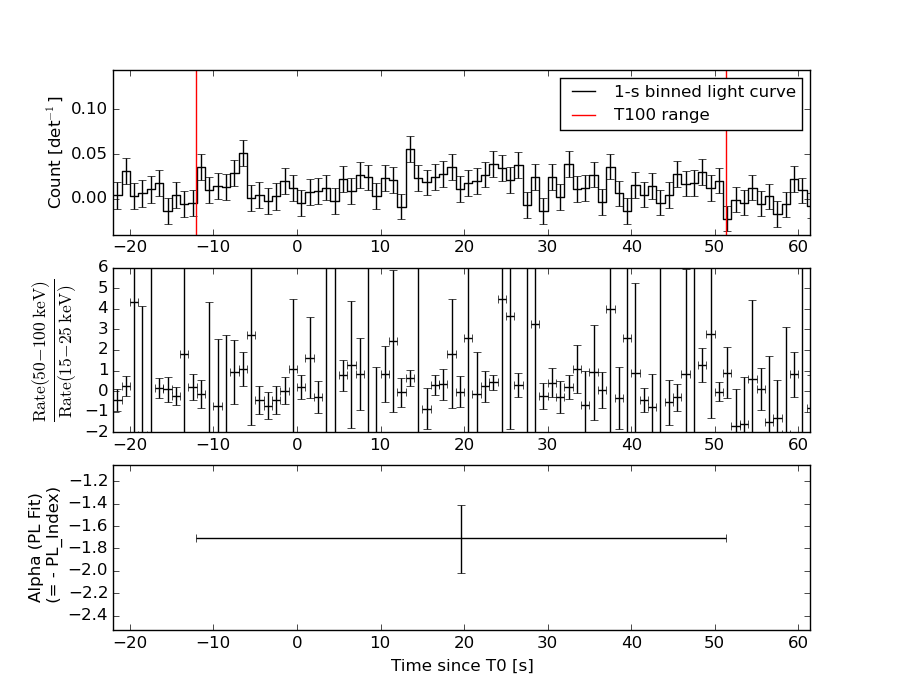
T100 63.488 -12.088 51.400
T90 60.096 -11.064 49.032
T50 23.872 8.072 31.944
Peak 1.000 13.108 14.108
====== Spectral Analysis Summary =====================================
Model : spectral model: simple power-law (PL) and cutoff power-law (CPL)
Ph_index : photon index: E^{Ph_index}
Ph_90err : 90% error of the photon index
Epeak : Epeak in keV
Epeak_90err: 90% error of Epeak
Norm : normalization at 50 keV in both the PL model and CPL model
Nomr_90err : 90% error of the normalization
chi2 : Chi-Squared
dof : degree of freedo
=== Time-averaged spectral analysis ===
(Best model with acceptable fit: PL)
Model Ph_index Ph_90err_low Ph_90err_hi Epeak Epeak_90err_low Epeak_90err_hi Norm Nomr_90err_low Norm_90err_hi chi2 dof
PL -1.707 -0.316 0.297 - - - 9.99e-04 -2.02e-04 1.96e-04 43.490 57
CPL -0.892 -1.200 2.182 55.309 -33.158 -55.309 3.00e-03 -3.00e-03 5.75e-02 42.670 56
=== 1-s peak spectral analysis ===
(Best model with acceptable fit: N/A)
Model Ph_index Ph_90err_low Ph_90err_hi Epeak Epeak_90err_low Epeak_90err_hi Norm Nomr_90err_low Norm_90err_hi chi2 dof
PL -0.606 -0.878 1.352 - - - 3.47e-03 -3.47e-03 1.56e-03 47.090 57
CPL -0.640 -0.842 1.467 9999.360 -9999.360 -9999.360 3.54e-03 -2.11e-03 3.36e-02 47.100 56
=== Fluence/Peak Flux Summary ===
Model Band1 Band2 Band3 Band4 Band5 Total
15-25 25-50 50-100 100-350 15-150 15-350 keV
Fluence PL 9.84e-08 1.59e-07 1.95e-07 4.71e-07 5.87e-07 9.24e-07 erg/cm2
90%_error_low -2.31e-08 -2.64e-08 -5.25e-08 -2.13e-07 -1.22e-07 -2.75e-07 erg/cm2
90%_error_hi 2.40e-08 2.64e-08 5.41e-08 3.10e-07 1.27e-07 3.57e-07 erg/cm2
Peak flux PL 6.10e-02 1.05e-01 1.38e-01 3.69e-01 4.04e-01 6.73e-01 ph/cm2/s
90%_error_low -6.10e-02 -1.05e-01 -5.63e-02 -2.65e-01 -4.04e-01 -3.00e-01 ph/cm2/s
90%_error_hi 8.91e-02 6.93e-02 5.43e-02 1.95e+00 1.61e-01 6.63e-01 ph/cm2/s
Fluence CPL 9.26e-08 1.76e-07 1.83e-07 1.12e-07 5.22e-07 5.64e-07 erg/cm2
90%_error_low -2.71e-08 -3.63e-08 -7.56e-08 -1.03e-07 -1.41e-07 -1.81e-07 erg/cm2
90%_error_hi 2.65e-08 4.23e-08 6.28e-08 4.23e-07 1.68e-07 4.67e-07 erg/cm2
Peak flux CPL 6.14e-02 1.05e-01 1.38e-01 3.63e-01 4.05e-01 6.69e-01 ph/cm2/s
90%_error_low -6.14e-02 N/A N/A N/A -1.71e-01 N/A ph/cm2/s
90%_error_hi 8.89e-02 N/A N/A N/A 1.72e-01 N/A ph/cm2/s
======================================================================
Image
Pre-slew 15.0-50.0 keV image (Event data)
#RAcent DECcent POSerr Theta  Phi  Peak_Cts  SNR Name
331.668 60.020 0.000 17.079 -93.128 0.611 7.055 TRIG_00526270

Image time interval: 0.000 to 64.000 [sec]
Light Curves
Note: The mask-weighted lightcurves have units of either count/det or counts/sec/det, where a det is 0.4 x 0.4 = 0.16 sq cm.
Full-time range; 1 s binning
Other quick-look light curves:
- 64 ms binning (zoomed)
- 16 ms binning (zoomed)
- 8 ms binning (zoomed)
- 2 ms binning (zoomed)
- SN=5 or 10 s binning (full-time range)
- Raw light curve
Spectra
- 64 ms binning (zoomed)
- 16 ms binning (zoomed)
- 8 ms binning (zoomed)
- 2 ms binning (zoomed)
- SN=5 or 10 s binning (full-time range)
- Raw light curve
Spectra
Notes:
- 1) The fitting includes the systematic errors.
- 2) When the burst includes telescope slew time periods, the fitting uses an average response file made from multiple 5-s response files through out the slew time plus single time preiod for the non-slew times, and weighted by the total counts in the corresponding time period using addrmf. An average response file is needed becuase a spectral fit using the pre-slew DRM will introduce some errors in both a spectral shape and a normalization if the PHA file contains a lot of the slew/post-slew time interval.
- 3) For fits to more complicated models (e.g. a power-law over a cutoff power-law), the BAT team has decided to require a chi-square improvement of more than 6 for each extra dof.
Time averaged spectrum fit using the average DRM
Power-law model
Time interval is from  -12.088 sec. to   51.400 sec.

Spectral model in power-law:
------------------------------------------------------------
Parameters  : value       lower 90%   higher 90%
Photon index: -1.70744     ( -0.315989   0.297467 )
Norm@50keV  : 9.98657E-04    ( -0.000202201   0.000196035 )
------------------------------------------------------------
#Fit statistic : Chi-Squared =          43.49 using 59 PHA bins.
# Reduced chi-squared =         0.7629 for     57 degrees of freedom
# Null hypothesis probability =   9.063198e-01

Photon flux (15-150 keV)    in 63.49 sec: 0.132985 ( -0.022  0.022001 ) ph/cm2/s
Energy fluence (15-150 keV)             : 5.86807e-07 ( -1.21783e-07  1.27155e-07 ) ergs/cm2
Cutoff power-law model
Time interval is from  -12.088 sec. to   51.400 sec.
Spectral model in the cutoff power-law:
------------------------------------------------------------
Parameters  : value       lower 90%   higher 90%
Photon index: -0.891897     ( -1.20921   2.17311 )
Epeak [keV] : 55.3094      ( -32.8671 -55.0185 )
Norm@50keV  : 3.00355E-03    ( -0.00307167   0.0574675 )
------------------------------------------------------------
#Fit statistic : Chi-Squared =          42.67 using 59 PHA bins.
# Reduced chi-squared =         0.7621 for     56 degrees of freedom
# Null hypothesis probability =   9.051111e-01

Photon flux (15-150 keV)    in 63.49 sec: 0.128048 ( -0.023619  0.023837 ) ph/cm2/s
Energy fluence (15-150 keV)             : 5.22342e-07 ( -1.40543e-07  1.68065e-07 ) ergs/cm2
1-s peak spectrum fit
Power-law model
Time interval is from   13.108 sec. to   14.108 sec.

Spectral model in power-law:
------------------------------------------------------------
Parameters  : value       lower 90%   higher 90%
Photon index: -0.605754     ( -0.877897   1.35167 )
Norm@50keV  : 3.46508E-03    ( -0.00346468   0.00155806 )
------------------------------------------------------------
#Fit statistic : Chi-Squared =          47.09 using 59 PHA bins.
# Reduced chi-squared =         0.8261 for     57 degrees of freedom
# Null hypothesis probability =   8.225578e-01

Photon flux (15-150 keV)    in 1 sec: 0.404251 6.71025E-02 (    ) ph/cm2/s
Energy fluence (15-150 keV)             : 4.41998e-08 ( -1.86304e-08  1.8819e-08 ) ergs/cm2
Cutoff power-law model
Time interval is from   13.108 sec. to   14.108 sec.
Spectral model in the cutoff power-law:
------------------------------------------------------------
Parameters  : value       lower 90%   higher 90%
Photon index: -0.640419     ( -0.843302   1.46513 )
Epeak [keV] : 9999.36      ( -9999.36 -9999.36 )
Norm@50keV  : 3.53509E-03    ( -0.00210556   0.0336171 )
------------------------------------------------------------
#Fit statistic : Chi-Squared =          47.10 using 59 PHA bins.
# Reduced chi-squared =         0.8411 for     56 degrees of freedom
# Null hypothesis probability =   7.955739e-01

Photon flux (15-150 keV)    in 1 sec: 0.404587 ( -0.170966  0.171773 ) ph/cm2/s
Energy fluence (15-150 keV)             : 4.40829e-08 ( 0  0 ) ergs/cm2
Time-resolved spectra
Distribution
T90 vs. Hardness ratio plot
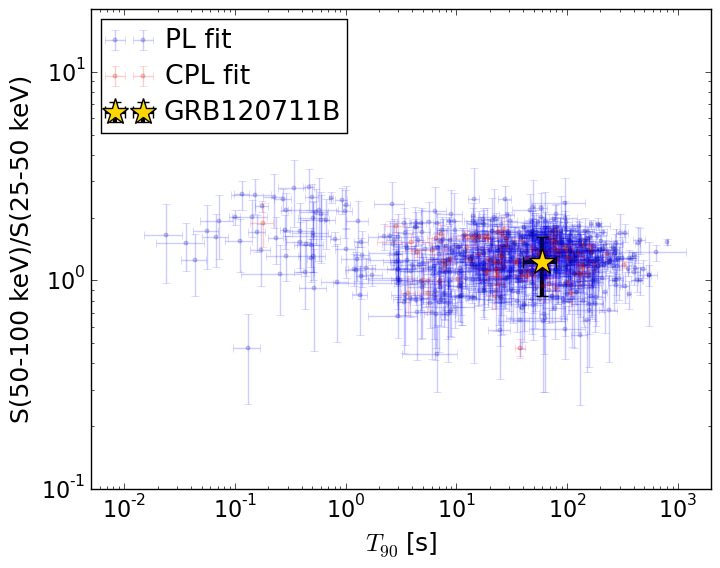
T90                                   = 60.096 sec.
Hardness ratio (energy fluence ratio) = 1.2248417657
S(15-50 keV) vs. S(50-150 keV) plot
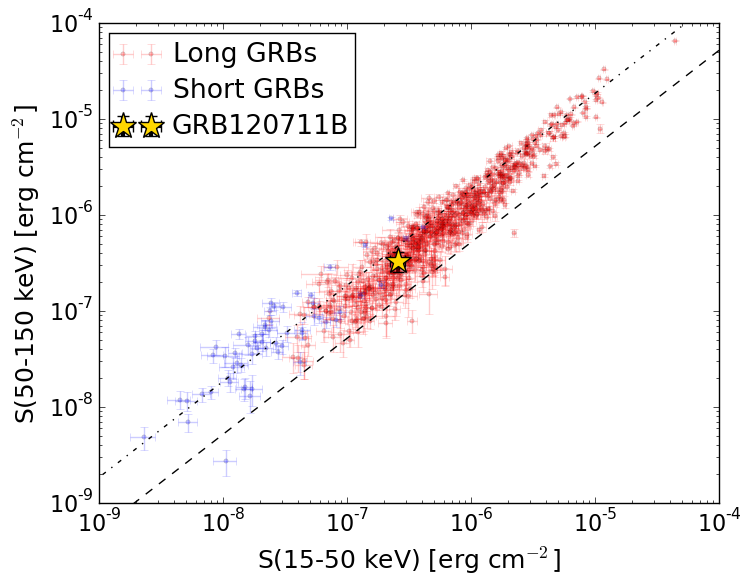
S(15-50 keV)  = 2.5772975e-07
S(50-150 keV) = 3.290727e-07
The dash-dotted line and the dashed line traces the fluences calculated from the Band function with Epeak = 15 and 150 keV, respectively. Both lines assume a canonical values of alpha = -1 and beta = -2.5.
Mask shadow pattern
IMX = -0.0167664741587, IMY = 0.306780430715
Spacecraft aspect plot
Bright source in the pre-burst/pre-slew/post-slew images
Pre-burst image of 15-350 keV band
Time interval of the image:
-179.000000 -12.088000

# RAcent  DECcent POSerr Theta    Phi  PeakCts   SNR AngSep     Name
#  [deg]    [deg]    ['] [deg]  [deg]                   [']
254.3079  35.2519   27.9  48.5  165.4   0.3375   0.4    9.1	Her X-1
299.7150  35.1965    7.7  17.1  125.1   0.5066   1.5    6.1	Cyg X-1
308.0571  40.9178    5.2   8.4  128.4   0.6634   2.2    3.2	Cyg X-3
326.1631  38.4380    5.9   8.8   18.3   0.5349   2.0    7.0	Cyg X-2
280.2176  41.5541    3.2  27.6  160.0   1.2357   3.6 ------	UNKNOWN
220.6215  54.1858    4.9  58.8 -159.2   4.6168   2.4 ------	UNKNOWN
219.7291  56.3363    2.9  58.0 -156.8   6.4694   4.0 ------	UNKNOWN
 26.2102  60.8230    2.4  41.8  -73.8   5.9111   4.9 ------	UNKNOWN
Pre-slew background subtracted image of 15-350 keV band
Time interval of the image:
-12.088000 51.400000

# RAcent  DECcent POSerr Theta    Phi  PeakCts   SNR AngSep     Name
#  [deg]    [deg]    ['] [deg]  [deg]                   [']
254.2533  35.4166    7.0  48.5  165.6  -0.5765  -1.6   10.9	Her X-1
299.7401  35.0869    7.6  17.2  124.7  -0.2118  -1.5   10.1	Cyg X-1
308.0905  41.1169    6.0   8.3  129.4   0.2501   1.9    9.9	Cyg X-3
326.1411  38.3929   19.0   8.9   18.6  -0.0765  -0.6    4.5	Cyg X-2
308.1004  10.6818    2.6  35.4   80.8   1.4713   4.4 ------	UNKNOWN
330.8527  42.3806    2.4   9.5  -15.3   0.6139   4.9 ------	UNKNOWN
331.7104  59.9925    2.0  17.1  -93.0   0.7846   5.7 ------	UNKNOWN
257.7541  65.7044    2.3  38.0 -152.0   0.8403   4.9 ------	UNKNOWN
Post-slew image of 15-350 keV band
Time interval of the image:
112.500610 864.300600

# RAcent  DECcent POSerr Theta    Phi  PeakCts   SNR AngSep     Name
#  [deg]    [deg]    ['] [deg]  [deg]                   [']
299.6082  35.2759    2.8  32.2  107.2   4.0513   4.1    4.5	Cyg X-1
308.0558  40.9644    2.3  24.0  101.0   3.5277   5.1    2.6	Cyg X-3
326.2170  38.2738    3.4  22.0   64.3   2.2100   3.4    3.6	Cyg X-2
358.5633  10.1933    3.1  53.7   19.3   9.2494   3.7 ------	UNKNOWN
  9.9136  56.7122    3.3  20.0  -44.6   1.7727   3.5 ------	UNKNOWN
217.2498  50.6595    4.2  57.4 -170.4   7.9462   2.7 ------	UNKNOWN
202.7436  54.2318    4.7  58.7 -159.3  13.0168   2.5 ------	UNKNOWN
 35.0574  36.2211    2.4  46.2  -35.8   4.8956   4.7 ------	UNKNOWN
200.0790  55.8704    3.6  58.0 -156.8  14.0540   3.2 ------	UNKNOWN
180.9805  64.8836    3.4  53.2 -142.2  11.2251   3.4 ------	UNKNOWN