Analysis Summary
Notes:
- 1) No attempt has been made to eliminate the non-significant decimal places.
- 2) This batgrbproduct analysis is done using the HEASARC data.
- 3) This batgrbproduct analysis is using the flight position for the mask-weighting calculation.
======================================================================
BAT GRB EVENT DATA PROCESSING REPORT
Process Script Ver: batgrbproduct v2.46
Process Start Time: Fri Jun 12 00:53:44 EDT 2015
Host Name: bat1
Current Working Dir: /local/data/bat1/alien/Swift_3rdBATcatalog/event/batevent_reproc/trigger526351
======================================================================
Trigger: 00526351 Segment: 000
BAT Trigger Time: 363793356.8 [s; MET]
Trigger Stop: 363793357.824 [s; MET]
UTC: 2012-07-12T13:42:27.382260 [includes UTCF correction]
Where From?: TDRSS position message
BAT
RA: 169.60548368771 Dec: -20.0607384702281 [deg; J2000]
Catalogged Source?: NO
Point Source?: YES
GRB Indicated?: YES [ by BAT flight software ]
Image S/N Ratio: 11.6
Image Trigger?: NO
Rate S/N Ratio: 20.4694894904587 [ if not an image trigger ]
Image S/N Ratio: 11.6
Analysis Position: [ source = BAT ]
RA: 169.60548368771 Dec: -20.0607384702281 [deg; J2000]
Refined Position: [ source = BAT pre-slew burst ]
RA: 169.598341106773 Dec: -20.0508031513664 [deg; J2000]
{ 11h 18m 23.6s , -20d 03' 02.9" }
+/- 0.905939596473807 [arcmin] (estimated 90% radius based on SNR)
+/- 0.407822071365021 [arcmin] (formal 1-sigma fit error)
SNR: 35.0271802338161
Angular difference between the analysis and refined position is 0.719318 arcmin
Partial Coding Fraction: 0.5546875 [ including projection effects ]
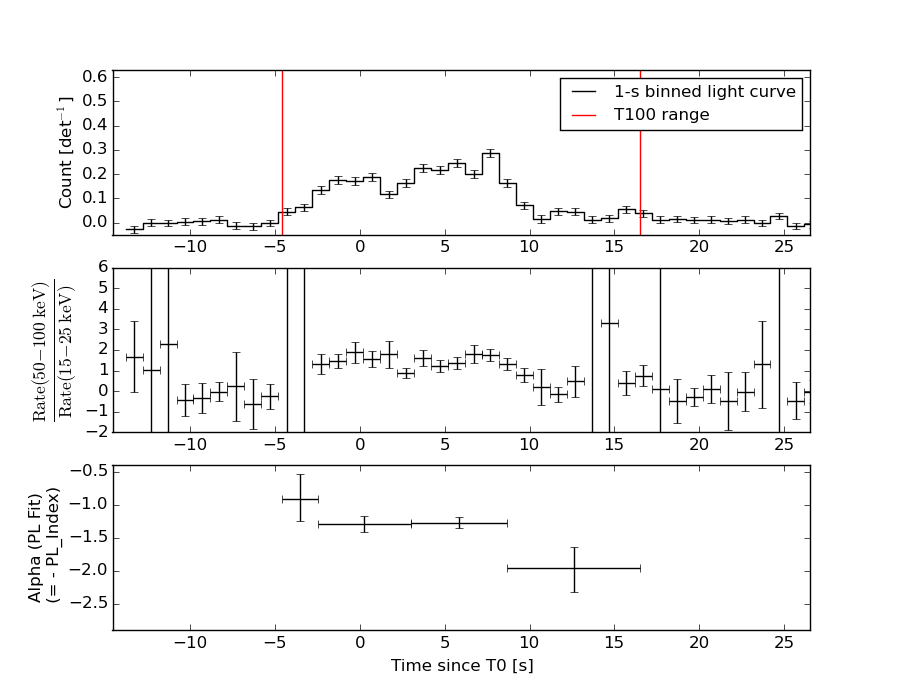
Duration
T90: 14.8079999685287 +/- 3.2362150653343
Measured from: -2.44800001382828
to: 12.3599999547005 [s; relative to TRIGTIME]
T50: 6.89199995994568 +/- 0.529104881367349
Measured from: 0.567999958992004
to: 7.45999991893768 [s; relative to TRIGTIME]
Fluence
Peak Flux (peak 1 second)
Measured from: 7.50800001621246
to: 8.50800001621246 [s; relative to TRIGTIME]
Total Fluence
Measured from: -4.57200002670288
to: 16.527999997139 [s; relative to TRIGTIME]
Band 1 Band 2 Band 3 Band 4
15-25 25-50 50-100 100-350 keV
Total 0.592167 1.027070 0.866299 0.199232
0.037174 0.039715 0.035552 0.028562 [error]
Peak 0.057736 0.108833 0.108565 0.023115
0.008818 0.009842 0.009176 0.007111 [error]
[ fluence units of on-axis counts / fully illuminated detector ]
======================================================================
====== Table of the duration information =============================
Value tstart tstop
T100 21.100 -4.572 16.528
T90 14.808 -2.448 12.360
T50 6.892 0.568 7.460
Peak 1.000 7.508 8.508
====== Spectral Analysis Summary =====================================
Model : spectral model: simple power-law (PL) and cutoff power-law (CPL)
Ph_index : photon index: E^{Ph_index}
Ph_90err : 90% error of the photon index
Epeak : Epeak in keV
Epeak_90err: 90% error of Epeak
Norm : normalization at 50 keV in both the PL model and CPL model
Nomr_90err : 90% error of the normalization
chi2 : Chi-Squared
dof : degree of freedo
=== Time-averaged spectral analysis ===
(Best model with acceptable fit: PL)
Model Ph_index Ph_90err_low Ph_90err_hi Epeak Epeak_90err_low Epeak_90err_hi Norm Nomr_90err_low Norm_90err_hi chi2 dof
PL -1.364 -0.076 0.076 - - - 8.97e-03 -3.89e-04 3.89e-04 62.410 57
CPL -0.989 -0.295 0.316 144.267 -42.815 290.416 1.35e-02 -3.65e-03 5.39e-03 57.600 56
=== 1-s peak spectral analysis ===
(Best model with acceptable fit: CPL)
Model Ph_index Ph_90err_low Ph_90err_hi Epeak Epeak_90err_low Epeak_90err_hi Norm Nomr_90err_low Norm_90err_hi chi2 dof
PL -1.146 -0.153 0.156 - - - 2.04e-02 -1.95e-03 1.95e-03 67.360 57
CPL -0.134 -0.678 0.804 99.698 -22.920 88.736 6.13e-02 -3.14e-02 7.89e-02 60.410 56
=== Fluence/Peak Flux Summary ===
Model Band1 Band2 Band3 Band4 Band5 Total
15-25 25-50 50-100 100-350 15-150 15-350 keV
Fluence PL 2.13e-07 4.25e-07 6.61e-07 2.26e-06 1.84e-06 3.56e-06 erg/cm2
90%_error_low -1.72e-08 -2.09e-08 -3.49e-08 -2.54e-07 -8.67e-08 -2.77e-07 erg/cm2
90%_error_hi 1.77e-08 2.08e-08 3.48e-08 2.75e-07 8.69e-08 2.95e-07 erg/cm2
Peak flux PL 5.99e-01 7.44e-01 6.73e-01 1.06e+00 2.38e+00 3.07e+00 ph/cm2/s
90%_error_low -1.05e-01 -8.47e-02 -7.14e-02 -2.13e-01 -2.34e-01 -3.07e-01 ph/cm2/s
90%_error_hi 1.11e-01 8.39e-02 7.09e-02 2.44e-01 2.35e-01 3.11e-01 ph/cm2/s
Fluence CPL 1.97e-07 4.39e-07 6.82e-07 1.36e-06 1.80e-06 2.68e-06 erg/cm2
90%_error_low -2.09e-08 -2.37e-08 -3.92e-08 -4.20e-07 -9.38e-08 -4.25e-07 erg/cm2
90%_error_hi 2.14e-08 2.40e-08 3.97e-08 6.56e-07 9.35e-08 6.50e-07 erg/cm2
Peak flux CPL 4.79e-01 8.02e-01 7.47e-01 4.33e-01 2.30e+00 2.46e+00 ph/cm2/s
90%_error_low -1.26e-01 -9.87e-02 -8.82e-02 -1.82e-01 -2.41e-01 -3.08e-01 ph/cm2/s
90%_error_hi 1.33e-01 1.01e-01 9.05e-02 3.30e-01 2.41e-01 3.83e-01 ph/cm2/s
======================================================================
Image
Pre-slew 15.0-350.0 keV image (Event data)
#   RAcent    DECcent   POSerr    Theta     Phi              Peak Cts       SNR   Name
  169.5983   -20.0508   0.0055    31.3215   154.6746         2.6738483     35.027 TRIG_00526351

Foreground time interval of the image:
 -4.572  14.901 (delta_t =  19.473 [sec])
Background time interval of the image:
-239.800  -4.572 (delta_t = 235.228 [sec])
Light Curves
Note: The mask-weighted lightcurves have units of either count/det or counts/sec/det, where a det is 0.4 x 0.4 = 0.16 sq cm.
Full-time range; 1 s binning
Other quick-look light curves:
- 64 ms binning (zoomed)
- 16 ms binning (zoomed)
- 8 ms binning (zoomed)
- 2 ms binning (zoomed)
- SN=5 or 10 s binning (full-time range)
- Raw light curve
Spectra
- 64 ms binning (zoomed)
- 16 ms binning (zoomed)
- 8 ms binning (zoomed)
- 2 ms binning (zoomed)
- SN=5 or 10 s binning (full-time range)
- Raw light curve
Spectra
Notes:
- 1) The fitting includes the systematic errors.
- 2) When the burst includes telescope slew time periods, the fitting uses an average response file made from multiple 5-s response files through out the slew time plus single time preiod for the non-slew times, and weighted by the total counts in the corresponding time period using addrmf. An average response file is needed becuase a spectral fit using the pre-slew DRM will introduce some errors in both a spectral shape and a normalization if the PHA file contains a lot of the slew/post-slew time interval.
- 3) For fits to more complicated models (e.g. a power-law over a cutoff power-law), the BAT team has decided to require a chi-square improvement of more than 6 for each extra dof.
Time averaged spectrum fit using the average DRM
Power-law model
Time interval is from   -4.572 sec. to   16.528 sec.

Spectral model in power-law:
------------------------------------------------------------
Parameters  : value       lower 90%   higher 90%
Photon index: -1.36422     ( -0.0762877   0.0764958 )
Norm@50keV  : 8.97358E-03    ( -0.000389481   0.000389453 )
------------------------------------------------------------
#Fit statistic : Chi-Squared =          62.41 using 59 PHA bins.
# Reduced chi-squared =          1.095 for     57 degrees of freedom
# Null hypothesis probability =   2.900982e-01

Photon flux (15-150 keV)    in 21.1 sec: 1.08429 ( -0.04954  0.04962 ) ph/cm2/s
Energy fluence (15-150 keV)             : 1.84367e-06 ( -8.66645e-08  8.69333e-08 ) ergs/cm2
Cutoff power-law model
Time interval is from   -4.572 sec. to   16.528 sec.
Spectral model in the cutoff power-law:
------------------------------------------------------------
Parameters  : value       lower 90%   higher 90%
Photon index: -0.988894     ( -0.295386   0.315956 )
Epeak [keV] : 144.267      ( -42.8157 290.416 )
Norm@50keV  : 1.35311E-02    ( -0.00364922   0.00538972 )
------------------------------------------------------------
#Fit statistic : Chi-Squared =          57.60 using 59 PHA bins.
# Reduced chi-squared =          1.029 for     56 degrees of freedom
# Null hypothesis probability =   4.156178e-01

Photon flux (15-150 keV)    in 21.1 sec: 1.06401 ( -0.05189  0.05195 ) ph/cm2/s
Energy fluence (15-150 keV)             : 1.80112e-06 ( -9.38482e-08  9.35023e-08 ) ergs/cm2
1-s peak spectrum fit
Power-law model
Time interval is from    7.508 sec. to    8.508 sec.

Spectral model in power-law:
------------------------------------------------------------
Parameters  : value       lower 90%   higher 90%
Photon index: -1.14586     ( -0.153172   0.156256 )
Norm@50keV  : 2.04087E-02    ( -0.00195164   0.00195081 )
------------------------------------------------------------
#Fit statistic : Chi-Squared =          67.36 using 59 PHA bins.
# Reduced chi-squared =          1.182 for     57 degrees of freedom
# Null hypothesis probability =   1.639036e-01

Photon flux (15-150 keV)    in 1 sec: 2.37891 ( -0.23416  0.23465 ) ph/cm2/s
Energy fluence (15-150 keV)             : 2.10383e-07 ( -2.16751e-08  2.17784e-08 ) ergs/cm2
Cutoff power-law model

Time interval is from    7.508 sec. to    8.508 sec.
Spectral model in the cutoff power-law:
------------------------------------------------------------
Parameters  : value       lower 90%   higher 90%
Photon index: -0.133648     ( -0.678354   0.804405 )
Epeak [keV] : 99.6984      ( -22.9194 88.7358 )
Norm@50keV  : 6.13118E-02    ( -0.031364   0.0788956 )
------------------------------------------------------------
#Fit statistic : Chi-Squared =          60.41 using 59 PHA bins.
# Reduced chi-squared =          1.079 for     56 degrees of freedom
# Null hypothesis probability =   3.196285e-01

Photon flux (15-150 keV)    in 1 sec: 2.29954 ( -0.24109  0.24115 ) ph/cm2/s
Energy fluence (15-150 keV)             : 1.9932e-07 ( -2.33778e-08  2.33901e-08 ) ergs/cm2
Time-resolved spectra
Distribution
T90 vs. Hardness ratio plot
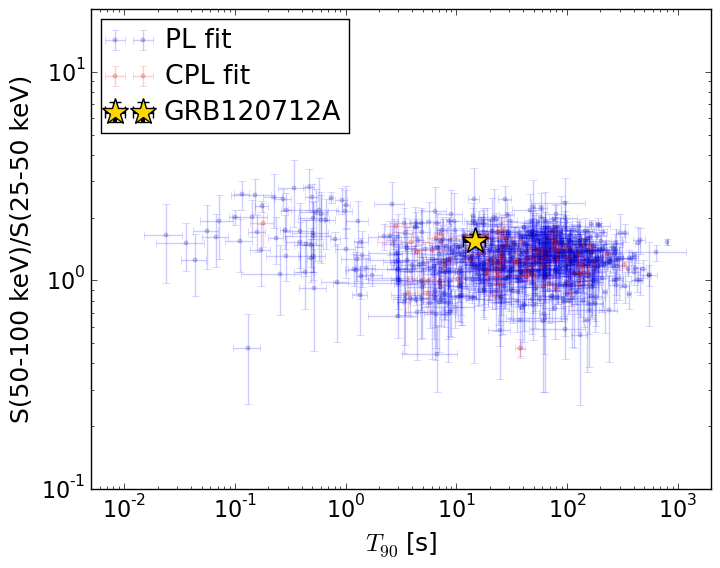
T90                                   = 14.808 sec.
Hardness ratio (energy fluence ratio) = 1.55378216922
S(15-50 keV) vs. S(50-150 keV) plot
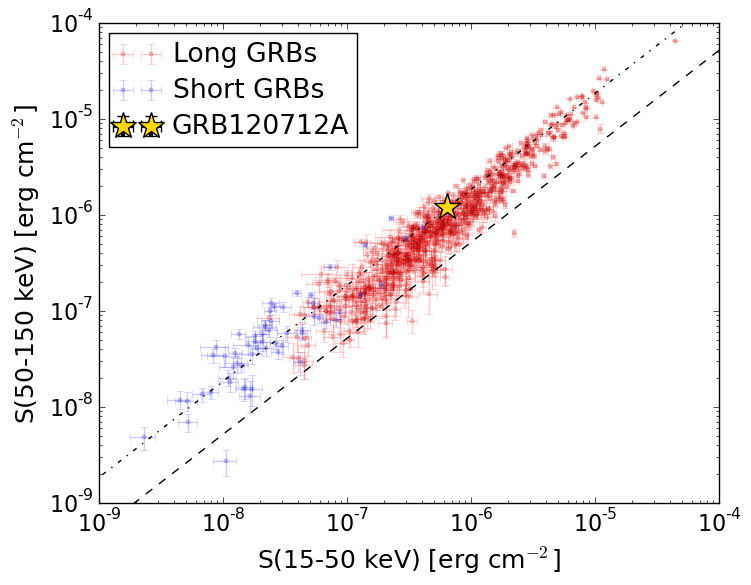
S(15-50 keV)  = 6.380585e-07
S(50-150 keV) = 1.2056234e-06
The dash-dotted line and the dashed line traces the fluences calculated from the Band function with Epeak = 15 and 150 keV, respectively. Both lines assume a canonical values of alpha = -1 and beta = -2.5.
Mask shadow pattern
IMX = -5.500395652468303E-01, IMY = -2.603010638826990E-01
Spacecraft aspect plot
Bright source in the pre-burst/pre-slew/post-slew images
Pre-burst image of 15-350 keV band
Time interval of the image:
-239.800000 -4.572000

# RAcent  DECcent POSerr Theta    Phi  PeakCts   SNR AngSep     Name
#  [deg]    [deg]    ['] [deg]  [deg]                   [']
135.5230 -40.5710   23.6  55.3 -165.4   0.3209   0.5    1.0	Vela X-1
179.2594 -35.6535    2.6  49.0  151.3   3.0364   4.4 ------	UNKNOWN
166.1244 -42.4753    2.4  52.6  166.4   3.6187   4.8 ------	UNKNOWN
125.9360 -38.5098    3.5  57.9 -156.8   3.9294   3.3 ------	UNKNOWN
127.2195  54.8976    3.0  52.0  -31.4   2.2410   3.9 ------	UNKNOWN
Pre-slew background subtracted image of 15-350 keV band
Time interval of the image:
-4.572000 14.900590

# RAcent  DECcent POSerr Theta    Phi  PeakCts   SNR AngSep     Name
#  [deg]    [deg]    ['] [deg]  [deg]                   [']
135.5215 -40.4889   15.5  55.2 -165.4  -0.1471  -0.7    4.0	Vela X-1
169.5984 -20.0508    0.3  31.3  154.7   2.6734  34.9 ------	UNKNOWN
118.6325  -2.0577    2.0  43.0 -111.9   1.1261   5.7 ------	UNKNOWN
Post-slew image of 15-350 keV band
Time interval of the image:
74.100600 962.313100

# RAcent  DECcent POSerr Theta    Phi  PeakCts   SNR AngSep     Name
#  [deg]    [deg]    ['] [deg]  [deg]                   [']
135.6112 -40.4126  153.9  35.4 -166.2   0.0243   0.1    9.3	Vela X-1
170.2906 -60.5816    5.2  40.5  146.0   1.4839   2.2    2.6	Cen X-3
186.6506 -62.7696   69.8  44.3  135.4  -0.1845  -0.2    0.2	GX 301-2
128.9995 -43.1839    1.5  41.0 -167.2   3.1447   7.8 ------	UNKNOWN
105.2056 -38.2555    3.8  57.9 -156.8   5.5015   3.0 ------	UNKNOWN