Analysis Summary
Notes:
- 1) No attempt has been made to eliminate the non-significant decimal places.
- 2) This batgrbproduct analysis is done using the HEASARC data.
- 3) This batgrbproduct analysis is using the flight position for the mask-weighting calculation.
======================================================================
                  BAT GRB EVENT DATA PROCESSING REPORT
    Process Script Ver: batgrbproduct v2.46
    Process Start Time: Mon Jan 13 03:16:28 EST 2014
             Host Name: batevent1
   Current Working Dir: /local/data/batevent/batevent_reproc/trigger526642
======================================================================

  Trigger: 00526642      Segment: 000

  BAT Trigger Time: 363993536   [s; MET]
      Trigger Stop: 363993600   [s; MET]
               UTC: 2012-07-14T21:18:46.573920    [includes UTCF correction]
       Where From?: TDRSS position message

  BAT
    RA: 355.432702280664   Dec: -46.1858043791775  [deg; J2000]

     Catalogged Source?: NO
     Point Source?:      YES
     GRB Indicated?:     YES    [ by BAT flight software ]
     Image S/N Ratio:    11.3
     Image Trigger?:     YES
     Rate S/N Ratio:     0  [ if not an image trigger ]
     Image S/N Ratio:    11.3

  Analysis Position:   [ source = BAT ]
    RA: 355.432702280664   Dec: -46.1858043791775  [deg; J2000]

  Refined Position:   [ source = BAT pre-slew burst ]
    RA: 355.423600350055   Dec: -46.1957729965436  [deg; J2000]
        { 23h 41m 41.7s , -46d 11' 44.8" }
         +/- 1.73190423869308 [arcmin] (estimated 90% radius based on SNR)
         +/- 0.632058150241676 [arcmin] (formal 1-sigma fit error)
    SNR: 13.8793774623185

  Angular difference between the analysis and refined position is 0.707579 arcmin

  Partial Coding Fraction: 0.9296875    [ including projection effects ]

  Duration
     T90: 157.311999976635 +/- 23.9863005360993
        Measured from: -14.8080000281334
                   to: 142.503999948502     [s; relative to TRIGTIME]
     T50: 69.5239999890327 +/- 36.6918177621148
        Measured from: -2.38800001144409
                   to: 67.1359999775887     [s; relative to TRIGTIME]


  Fluence
     Peak Flux  (peak 1 second)
        Measured from: -21.7080000042915
                   to: -20.7080000042915     [s; relative to TRIGTIME]
     Total Fluence
        Measured from: -24.160000026226
                   to: 151.248000025749     [s; relative to TRIGTIME]

             Band 1     Band 2     Band 3     Band 4
              15-25      25-50     50-100    100-350     keV
 Total     0.556728   0.890469   0.583334   0.032027
           0.069249   0.071346   0.062345   0.053216 [error]
 Peak      0.019426   0.014266   0.011642   0.001858
           0.005322   0.005469   0.004745   0.004165 [error]

     [ fluence units of on-axis counts / fully illuminated detector ]

======================================================================


====== Table of the duration information =============================

        Value   tstart    tstop
T100  175.408  -24.160  151.248
T90   157.312  -14.808  142.504
T50    69.524   -2.388   67.136
Peak    1.000  -21.708  -20.708


====== Spectral Analysis Summary =====================================

Model      : spectral model: simple power-law (PL) and cutoff power-law (CPL)
Ph_index   : photon index: E^{Ph_index}
Ph_90err   : 90% error of the photon index
Epeak      : Epeak in keV
Epeak_90err: 90% error of Epeak
Norm       : normalization at 50 keV in both the PL model and CPL model
Nomr_90err : 90% error of the normalization
chi2       : Chi-Squared
dof        : degree of freedo

=== Time-averaged spectral analysis ===
(Best model with acceptable fit: PL)

Model Ph_index Ph_90err_low Ph_90err_hi  Epeak  Epeak_90err_low  Epeak_90err_hi  Norm       Nomr_90err_low    Norm_90err_hi    chi2    dof
PL      -1.529    -0.164      0.162       -           -               -         7.54e-04     -7.75e-05          7.69e-05      51.990   57
CPL     -0.688    -0.684      0.824       71.236     -17.102       101.741      2.16e-03     -1.22e-03          3.86e-03      47.400   56


=== 1-s peak spectral analysis ===
(Best model with acceptable fit: N/A)

Model Ph_index Ph_90err_low Ph_90err_hi  Epeak  Epeak_90err_low  Epeak_90err_hi  Norm       Nomr_90err_low    Norm_90err_hi    chi2    dof
PL      -1.941     -0.803     0.657       -           -               -         2.42e-03     -1.19e-03          1.10e-03      54.930   57
CPL     -1.937      N/A       N/A         250.193      N/A           N/A         2.42e-03        N/A               N/A         54.940   56


=== Fluence/Peak Flux Summary ===

              Model    Band1     Band2     Band3     Band4     Band5     Total
                       15-25     25-50    50-100    100-350    15-150    15-350    keV
Fluence         PL   1.74e-07  3.13e-07  4.34e-07  1.25e-06  1.25e-06  2.17e-06   erg/cm2
      90%_error_low -2.60e-08 -3.08e-08 -5.83e-08 -3.15e-07 -1.40e-07 -3.73e-07   erg/cm2
      90%_error_hi   2.68e-08  3.07e-08  5.84e-08  3.80e-07  1.42e-07  4.26e-07   erg/cm2
Peak flux       PL   1.52e-01  1.18e-01  6.16e-02  4.63e-02  3.53e-01  3.78e-01   ph/cm2/s
      90%_error_low -6.94e-02 -4.19e-02 -3.64e-02 -4.63e-02 -1.21e-01 -1.34e-01   ph/cm2/s
      90%_error_hi   7.29e-02  4.08e-02  3.99e-02  8.07e-02  1.21e-01  1.38e-01   ph/cm2/s

Fluence        CPL   1.57e-07  3.46e-07  4.39e-07  3.62e-07  1.15e-06  1.30e-06   erg/cm2
      90%_error_low -2.98e-08 -4.07e-08 -6.78e-08 -2.19e-07 -1.58e-07 -2.70e-07   erg/cm2
      90%_error_hi   3.01e-08  4.25e-08  6.59e-08  5.91e-07  1.62e-07  5.95e-07   erg/cm2
Peak flux      CPL   1.53e-01  1.15e-01  5.97e-02  5.18e-02  3.48e-01  3.82e-01   ph/cm2/s
      90%_error_low     N/A   -6.26e-02 -3.43e-02 -5.18e-02 -1.89e-01 -1.36e-01   ph/cm2/s
      90%_error_hi      N/A    5.47e-02  2.05e-02  1.69e-02  1.25e-01  1.29e-01   ph/cm2/s

======================================================================
Image
Pre-slew 15.0-350.0 keV image (Event data)
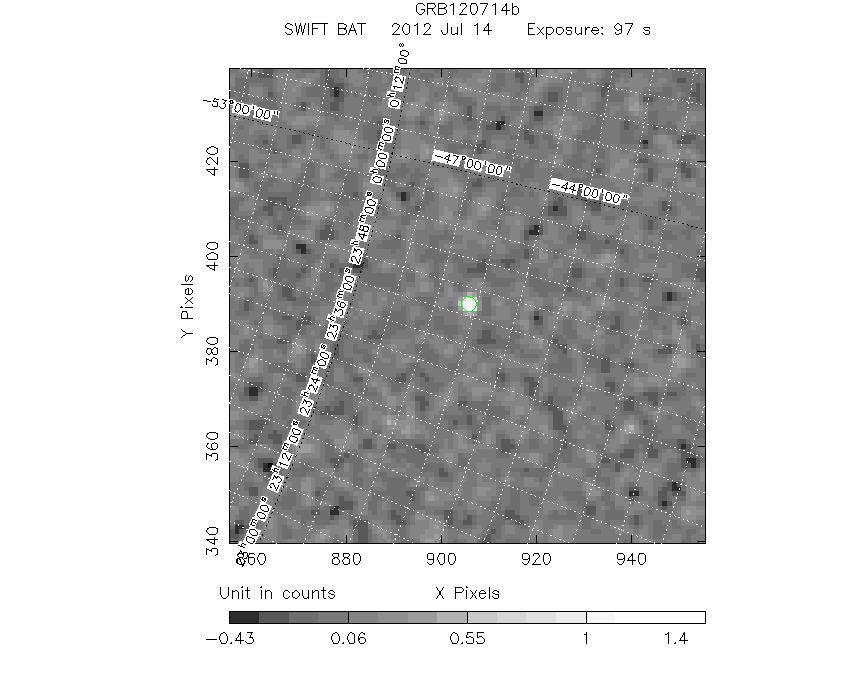
#   RAcent    DECcent   POSerr    Theta     Phi              Peak Cts       SNR   Name
  355.4236   -46.1958   0.0139    10.7754   106.7815         1.5977091     13.879 TRIG_00526642

Foreground time interval of the image:
-24.160  72.501 (delta_t =  96.661 [sec])
Background time interval of the image:
-394.799 -379.858 (delta_t =  14.941 [sec])
-239.000 -24.160 (delta_t = 214.840 [sec])
Light Curves
Note: The mask-weighted lightcurves have units of either count/det or counts/sec/det, where a det is 0.4 x 0.4 = 0.16 sq cm.
Full-time range; 1 s binning
Other quick-look light curves:
- 64 ms binning (zoomed)
- 16 ms binning (zoomed)
- 8 ms binning (zoomed)
- 2 ms binning (zoomed)
- SN=5 or 10 s binning (full-time range)
- Raw light curve
Spectra
- 64 ms binning (zoomed)
- 16 ms binning (zoomed)
- 8 ms binning (zoomed)
- 2 ms binning (zoomed)
- SN=5 or 10 s binning (full-time range)
- Raw light curve
Spectra
Notes:
- 1) The fitting includes the systematic errors.
- 2) When the burst includes telescope slew time periods, the fitting uses an average response file made from multiple 5-s response files through out the slew time plus single time preiod for the non-slew times, and weighted by the total counts in the corresponding time period using addrmf. An average response file is needed becuase a spectral fit using the pre-slew DRM will introduce some errors in both a spectral shape and a normalization if the PHA file contains a lot of the slew/post-slew time interval.
- 3) For fits to more complicated models (e.g. a power-law over a cutoff power-law), the BAT team has decided to require a chi-square improvement of more than 6 for each extra dof.
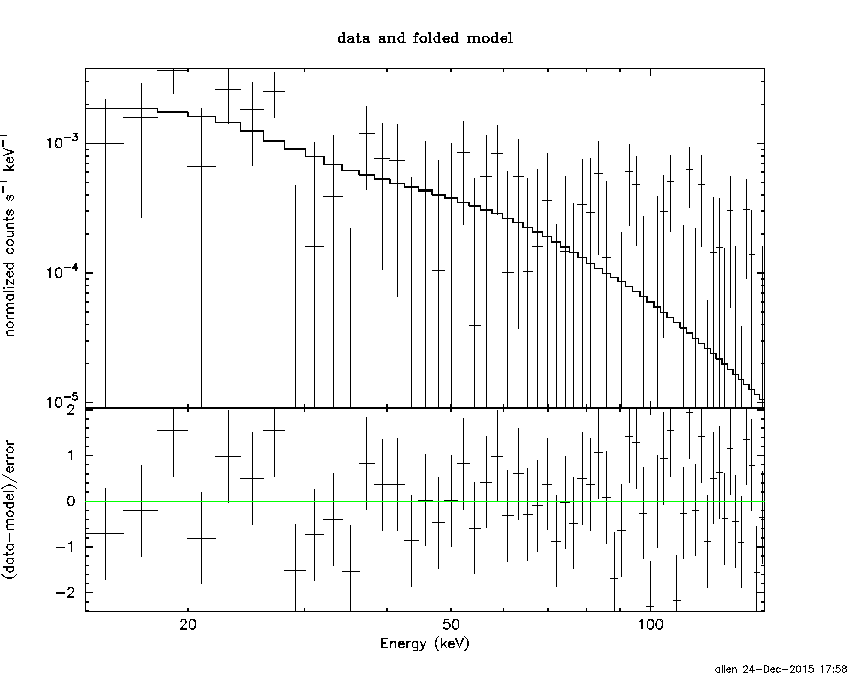
Time averaged spectrum fit using the average DRM
Power-law model
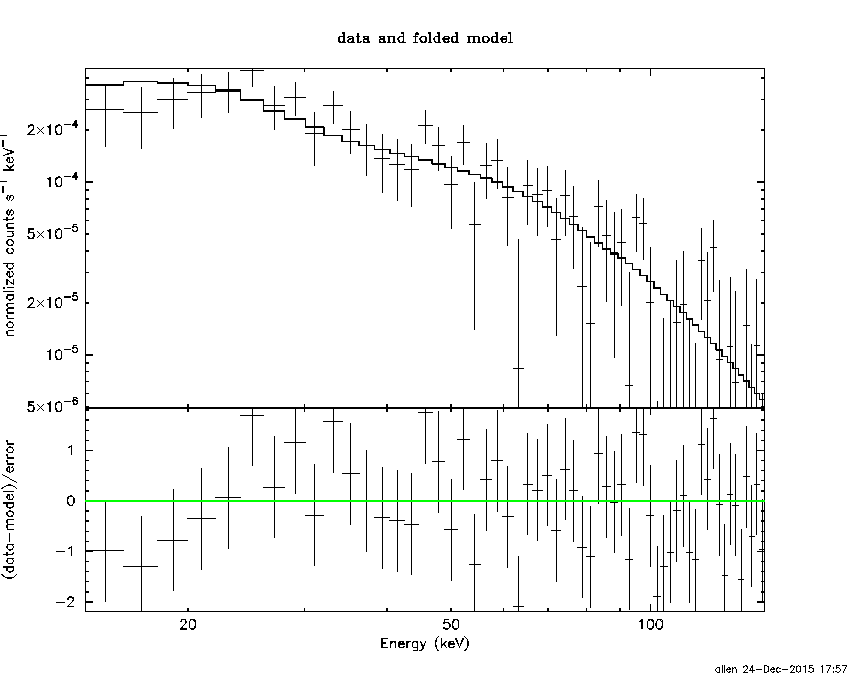
Time interval is from  -24.160 sec. to  151.248 sec.

Spectral model in power-law:
------------------------------------------------------------
Parameters  : value       lower 90%   higher 90%
Photon index: -1.52949     ( -0.164338   0.162173 )
Norm@50keV  : 7.54213E-04    ( -7.75211e-05   7.68799e-05 )
------------------------------------------------------------
#Fit statistic : Chi-Squared =          51.99 using 59 PHA bins.
# Reduced chi-squared =         0.9120 for     57 degrees of freedom
# Null hypothesis probability =   6.631963e-01

Photon flux (15-150 keV)    in 175.4 sec: 9.49245E-02 ( -0.0091998  0.0092035 ) ph/cm2/s
Energy fluence (15-150 keV)             : 1.24931e-06 ( -1.40108e-07  1.42053e-07 ) ergs/cm2
Cutoff power-law model
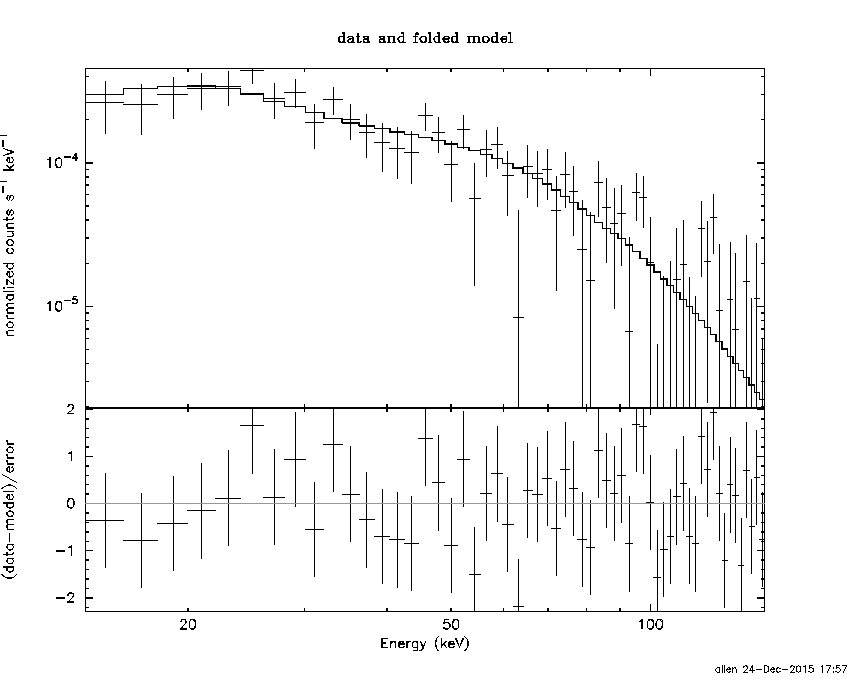
Time interval is from  -24.160 sec. to  151.248 sec.
Spectral model in the cutoff power-law:
------------------------------------------------------------
Parameters  : value       lower 90%   higher 90%
Photon index: -0.687642     ( -0.683499   0.823933 )
Epeak [keV] : 71.2362      ( -17.1038 101.738 )
Norm@50keV  : 2.15951E-03    ( -0.00122209   0.0038585 )
------------------------------------------------------------
#Fit statistic : Chi-Squared =          47.40 using 59 PHA bins.
# Reduced chi-squared =         0.8465 for     56 degrees of freedom
# Null hypothesis probability =   7.864817e-01

Photon flux (15-150 keV)    in 175.4 sec: 9.18931E-02 ( -0.0095226  0.0095219 ) ph/cm2/s
Energy fluence (15-150 keV)             : 1.14916e-06 ( -1.57665e-07  1.62376e-07 ) ergs/cm2
1-s peak spectrum fit
Power-law model
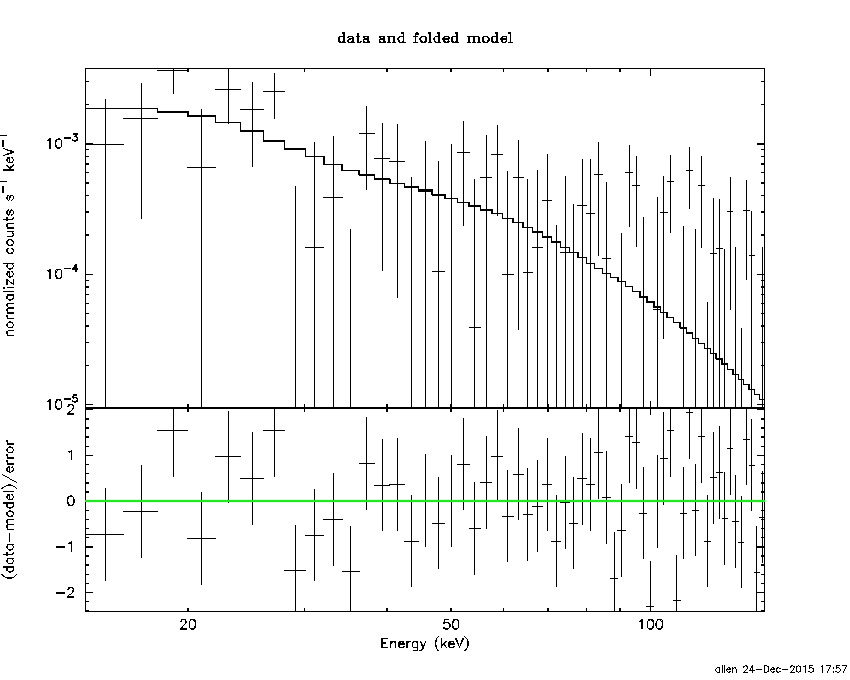
Time interval is from  -21.708 sec. to  -20.708 sec.

Spectral model in power-law:
------------------------------------------------------------
Parameters  : value       lower 90%   higher 90%
Photon index: -1.94096     ( -0.803314   0.65744 )
Norm@50keV  : 2.41851E-03    ( -0.00119053   0.00109948 )
------------------------------------------------------------
#Fit statistic : Chi-Squared =          54.93 using 59 PHA bins.
# Reduced chi-squared =         0.9637 for     57 degrees of freedom
# Null hypothesis probability =   5.531860e-01

Photon flux (15-150 keV)    in 1 sec: 0.353299 ( -0.120505  0.120583 ) ph/cm2/s
Energy fluence (15-150 keV)             : 2.22546e-08 ( -9.63371e-09  1.06935e-08 ) ergs/cm2
Cutoff power-law model
Time interval is from  -21.708 sec. to  -20.708 sec.
Spectral model in the cutoff power-law:
------------------------------------------------------------
Parameters  : value       lower 90%   higher 90%
Photon index: -1.93736     (       )
Epeak [keV] : 250.193      (   )
Norm@50keV  : 2.41945E-03    (     )
------------------------------------------------------------
#Fit statistic : Chi-Squared =          54.94 using 59 PHA bins.
# Reduced chi-squared =         0.9810 for     56 degrees of freedom
# Null hypothesis probability =   5.151911e-01

Photon flux (15-150 keV)    in 1 sec: 0.347945 ( -0.188945  0.124734 ) ph/cm2/s
Energy fluence (15-150 keV)             : 2.02484e-08 ( 0  0 ) ergs/cm2
Time-resolved spectra
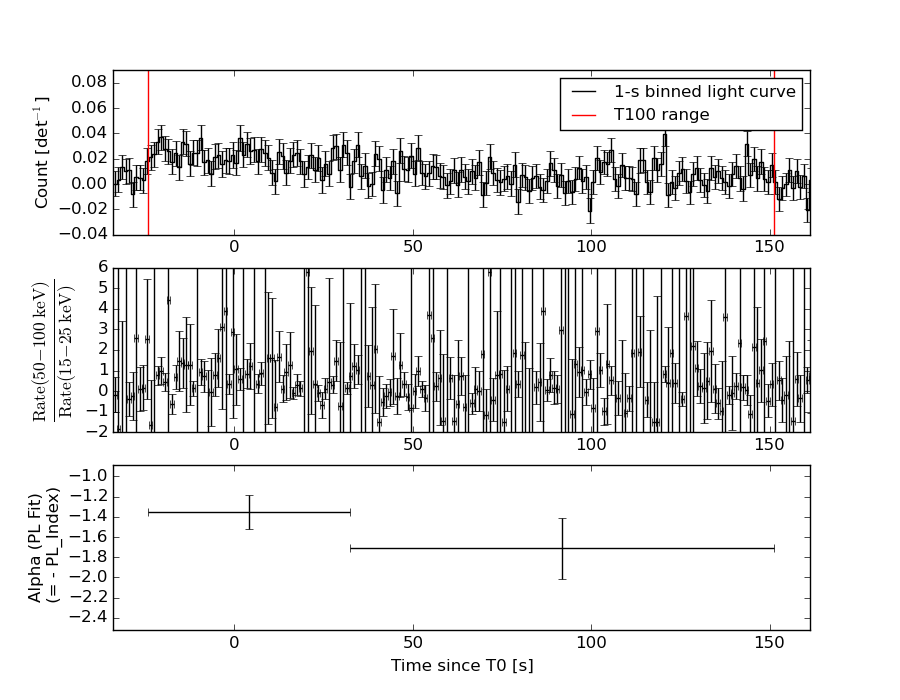
Distribution
T90 vs. Hardness ratio plot
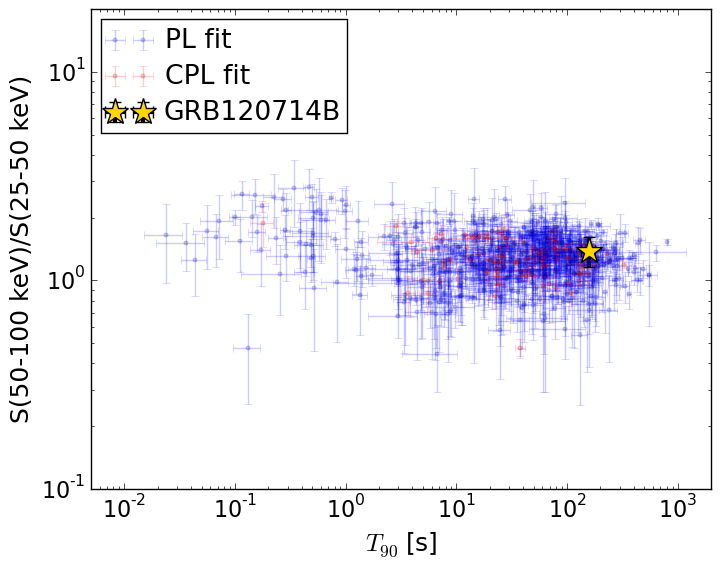
T90                                   = 157.312 sec.
Hardness ratio (energy fluence ratio) = 1.38560635236
S(15-50 keV) vs. S(50-150 keV) plot
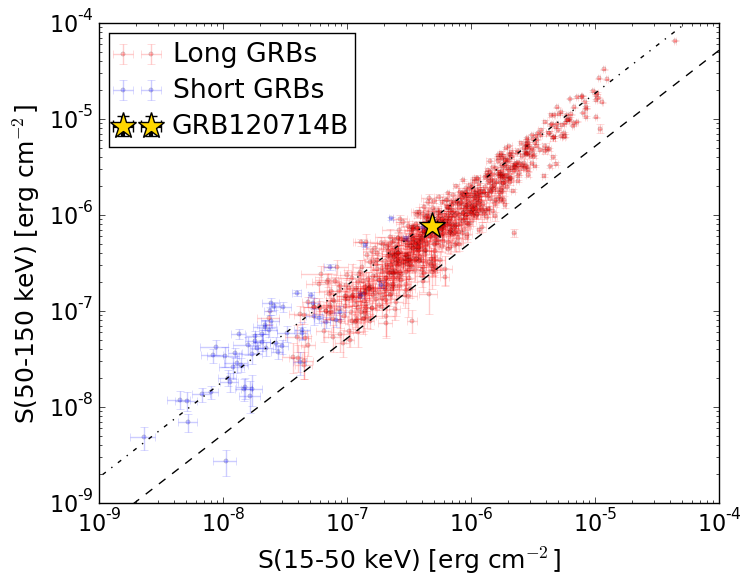
S(15-50 keV)  = 4.870676e-07
S(50-150 keV) = 7.622414e-07
The dash-dotted line and the dashed line traces the fluences calculated from the Band function with Epeak = 15 and 150 keV, respectively. Both lines assume a canonical values of alpha = -1 and beta = -2.5.
Mask shadow pattern
IMX = -5.494803448911557E-02, IMY = -1.822095744744837E-01
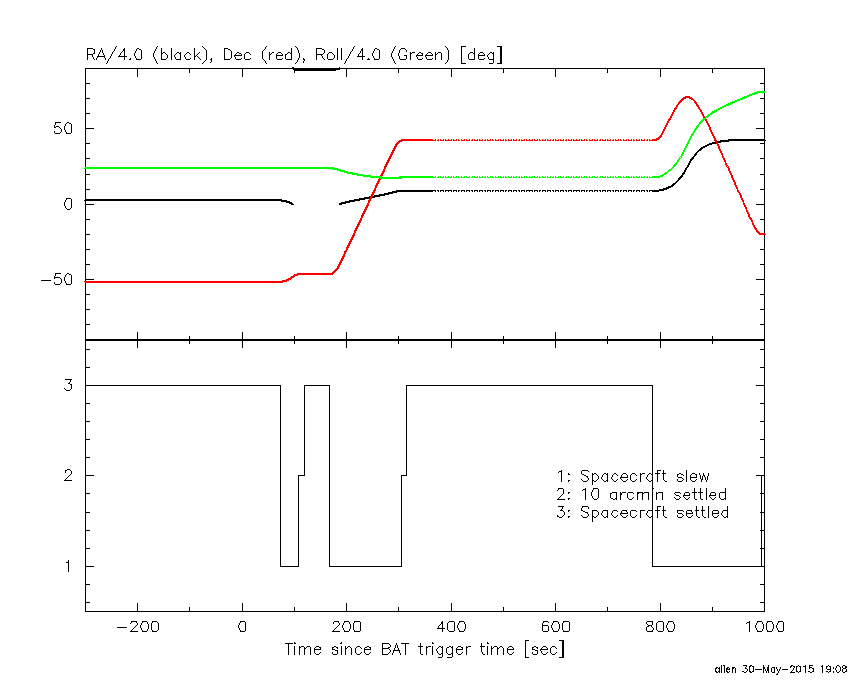
Spacecraft aspect plot
Bright source in the pre-burst/pre-slew/post-slew images
Pre-burst image of 15-350 keV band
Time interval of the image:
-394.799390 -379.858100
-239.000000 -24.160000

# RAcent  DECcent POSerr Theta    Phi  PeakCts   SNR AngSep     Name
#  [deg]    [deg]    ['] [deg]  [deg]                   [']
316.3440 -38.7086    2.4  38.9   81.6   3.6680   4.8 ------	UNKNOWN
  7.9791  -3.5970    2.1  47.7  171.7   2.1680   5.5  524.9	UNKNOWN
Pre-slew background subtracted image of 15-350 keV band
Time interval of the image:
-24.160000 72.500600

# RAcent  DECcent POSerr Theta    Phi  PeakCts   SNR AngSep     Name
#  [deg]    [deg]    ['] [deg]  [deg]                   [']
290.9333 -53.8374    2.6  45.5   48.5   2.3690   4.4 ------	UNKNOWN
355.4236 -46.1958    0.8  10.8  106.8   1.5977  13.9 ------	UNKNOWN
 64.0563 -45.0636    2.2  35.8  -83.9   1.2758   5.2 ------	UNKNOWN
Post-slew image of 15-350 keV band
Time interval of the image:
108.700600 166.300600

# RAcent  DECcent POSerr Theta    Phi  PeakCts   SNR AngSep     Name
#  [deg]    [deg]    ['] [deg]  [deg]                   [']
275.5987 -69.3635    3.1  44.1   24.9   0.5831   3.7 ------	UNKNOWN
326.0847 -61.1066    2.2  22.6   33.1   0.4418   5.3 ------	UNKNOWN
111.3841 -72.1484    2.6  53.6  -25.0   1.0720   4.4 ------	UNKNOWN
 66.6312 -52.2193    2.6  45.0  -60.1   1.5893   4.5 ------	UNKNOWN