Analysis Summary
Notes:
- 1) No attempt has been made to eliminate the non-significant decimal places.
- 2) This batgrbproduct analysis is done using the HEASARC data.
- 3) This batgrbproduct analysis is using the flight position for the mask-weighting calculation.
======================================================================
                  BAT GRB EVENT DATA PROCESSING REPORT
    Process Script Ver: batgrbproduct v2.46
    Process Start Time: Mon Jan 13 02:56:31 EST 2014
             Host Name: batevent1
   Current Working Dir: /local/data/batevent/batevent_reproc/trigger529021
======================================================================

  Trigger: 00529021      Segment: 000

  BAT Trigger Time: 365207120.512   [s; MET]
      Trigger Stop: 365207132.672   [s; MET]
               UTC: 2012-07-28T22:25:11.035380    [includes UTCF correction]
       Where From?: TDRSS position message

  BAT
    RA: 137.100024602055   Dec: -54.4372942698869  [deg; J2000]

     Catalogged Source?: NO
     Point Source?:      YES
     GRB Indicated?:     YES    [ by BAT flight software ]
     Image S/N Ratio:    11.23
     Image Trigger?:     NO
     Rate S/N Ratio:     19.1049731745428  [ if not an image trigger ]
     Image S/N Ratio:    11.23

  Analysis Position:   [ source = BAT ]
    RA: 137.100024602055   Dec: -54.4372942698869  [deg; J2000]

  Refined Position:   [ source = BAT pre-slew burst ]
    RA: 137.087485477206   Dec: -54.4364229474265  [deg; J2000]
        { 09h 08m 21.0s , -54d 26' 11.1" }
         +/- 1.38297425160344 [arcmin] (estimated 90% radius based on SNR)
         +/- 0.53893401560829 [arcmin] (formal 1-sigma fit error)
    SNR: 19.1405929688511

  Angular difference between the analysis and refined position is 0.440677 arcmin

  Partial Coding Fraction: 0.1347656    [ including projection effects ]

  Duration
     T90: 20.9760000705719 +/- 2.05921922729959
        Measured from: 1.2399999499321
                   to: 22.216000020504     [s; relative to TRIGTIME]
     T50: 10.2879999876022 +/- 1.71207478912046
        Measured from: 5.17599999904633
                   to: 15.4639999866486     [s; relative to TRIGTIME]


  Fluence
     Peak Flux  (peak 1 second)
        Measured from: 12.2679999470711
                   to: 13.2679999470711     [s; relative to TRIGTIME]
     Total Fluence
        Measured from: -0.0400000214576721
                   to: 24.1359999775887     [s; relative to TRIGTIME]

             Band 1     Band 2     Band 3     Band 4
              15-25      25-50     50-100    100-350     keV
 Total     1.105580   1.330509   1.016601   0.216635
           0.083669   0.087690   0.077527   0.070678 [error]
 Peak      0.076398   0.108974   0.051051   0.041778
           0.017208   0.019136   0.015687   0.014574 [error]

     [ fluence units of on-axis counts / fully illuminated detector ]

======================================================================


====== Table of the duration information =============================

        Value   tstart    tstop
T100   24.176   -0.040   24.136
T90    20.976    1.240   22.216
T50    10.288    5.176   15.464
Peak    1.000   12.268   13.268


====== Spectral Analysis Summary =====================================

Model      : spectral model: simple power-law (PL) and cutoff power-law (CPL)
Ph_index   : photon index: E^{Ph_index}
Ph_90err   : 90% error of the photon index
Epeak      : Epeak in keV
Epeak_90err: 90% error of Epeak
Norm       : normalization at 50 keV in both the PL model and CPL model
Nomr_90err : 90% error of the normalization
chi2       : Chi-Squared
dof        : degree of freedo

=== Time-averaged spectral analysis ===
(Best model with acceptable fit: PL)

Model Ph_index Ph_90err_low Ph_90err_hi  Epeak  Epeak_90err_low  Epeak_90err_hi  Norm       Nomr_90err_low    Norm_90err_hi    chi2    dof
PL      -1.768    -0.128      0.126       -           -               -         1.07e-02     -8.04e-04          7.99e-04      56.260   57
CPL     -1.389    -0.434      0.528       80.884     -23.275       -80.884      1.67e-02     -6.37e-03          1.36e-02      54.410   56


=== 1-s peak spectral analysis ===
(Best model with acceptable fit: PL)

Model Ph_index Ph_90err_low Ph_90err_hi  Epeak  Epeak_90err_low  Epeak_90err_hi  Norm       Nomr_90err_low    Norm_90err_hi    chi2    dof
PL      -2.099     -0.447     0.390       -           -               -         1.56e-02     -4.25e-03          3.98e-03      60.940   57
CPL     -1.991      N/A       N/A           5.127      N/A           N/A         1.72e-02        N/A               N/A         61.030   56


=== Fluence/Peak Flux Summary ===

              Model    Band1     Band2     Band3     Band4     Band5     Total
                       15-25     25-50    50-100    100-350    15-150    15-350    keV
Fluence         PL   4.26e-07  6.66e-07  7.82e-07  1.78e-06  2.39e-06  3.65e-06   erg/cm2
      90%_error_low -4.99e-08 -4.90e-08 -7.71e-08 -3.42e-07 -1.83e-07 -4.13e-07   erg/cm2
      90%_error_hi   5.17e-08  4.89e-08  7.67e-08  3.92e-07  1.84e-07  4.48e-07   erg/cm2
Peak flux       PL   1.15e+00  8.12e-01  3.79e-01  2.48e-01  2.46e+00  2.58e+00   ph/cm2/s
      90%_error_low -3.54e-01 -1.72e-01 -1.32e-01 -1.35e-01 -5.33e-01 -5.48e-01   ph/cm2/s
      90%_error_hi   3.80e-01  1.72e-01  1.31e-01  1.99e-01  5.34e-01  5.48e-01   ph/cm2/s

Fluence        CPL   3.99e-07  6.91e-07  8.02e-07  1.05e-06  2.34e-06  2.94e-06   erg/cm2
      90%_error_low -6.02e-08 -5.83e-08 -8.30e-08 -4.83e-07 -1.97e-07 -5.23e-07   erg/cm2
      90%_error_hi   6.12e-08  5.95e-08  8.48e-08  8.49e-07  1.97e-07  8.93e-07   erg/cm2
Peak flux      CPL   1.12e+00  7.63e-01    N/A    2.45e-01  2.44e+00  2.55e+00   ph/cm2/s
      90%_error_low -3.39e-01 -4.24e-01 -1.32e-01 -2.45e-01 -5.13e-01     N/A     ph/cm2/s
      90%_error_hi   3.34e-01  2.43e-01  1.31e-01  1.84e-01  5.24e-01     N/A     ph/cm2/s

======================================================================
Image
Pre-slew 15.0-350.0 keV image (Event data)
#   RAcent    DECcent   POSerr    Theta     Phi              Peak Cts       SNR   Name
  137.0875   -54.4364   0.0100    51.8277   172.1188         3.7220116     19.141 TRIG_00529021

Foreground time interval of the image:
 -0.040  24.136 (delta_t =  24.176 [sec])
Background time interval of the image:
-282.811 -267.604 (delta_t =  15.207 [sec])
-239.512  -0.040 (delta_t = 239.472 [sec])
Light Curves
Note: The mask-weighted lightcurves have units of either count/det or counts/sec/det, where a det is 0.4 x 0.4 = 0.16 sq cm.
Full-time range; 1 s binning
Other quick-look light curves:
- 64 ms binning (zoomed)
- 16 ms binning (zoomed)
- 8 ms binning (zoomed)
- 2 ms binning (zoomed)
- SN=5 or 10 s binning (full-time range)
- Raw light curve
Spectra
- 64 ms binning (zoomed)
- 16 ms binning (zoomed)
- 8 ms binning (zoomed)
- 2 ms binning (zoomed)
- SN=5 or 10 s binning (full-time range)
- Raw light curve
Spectra
Notes:
- 1) The fitting includes the systematic errors.
- 2) When the burst includes telescope slew time periods, the fitting uses an average response file made from multiple 5-s response files through out the slew time plus single time preiod for the non-slew times, and weighted by the total counts in the corresponding time period using addrmf. An average response file is needed becuase a spectral fit using the pre-slew DRM will introduce some errors in both a spectral shape and a normalization if the PHA file contains a lot of the slew/post-slew time interval.
- 3) For fits to more complicated models (e.g. a power-law over a cutoff power-law), the BAT team has decided to require a chi-square improvement of more than 6 for each extra dof.
Time averaged spectrum fit using the average DRM
Power-law model

Time interval is from   -0.040 sec. to   24.136 sec.

Spectral model in power-law:
------------------------------------------------------------
Parameters  : value       lower 90%   higher 90%
Photon index: -1.76763     ( -0.127801   0.125577 )
Norm@50keV  : 1.07370E-02    ( -0.000803917   0.000798789 )
------------------------------------------------------------
#Fit statistic : Chi-Squared =          56.26 using 59 PHA bins.
# Reduced chi-squared =         0.9870 for     57 degrees of freedom
# Null hypothesis probability =   5.029133e-01

Photon flux (15-150 keV)    in 24.18 sec: 1.46146 ( -0.10936  0.10967 ) ph/cm2/s
Energy fluence (15-150 keV)             : 2.39374e-06 ( -1.83155e-07  1.84166e-07 ) ergs/cm2
Cutoff power-law model
Time interval is from   -0.040 sec. to   24.136 sec.
Spectral model in the cutoff power-law:
------------------------------------------------------------
Parameters  : value       lower 90%   higher 90%
Photon index: -1.38904     ( -0.434116   0.528142 )
Epeak [keV] : 80.8840      ( -23.2744 -80.884 )
Norm@50keV  : 1.66689E-02    ( -0.00637165   0.0136086 )
------------------------------------------------------------
#Fit statistic : Chi-Squared =          54.41 using 59 PHA bins.
# Reduced chi-squared =         0.9716 for     56 degrees of freedom
# Null hypothesis probability =   5.353678e-01

Photon flux (15-150 keV)    in 24.18 sec: 1.43344 ( -0.11482  0.11495 ) ph/cm2/s
Energy fluence (15-150 keV)             : 2.33866e-06 ( -1.96869e-07  1.96802e-07 ) ergs/cm2
1-s peak spectrum fit
Power-law model

Time interval is from   12.268 sec. to   13.268 sec.

Spectral model in power-law:
------------------------------------------------------------
Parameters  : value       lower 90%   higher 90%
Photon index: -2.0989     ( -0.447067   0.390241 )
Norm@50keV  : 1.56193E-02    ( -0.00425371   0.00397937 )
------------------------------------------------------------
#Fit statistic : Chi-Squared =          60.94 using 59 PHA bins.
# Reduced chi-squared =          1.069 for     57 degrees of freedom
# Null hypothesis probability =   3.361801e-01

Photon flux (15-150 keV)    in 1 sec: 2.45619 ( -0.53271  0.53402 ) ph/cm2/s
Energy fluence (15-150 keV)             : 1.45131e-07 ( -3.46189e-08  3.51168e-08 ) ergs/cm2
Cutoff power-law model

Time interval is from   12.268 sec. to   13.268 sec.
Spectral model in the cutoff power-law:
------------------------------------------------------------
Parameters  : value       lower 90%   higher 90%
Photon index: -1.99131     (       )
Epeak [keV] : 5.12652      (   )
Norm@50keV  : 1.72134E-02    (     )
------------------------------------------------------------
#Fit statistic : Chi-Squared =          61.03 using 59 PHA bins.
# Reduced chi-squared =          1.090 for     56 degrees of freedom
# Null hypothesis probability =   3.001082e-01

Photon flux (15-150 keV)    in 1 sec: 2.43566 ( -0.51309  0.52419 ) ph/cm2/s
Energy fluence (15-150 keV)             : 0 ( 0  0 ) ergs/cm2
Time-resolved spectra

Distribution
T90 vs. Hardness ratio plot
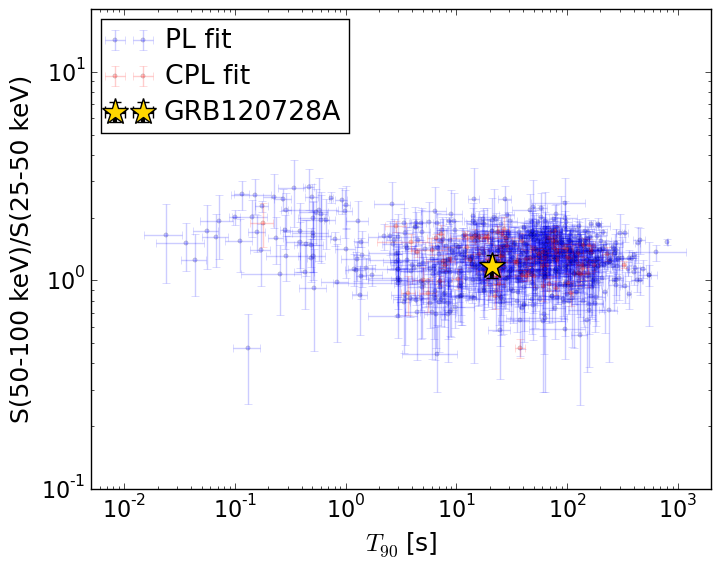
T90                                   = 20.976 sec.
Hardness ratio (energy fluence ratio) = 1.17481625077
S(15-50 keV) vs. S(50-150 keV) plot
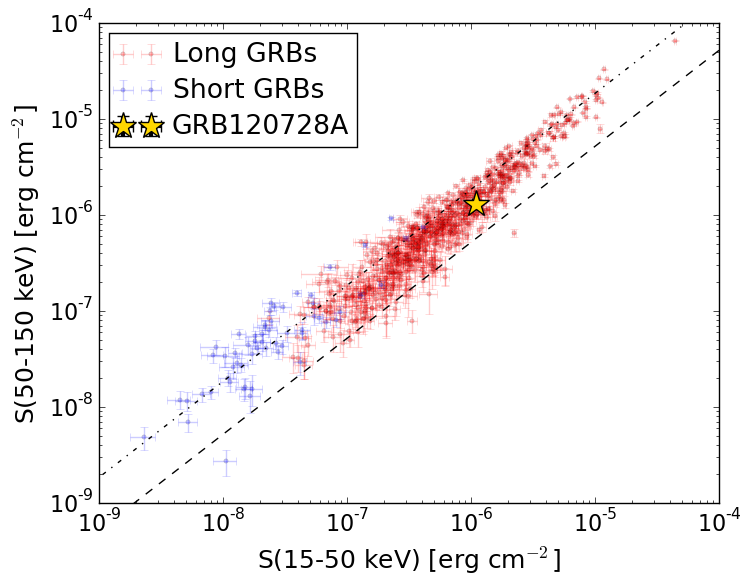
S(15-50 keV)  = 1.0921766e-06
S(50-150 keV) = 1.3015724e-06
The dash-dotted line and the dashed line traces the fluences calculated from the Band function with Epeak = 15 and 150 keV, respectively. Both lines assume a canonical values of alpha = -1 and beta = -2.5.
Mask shadow pattern
IMX = -1.260021987066310E+00, IMY = -1.744211878268362E-01
Spacecraft aspect plot

Bright source in the pre-burst/pre-slew/post-slew images
Pre-burst image of 15-350 keV band
Time interval of the image:
-282.811400 -267.604500
-239.512000 -0.040000

# RAcent  DECcent POSerr Theta    Phi  PeakCts   SNR AngSep     Name
#  [deg]    [deg]    ['] [deg]  [deg]                   [']
135.5739 -40.5805    3.3  46.0 -171.1   1.2061   3.6    2.6	Vela X-1
170.3448 -60.4657    0.0  46.9  148.3  -1.4939  -2.3    9.5	Cen X-3
216.4911  22.8161    2.3  52.2    8.4   2.9769   5.1 ------	UNKNOWN
120.5398 -43.4308    2.4  57.5 -170.3   4.4711   4.9 ------	UNKNOWN
158.0046   1.8119    3.3  25.8  -91.3   0.8930   3.5 ------	UNKNOWN
145.7339  -5.0220    2.7  33.6 -115.2   1.3167   4.3 ------	UNKNOWN
147.4436  12.6100    2.9  40.8  -88.1   3.5455   3.9 ------	UNKNOWN
134.1042  -4.6307    2.5  44.9 -119.7   3.8766   4.6 ------	UNKNOWN
Pre-slew background subtracted image of 15-350 keV band
Time interval of the image:
-0.040000 24.136000

# RAcent  DECcent POSerr Theta    Phi  PeakCts   SNR AngSep     Name
#  [deg]    [deg]    ['] [deg]  [deg]                   [']
135.5190 -40.6201    3.9  46.0 -171.1   0.2873   3.0    3.9	Vela X-1
170.1952 -60.5208    4.2  47.0  148.4  -0.5219  -2.8    7.1	Cen X-3
213.8605 -23.1753    2.8  34.5   73.5   0.4602   4.1 ------	UNKNOWN
205.7805 -13.5897    1.8  26.3   55.3   0.4405   6.6 ------	UNKNOWN
137.0875 -54.4364    0.6  51.8  172.1   3.7223  19.1 ------	UNKNOWN
Post-slew image of 15-350 keV band
Time interval of the image:
131.788600 962.518000

# RAcent  DECcent POSerr Theta    Phi  PeakCts   SNR AngSep     Name
#  [deg]    [deg]    ['] [deg]  [deg]                   [']
135.5250 -40.5605    1.1  13.9  -86.5   5.0133  10.3    0.4	Vela X-1
170.5737 -60.6192    5.7  18.7   41.3   0.9099   2.0    7.6	Cen X-3
186.6511 -62.7769    0.6  26.3   47.0  10.0314  19.6    0.4	GX 301-2
107.0460 -52.9894    2.9  17.7 -179.0   1.6490   4.0 ------	UNKNOWN
181.1050 -28.3003    2.7  41.0  -12.8   2.5129   4.3 ------	UNKNOWN
128.9574 -43.2433    1.3  12.4 -110.2   3.9980   8.8 ------	UNKNOWN
102.5286 -14.6962    2.5  48.0 -129.1  11.1502   4.7 ------	UNKNOWN