Analysis Summary
Notes:
- 1) No attempt has been made to eliminate the non-significant decimal places.
- 2) This batgrbproduct analysis is done using the HEASARC data.
- 3) This batgrbproduct analysis is using the flight position for the mask-weighting calculation.
======================================================================
BAT GRB EVENT DATA PROCESSING REPORT
Process Script Ver: batgrbproduct v2.46
Process Start Time: Mon Jan 13 02:50:14 EST 2014
Host Name: batevent1
Current Working Dir: /local/data/batevent/batevent_reproc/trigger529095
======================================================================
Trigger: 00529095 Segment: 000
BAT Trigger Time: 365252183.552 [s; MET]
Trigger Stop: 365252184.576 [s; MET]
UTC: 2012-07-29T10:56:14.073500 [includes UTCF correction]
Where From?: TDRSS position message
BAT
RA: 13.0556615694054 Dec: 49.9398263832054 [deg; J2000]
Catalogged Source?: NO
Point Source?: YES
GRB Indicated?: YES [ by BAT flight software ]
Image S/N Ratio: 19.36
Image Trigger?: NO
Rate S/N Ratio: 48.5386443980464 [ if not an image trigger ]
Image S/N Ratio: 19.36
Analysis Position: [ source = BAT ]
RA: 13.0556615694054 Dec: 49.9398263832054 [deg; J2000]
Refined Position: [ source = BAT pre-slew burst ]
RA: 13.0789252409463 Dec: 49.9376455295995 [deg; J2000]
{ 00h 52m 18.9s , +49d 56' 15.5" }
+/- 0.71999563988093 [arcmin] (estimated 90% radius based on SNR)
+/- 0.155655413236697 [arcmin] (formal 1-sigma fit error)
SNR: 48.6332011162089
Angular difference between the analysis and refined position is 0.907838 arcmin
Partial Coding Fraction: 0.765625 [ including projection effects ]
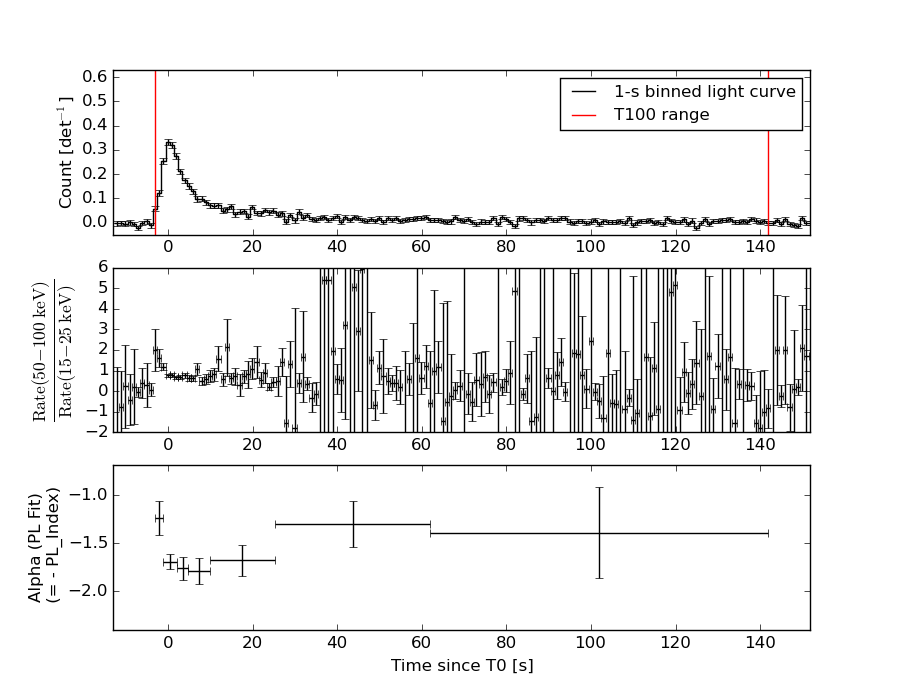
Duration
T90: 93.9279999136925 +/- 36.6355554286164
Measured from: -1.39199995994568
to: 92.5359999537468 [s; relative to TRIGTIME]
T50: 24.823999941349 +/- 4.44659694303347
Measured from: 1.32400000095367
to: 26.1479999423027 [s; relative to TRIGTIME]
Fluence
Peak Flux (peak 1 second)
Measured from: 0.0440000295639038
to: 1.0440000295639 [s; relative to TRIGTIME]
Total Fluence
Measured from: -3.09999996423721
to: 141.791999995708 [s; relative to TRIGTIME]
Band 1 Band 2 Band 3 Band 4
15-25 25-50 50-100 100-350 keV
Total 1.301547 1.616063 1.073606 0.266030
0.058891 0.060395 0.052882 0.045003 [error]
Peak 0.098013 0.144406 0.091209 0.016672
0.007027 0.007602 0.006628 0.005026 [error]
[ fluence units of on-axis counts / fully illuminated detector ]
======================================================================
====== Table of the duration information =============================
Value tstart tstop
T100 144.892 -3.100 141.792
T90 93.928 -1.392 92.536
T50 24.824 1.324 26.148
Peak 1.000 0.044 1.044
====== Spectral Analysis Summary =====================================
Model : spectral model: simple power-law (PL) and cutoff power-law (CPL)
Ph_index : photon index: E^{Ph_index}
Ph_90err : 90% error of the photon index
Epeak : Epeak in keV
Epeak_90err: 90% error of Epeak
Norm : normalization at 50 keV in both the PL model and CPL model
Nomr_90err : 90% error of the normalization
chi2 : Chi-Squared
dof : degree of freedo
=== Time-averaged spectral analysis ===
(Best model with acceptable fit: PL)
Model Ph_index Ph_90err_low Ph_90err_hi Epeak Epeak_90err_low Epeak_90err_hi Norm Nomr_90err_low Norm_90err_hi chi2 dof
PL -1.613 -0.085 0.084 - - - 1.85e-03 -8.56e-05 8.53e-05 65.340 57
CPL -1.612 -0.084 0.282 9999.070 -9999.070 -9999.070 1.86e-03 -8.31e-05 7.02e-04 65.350 56
=== 1-s peak spectral analysis ===
(Best model with acceptable fit: CPL)
Model Ph_index Ph_90err_low Ph_90err_hi Epeak Epeak_90err_low Epeak_90err_hi Norm Nomr_90err_low Norm_90err_hi chi2 dof
PL -1.663 -0.110 0.108 - - - 2.22e-02 -1.52e-03 1.51e-03 58.170 57
CPL -0.777 -0.489 0.552 64.985 -10.141 24.706 6.53e-02 -2.89e-02 6.16e-02 47.780 56
=== Fluence/Peak Flux Summary ===
Model Band1 Band2 Band3 Band4 Band5 Total
15-25 25-50 50-100 100-350 15-150 15-350 keV
Fluence PL 3.81e-07 6.54e-07 8.55e-07 2.27e-06 2.51e-06 4.16e-06 erg/cm2
90%_error_low -3.00e-08 -3.05e-08 -5.31e-08 -2.94e-07 -1.24e-07 -3.35e-07 erg/cm2
90%_error_hi 3.07e-08 3.05e-08 5.31e-08 3.24e-07 1.25e-07 3.59e-07 erg/cm2
Peak flux PL 1.07e+00 9.78e-01 6.17e-01 5.97e-01 2.91e+00 3.26e+00 ph/cm2/s
90%_error_low -1.06e-01 -6.34e-02 -5.42e-02 -9.76e-02 -1.86e-01 -2.08e-01 ph/cm2/s
90%_error_hi 1.09e-01 6.32e-02 5.41e-02 1.08e-01 1.86e-01 2.09e-01 ph/cm2/s
Fluence CPL 3.82e-07 6.53e-07 8.54e-07 2.29e-06 2.51e-06 4.15e-06 erg/cm2
90%_error_low -3.45e-08 -2.97e-08 -5.78e-08 -8.63e-07 -1.37e-07 -8.31e-07 erg/cm2
90%_error_hi 3.06e-08 3.54e-08 6.03e-08 1.58e-07 1.23e-07 1.90e-07 erg/cm2
Peak flux CPL 9.35e-01 1.07e+00 6.45e-01 2.35e-01 2.81e+00 2.88e+00 ph/cm2/s
90%_error_low -1.27e-01 -8.07e-02 -6.16e-02 -9.22e-02 -1.94e-01 -2.19e-01 ph/cm2/s
90%_error_hi 1.30e-01 8.26e-02 6.19e-02 1.48e-01 1.94e-01 2.37e-01 ph/cm2/s
======================================================================
Image
Pre-slew 15.0-350.0 keV image (Event data)
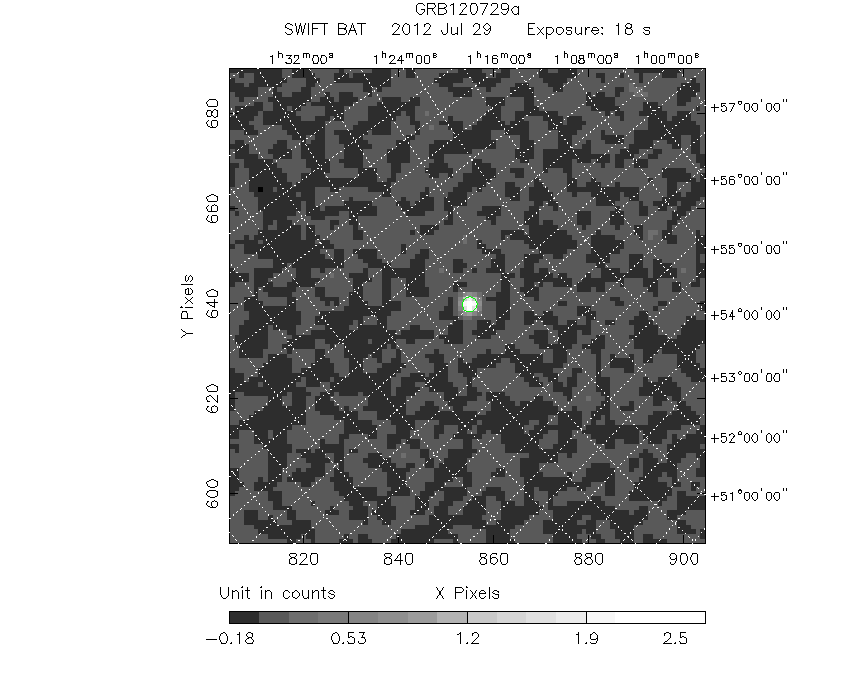
#   RAcent    DECcent   POSerr    Theta     Phi              Peak Cts       SNR   Name
   13.0789    49.9376   0.0039    19.1274   -81.3989         2.7219382     48.633 TRIG_00529095

Foreground time interval of the image:
 -3.100  15.349 (delta_t =  18.449 [sec])
Background time interval of the image:
-239.552  -3.100 (delta_t = 236.452 [sec])
Light Curves
Note: The mask-weighted lightcurves have units of either count/det or counts/sec/det, where a det is 0.4 x 0.4 = 0.16 sq cm.
Full-time range; 1 s binning
Other quick-look light curves:
- 64 ms binning (zoomed)
- 16 ms binning (zoomed)
- 8 ms binning (zoomed)
- 2 ms binning (zoomed)
- SN=5 or 10 s binning (full-time range)
- Raw light curve
Spectra
- 64 ms binning (zoomed)
- 16 ms binning (zoomed)
- 8 ms binning (zoomed)
- 2 ms binning (zoomed)
- SN=5 or 10 s binning (full-time range)
- Raw light curve
Spectra
Notes:
- 1) The fitting includes the systematic errors.
- 2) When the burst includes telescope slew time periods, the fitting uses an average response file made from multiple 5-s response files through out the slew time plus single time preiod for the non-slew times, and weighted by the total counts in the corresponding time period using addrmf. An average response file is needed becuase a spectral fit using the pre-slew DRM will introduce some errors in both a spectral shape and a normalization if the PHA file contains a lot of the slew/post-slew time interval.
- 3) For fits to more complicated models (e.g. a power-law over a cutoff power-law), the BAT team has decided to require a chi-square improvement of more than 6 for each extra dof.
Time averaged spectrum fit using the average DRM
Power-law model
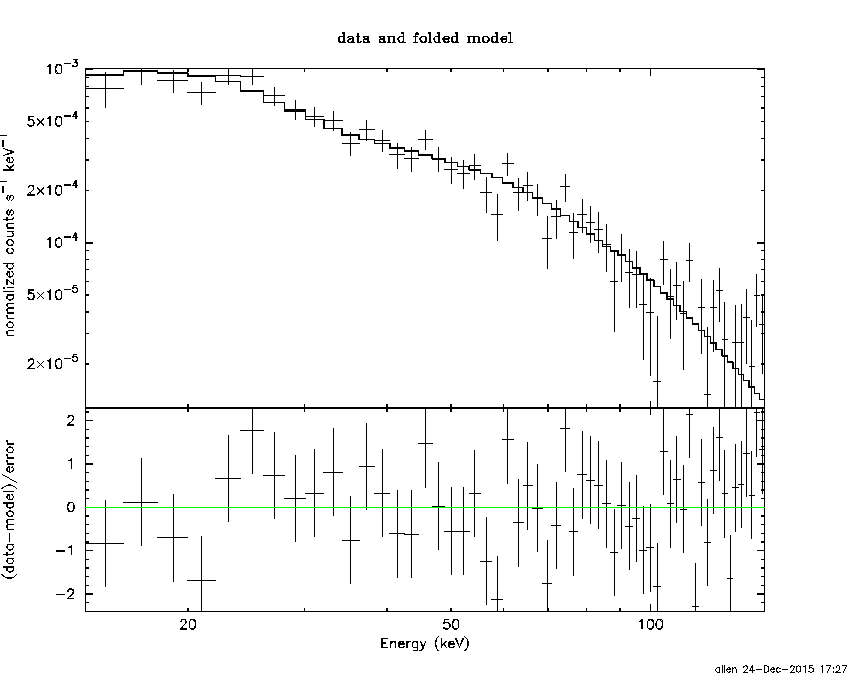
Time interval is from   -3.100 sec. to  141.792 sec.

Spectral model in power-law:
------------------------------------------------------------
Parameters  : value       lower 90%   higher 90%
Photon index: -1.61265     ( -0.0847006   0.0842248 )
Norm@50keV  : 1.85319E-03    ( -8.56258e-05   8.53154e-05 )
------------------------------------------------------------
#Fit statistic : Chi-Squared =          65.34 using 59 PHA bins.
# Reduced chi-squared =          1.146 for     57 degrees of freedom
# Null hypothesis probability =   2.095182e-01

Photon flux (15-150 keV)    in 144.9 sec: 0.239094 ( -0.011046  0.011075 ) ph/cm2/s
Energy fluence (15-150 keV)             : 2.50789e-06 ( -1.24478e-07  1.2516e-07 ) ergs/cm2
Cutoff power-law model

Time interval is from   -3.100 sec. to  141.792 sec.
Spectral model in the cutoff power-law:
------------------------------------------------------------
Parameters  : value       lower 90%   higher 90%
Photon index: -1.61165     ( -0.0845674   0.28127 )
Epeak [keV] : 9999.07      ( -9999.32 -9999.32 )
Norm@50keV  : 1.85548E-03    ( -8.4885e-05   0.000700449 )
------------------------------------------------------------
#Fit statistic : Chi-Squared =          65.35 using 59 PHA bins.
# Reduced chi-squared =          1.167 for     56 degrees of freedom
# Null hypothesis probability =   1.838163e-01

Photon flux (15-150 keV)    in 144.9 sec: 0.239312 ( -0.011828  0.011029 ) ph/cm2/s
Energy fluence (15-150 keV)             : 2.51055e-06 ( -1.36565e-07  1.22736e-07 ) ergs/cm2
1-s peak spectrum fit
Power-law model
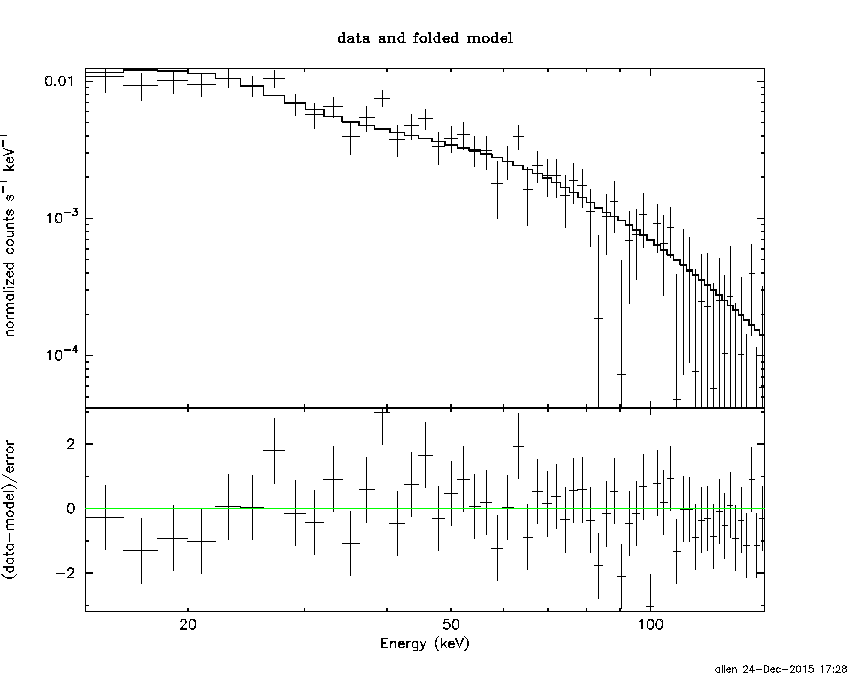
Time interval is from    0.044 sec. to    1.044 sec.

Spectral model in power-law:
------------------------------------------------------------
Parameters  : value       lower 90%   higher 90%
Photon index: -1.66311     ( -0.110134   0.108068 )
Norm@50keV  : 2.22214E-02    ( -0.00152265   0.00151174 )
------------------------------------------------------------
#Fit statistic : Chi-Squared =          58.17 using 59 PHA bins.
# Reduced chi-squared =          1.021 for     57 degrees of freedom
# Null hypothesis probability =   4.319495e-01

Photon flux (15-150 keV)    in 1 sec: 2.91434 ( -0.18626  0.18637 ) ph/cm2/s
Energy fluence (15-150 keV)             : 2.06433e-07 ( -1.49589e-08  1.50855e-08 ) ergs/cm2
Cutoff power-law model
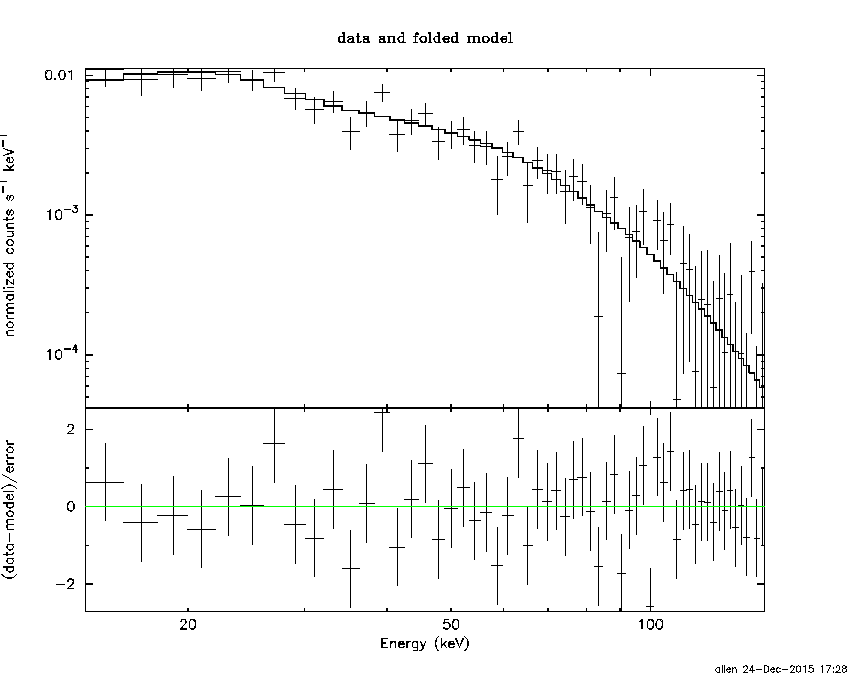
Time interval is from    0.044 sec. to    1.044 sec.
Spectral model in the cutoff power-law:
------------------------------------------------------------
Parameters  : value       lower 90%   higher 90%
Photon index: -0.777151     ( -0.489117   0.551621 )
Epeak [keV] : 64.9848      ( -10.1407 24.7061 )
Norm@50keV  : 6.53423E-02    ( -0.028882   0.0615652 )
------------------------------------------------------------
#Fit statistic : Chi-Squared =          47.78 using 59 PHA bins.
# Reduced chi-squared =         0.8533 for     56 degrees of freedom
# Null hypothesis probability =   7.745905e-01

Photon flux (15-150 keV)    in 1 sec: 2.81154 ( -0.19404  0.19416 ) ph/cm2/s
Energy fluence (15-150 keV)             : 1.92615e-07 ( -1.64539e-08  1.67239e-08 ) ergs/cm2
Time-resolved spectra
Distribution
T90 vs. Hardness ratio plot
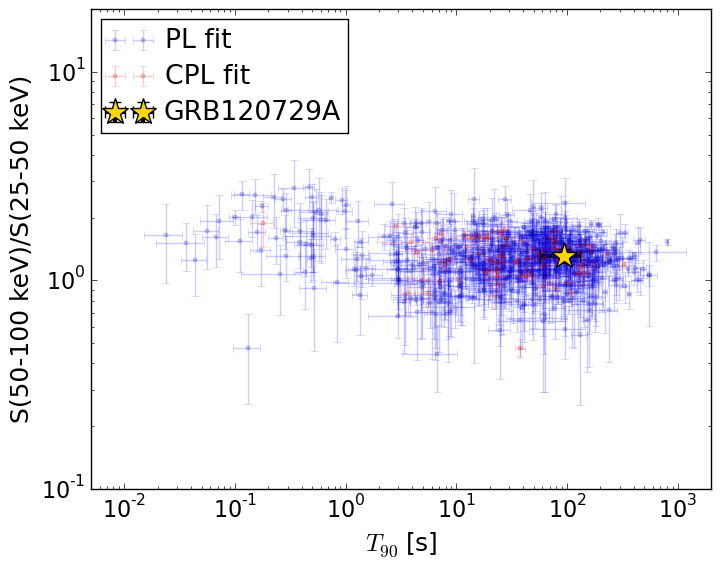
T90                                   = 93.928 sec.
Hardness ratio (energy fluence ratio) = 1.30803705459
S(15-50 keV) vs. S(50-150 keV) plot
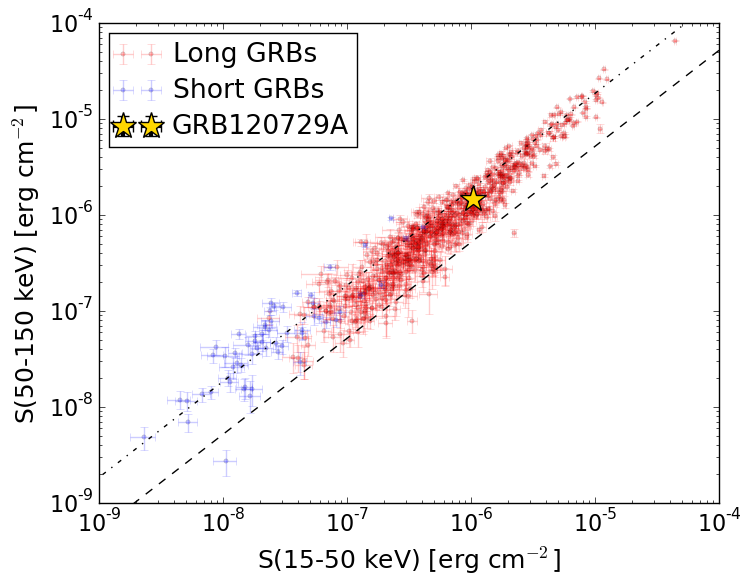
S(15-50 keV)  = 1.0349787e-06
S(50-150 keV) = 1.4728992e-06
The dash-dotted line and the dashed line traces the fluences calculated from the Band function with Epeak = 15 and 150 keV, respectively. Both lines assume a canonical values of alpha = -1 and beta = -2.5.
Mask shadow pattern
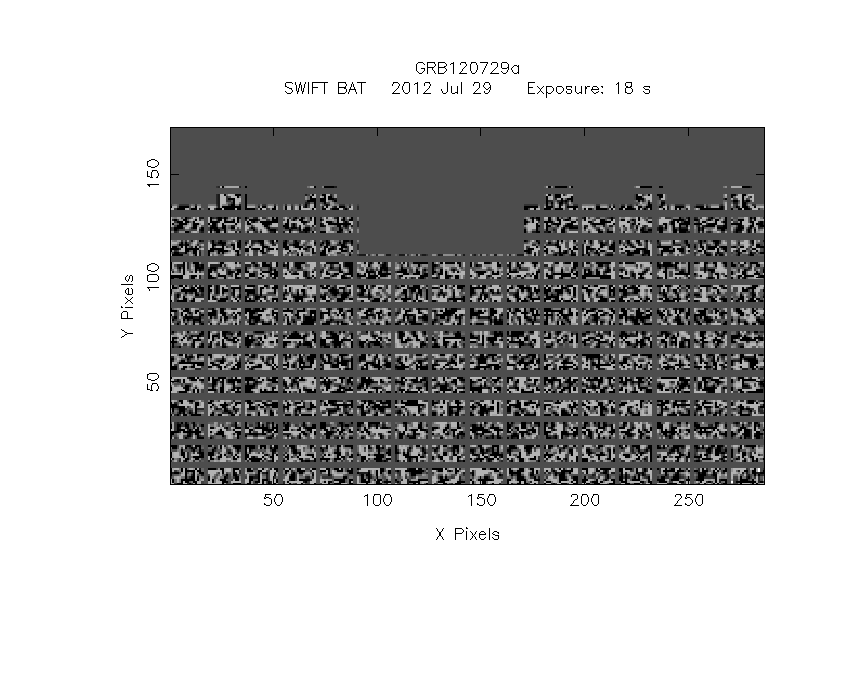
IMX = 5.186808599736119E-02, IMY = 3.429166619534886E-01
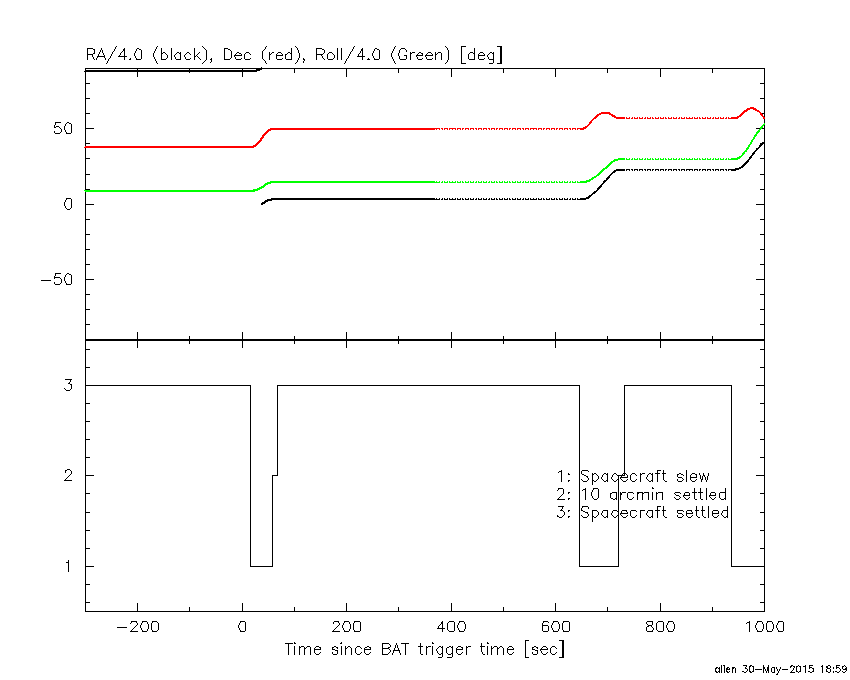
Spacecraft aspect plot
Bright source in the pre-burst/pre-slew/post-slew images
Pre-burst image of 15-350 keV band
Time interval of the image:
-239.552000 -3.100000

# RAcent  DECcent POSerr Theta    Phi  PeakCts   SNR AngSep     Name
#  [deg]    [deg]    ['] [deg]  [deg]                   [']
299.5581  35.3184    4.7  41.9  157.7   0.8739   2.5    7.2	Cyg X-1
308.1101  41.0055    1.2  33.9  163.9   2.1290   9.3    3.2	Cyg X-3
326.1736  38.2744    4.8  20.5  153.7   0.4053   2.4    2.8	Cyg X-2
Pre-slew background subtracted image of 15-350 keV band
Time interval of the image:
-3.100000 15.348600

# RAcent  DECcent POSerr Theta    Phi  PeakCts   SNR AngSep     Name
#  [deg]    [deg]    ['] [deg]  [deg]                   [']
299.6067  35.0894    7.3  41.9  157.4   0.1413   1.6    6.8	Cyg X-1
308.1925  40.8132   10.5  33.9  163.5  -0.0741  -1.1    9.2	Cyg X-3
326.0681  38.2003    5.9  20.6  153.5   0.0916   1.9    8.8	Cyg X-2
343.6848   7.0131    2.3  31.8   70.8   0.4275   5.1 ------	UNKNOWN
327.8820  17.5950    2.6  29.4  107.7   0.3475   4.6 ------	UNKNOWN
 13.0789  49.9376    0.2  19.1  -81.4   2.7220  48.6 ------	UNKNOWN
 52.6789  15.6680    2.3  57.2  -30.2   1.3469   5.0 ------	UNKNOWN
Post-slew image of 15-350 keV band
Time interval of the image:
57.548600 645.048600

# RAcent  DECcent POSerr Theta    Phi  PeakCts   SNR AngSep     Name
#  [deg]    [deg]    ['] [deg]  [deg]                   [']
308.2834  41.0147    7.7  44.8  136.3   1.8347   1.5    8.7	Cyg X-3
326.3226  38.2995    4.2  34.8  120.5   1.8910   2.7    7.2	Cyg X-2
  7.4552  10.0040    2.4  40.2   40.3   3.0789   4.8 ------	UNKNOWN
332.6017  64.9938    2.8  25.8  172.7   1.2305   4.1 ------	UNKNOWN
245.0548  66.1649    3.2  57.3 -170.4   5.1957   3.6 ------	UNKNOWN
251.8679  73.1055    3.2  50.6 -167.0   2.8319   3.6 ------	UNKNOWN
 58.6156   5.0415    3.1  58.9  -24.4   7.3934   3.7 ------	UNKNOWN
 66.9628  21.4285    3.3  50.8  -44.4   5.6023   3.5 ------	UNKNOWN
126.4198  74.5419    2.4  48.0 -129.0   6.9489   4.8 ------	UNKNOWN