Analysis Summary
Notes:
- 1) No attempt has been made to eliminate the non-significant decimal places.
- 2) This batgrbproduct analysis is done using the HEASARC data.
- 3) This batgrbproduct analysis is using the flight position for the mask-weighting calculation.
======================================================================
BAT GRB EVENT DATA PROCESSING REPORT
Process Script Ver: batgrbproduct v2.46
Process Start Time: Mon Jan 13 02:35:29 EST 2014
Host Name: batevent1
Current Working Dir: /local/data/batevent/batevent_reproc/trigger529582
======================================================================
Trigger: 00529582 Segment: 000
BAT Trigger Time: 365671345.6 [s; MET]
Trigger Stop: 365671353.792 [s; MET]
UTC: 2012-08-03T07:22:16.104060 [includes UTCF correction]
Where From?: TDRSS position message
BAT
RA: 269.565357237366 Dec: -6.71511030893272 [deg; J2000]
Catalogged Source?: NO
Point Source?: YES
GRB Indicated?: YES [ by BAT flight software ]
Image S/N Ratio: 7.28
Image Trigger?: NO
Rate S/N Ratio: 11.7898261225516 [ if not an image trigger ]
Image S/N Ratio: 7.28
Analysis Position: [ source = BAT ]
RA: 269.565357237366 Dec: -6.71511030893272 [deg; J2000]
Refined Position: [ source = BAT pre-slew burst ]
RA: 269.522898174398 Dec: -6.72695508258997 [deg; J2000]
{ 17h 58m 05.5s , -06d 43' 37.0" }
+/- 2.24755184633744 [arcmin] (estimated 90% radius based on SNR)
+/- 1.29784962668908 [arcmin] (formal 1-sigma fit error)
SNR: 9.56480068744784
Angular difference between the analysis and refined position is 2.627957 arcmin
Partial Coding Fraction: 0.546875 [ including projection effects ]
Duration
T90: 8.88799995183945 +/- 2.29548512418709
Measured from: 1.65199995040894
to: 10.5399999022484 [s; relative to TRIGTIME]
T50: 4.22399997711182 +/- 1.74224222591427
Measured from: 3.35599994659424
to: 7.57999992370605 [s; relative to TRIGTIME]
Fluence
Peak Flux (peak 1 second)
Measured from: 2.93599998950958
to: 3.93599998950958 [s; relative to TRIGTIME]
Total Fluence
Measured from: 1.09599995613098
to: 11.0879999995232 [s; relative to TRIGTIME]
Band 1 Band 2 Band 3 Band 4
15-25 25-50 50-100 100-350 keV
Total 0.061447 0.129985 0.123788 0.053335
0.024748 0.023372 0.019920 0.016474 [error]
Peak 0.016931 0.025171 0.022660 0.011348
0.007897 0.007767 0.006413 0.005139 [error]
[ fluence units of on-axis counts / fully illuminated detector ]
======================================================================
====== Table of the duration information =============================
Value tstart tstop
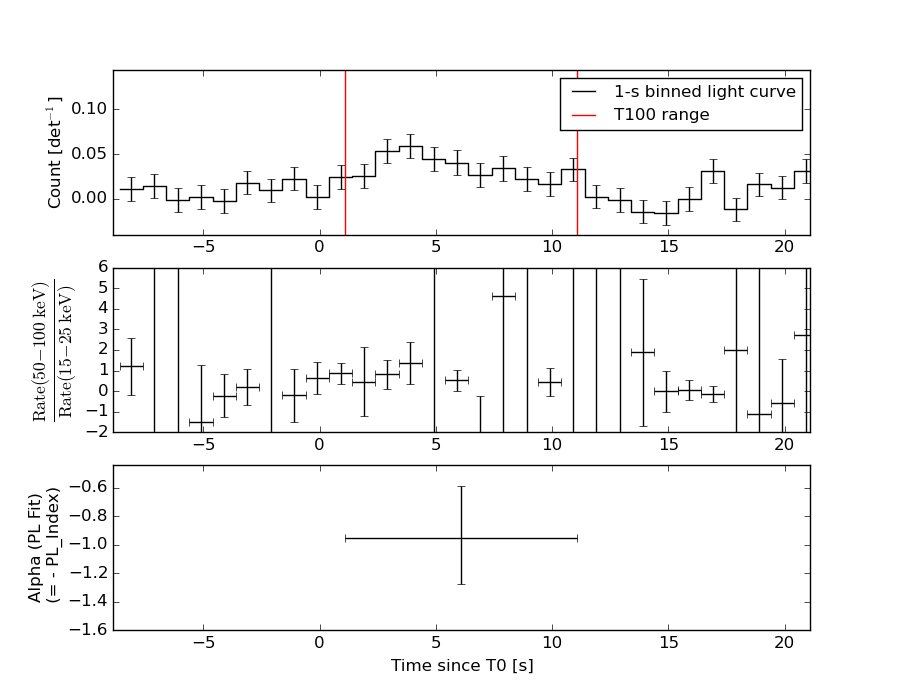
T100 9.992 1.096 11.088
T90 8.888 1.652 10.540
T50 4.224 3.356 7.580
Peak 1.000 2.936 3.936
====== Spectral Analysis Summary =====================================
Model : spectral model: simple power-law (PL) and cutoff power-law (CPL)
Ph_index : photon index: E^{Ph_index}
Ph_90err : 90% error of the photon index
Epeak : Epeak in keV
Epeak_90err: 90% error of Epeak
Norm : normalization at 50 keV in both the PL model and CPL model
Nomr_90err : 90% error of the normalization
chi2 : Chi-Squared
dof : degree of freedo
=== Time-averaged spectral analysis ===
(Best model with acceptable fit: PL)
Model Ph_index Ph_90err_low Ph_90err_hi Epeak Epeak_90err_low Epeak_90err_hi Norm Nomr_90err_low Norm_90err_hi chi2 dof
PL -0.949 -0.328 0.362 - - - 2.55e-03 -4.95e-04 4.76e-04 57.100 57
CPL -0.878 N/A N/A 939.050 N/A N/A 2.74e-03 N/A N/A 57.200 56
=== 1-s peak spectral analysis ===
(Best model with acceptable fit: N/A)
Model Ph_index Ph_90err_low Ph_90err_hi Epeak Epeak_90err_low Epeak_90err_hi Norm Nomr_90err_low Norm_90err_hi chi2 dof
PL -1.430 -0.643 0.642 - - - 4.67e-03 -1.48e-03 1.47e-03 108.220 57
CPL -1.455 -0.620 1.297 9999.360 -9999.360 -9999.360 4.64e-03 -1.44e-03 1.66e-02 108.230 56
=== Fluence/Peak Flux Summary ===
Model Band1 Band2 Band3 Band4 Band5 Total
15-25 25-50 50-100 100-350 15-150 15-350 keV
Fluence PL 1.95e-08 5.03e-08 1.04e-07 5.49e-07 2.81e-07 7.23e-07 erg/cm2
90%_error_low -7.66e-09 -1.29e-08 -1.85e-08 -2.06e-07 -4.92e-08 -2.13e-07 erg/cm2
90%_error_hi 9.05e-09 1.25e-08 1.83e-08 2.94e-07 4.93e-08 2.91e-07 erg/cm2
Peak flux PL 1.80e-01 1.89e-01 1.40e-01 1.68e-01 5.73e-01 6.76e-01 ph/cm2/s
90%_error_low -1.01e-01 -7.27e-02 -5.65e-02 -1.09e-01 -1.91e-01 -2.13e-01 ph/cm2/s
90%_error_hi 1.23e-01 6.76e-02 5.26e-02 1.88e-01 1.92e-01 2.15e-01 ph/cm2/s
Fluence CPL 1.99e-08 5.02e-08 1.03e-07 5.51e-07 2.82e-07 6.76e-07 erg/cm2
90%_error_low N/A N/A -1.88e-08 -3.67e-07 -5.46e-08 -3.20e-07 erg/cm2
90%_error_hi N/A N/A 2.42e-08 1.33e-07 5.27e-08 3.23e-07 erg/cm2
Peak flux CPL 1.68e-01 1.31e-01 7.08e-02 6.63e-02 3.96e-01 4.36e-01 ph/cm2/s
90%_error_low -1.68e-01 -1.31e-01 -7.08e-02 -6.63e-02 -3.96e-01 -4.36e-01 ph/cm2/s
90%_error_hi 1.14e-01 7.80e-02 3.42e-02 2.03e-02 2.28e-01 2.25e-01 ph/cm2/s
======================================================================
Image
Pre-slew 15.0-350.0 keV image (Event data)
#   RAcent    DECcent   POSerr    Theta     Phi              Peak Cts       SNR   Name
  269.5229    -6.7270   0.0202    33.8515    21.5907         0.4031493      9.565 TRIG_00529582

Foreground time interval of the image:
  1.096  11.088 (delta_t =   9.992 [sec])
Background time interval of the image:
-239.600   1.096 (delta_t = 240.696 [sec])
Light Curves
Note: The mask-weighted lightcurves have units of either count/det or counts/sec/det, where a det is 0.4 x 0.4 = 0.16 sq cm.
Full-time range; 1 s binning
Other quick-look light curves:
- 64 ms binning (zoomed)
- 16 ms binning (zoomed)
- 8 ms binning (zoomed)
- 2 ms binning (zoomed)
- SN=5 or 10 s binning (full-time range)
- Raw light curve
Spectra
- 64 ms binning (zoomed)
- 16 ms binning (zoomed)
- 8 ms binning (zoomed)
- 2 ms binning (zoomed)
- SN=5 or 10 s binning (full-time range)
- Raw light curve
Spectra
Notes:
- 1) The fitting includes the systematic errors.
- 2) When the burst includes telescope slew time periods, the fitting uses an average response file made from multiple 5-s response files through out the slew time plus single time preiod for the non-slew times, and weighted by the total counts in the corresponding time period using addrmf. An average response file is needed becuase a spectral fit using the pre-slew DRM will introduce some errors in both a spectral shape and a normalization if the PHA file contains a lot of the slew/post-slew time interval.
- 3) For fits to more complicated models (e.g. a power-law over a cutoff power-law), the BAT team has decided to require a chi-square improvement of more than 6 for each extra dof.
Time averaged spectrum fit using the average DRM
Power-law model
Time interval is from    1.096 sec. to   11.088 sec.

Spectral model in power-law:
------------------------------------------------------------
Parameters  : value       lower 90%   higher 90%
Photon index: -0.949486     ( -0.32801   0.36167 )
Norm@50keV  : 2.55071E-03    ( -0.000495062   0.000475854 )
------------------------------------------------------------
#Fit statistic : Chi-Squared =          57.10 using 59 PHA bins.
# Reduced chi-squared =          1.002 for     57 degrees of freedom
# Null hypothesis probability =   4.712797e-01

Photon flux (15-150 keV)    in 9.992 sec: 0.293044 ( -0.05634  0.057281 ) ph/cm2/s
Energy fluence (15-150 keV)             : 2.80732e-07 ( -4.91675e-08  4.92667e-08 ) ergs/cm2
Cutoff power-law model
Time interval is from    1.096 sec. to   11.088 sec.
Spectral model in the cutoff power-law:
------------------------------------------------------------
Parameters  : value       lower 90%   higher 90%
Photon index: -0.877909     (       )
Epeak [keV] : 939.050      (   )
Norm@50keV  : 2.74021E-03    (     )
------------------------------------------------------------
#Fit statistic : Chi-Squared =          57.20 using 59 PHA bins.
# Reduced chi-squared =          1.022 for     56 degrees of freedom
# Null hypothesis probability =   4.301757e-01

Photon flux (15-150 keV)    in 9.992 sec: 0.295262 ( -0.064011  0.060263 ) ph/cm2/s
Energy fluence (15-150 keV)             : 2.8162e-07 ( -5.46004e-08  5.27082e-08 ) ergs/cm2
1-s peak spectrum fit
Power-law model
Time interval is from    2.936 sec. to    3.936 sec.

Spectral model in power-law:
------------------------------------------------------------
Parameters  : value       lower 90%   higher 90%
Photon index: -1.43041     ( -0.643275   0.642156 )
Norm@50keV  : 4.66928E-03    ( -0.00147952   0.0014686 )
------------------------------------------------------------
#Fit statistic : Chi-Squared =         108.22 using 59 PHA bins.
# Reduced chi-squared =         1.8986 for     57 degrees of freedom
# Null hypothesis probability =   5.020632e-05

Photon flux (15-150 keV)    in 1 sec: 0.572687 ( -0.190868  0.192252 ) ph/cm2/s
Energy fluence (15-150 keV)             : 4.48528e-08 ( -1.53658e-08  1.55198e-08 ) ergs/cm2
Cutoff power-law model
Time interval is from    2.936 sec. to    3.936 sec.
Spectral model in the cutoff power-law:
------------------------------------------------------------
Parameters  : value       lower 90%   higher 90%
Photon index: -1.45531     ( -0.626591   1.29099 )
Epeak [keV] : 9999.36      ( -9999.36 -9999.36 )
Norm@50keV  : 4.64462E-03    ( -0.00147933   0.0165235 )
------------------------------------------------------------
#Fit statistic : Chi-Squared =         108.23 using 59 PHA bins.
# Reduced chi-squared =         1.9326 for     56 degrees of freedom
# Null hypothesis probability =   3.525614e-05

Photon flux (15-150 keV)    in 1 sec: 0.396299 ( -0.396299  0.228356 ) ph/cm2/s
Energy fluence (15-150 keV)             : 4.46982e-08 ( -1.53366e-08  1.5776e-08 ) ergs/cm2
Time-resolved spectra
Distribution
T90 vs. Hardness ratio plot
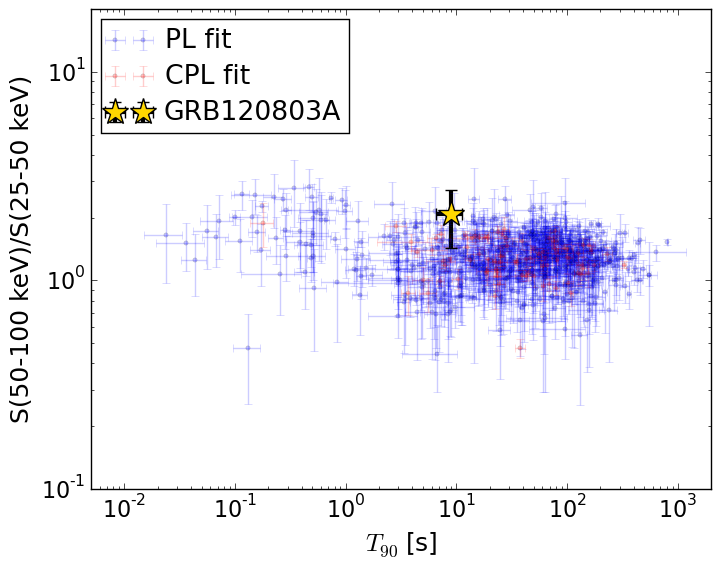
T90                                   = 8.888 sec.
Hardness ratio (energy fluence ratio) = 2.07128771812
S(15-50 keV) vs. S(50-150 keV) plot
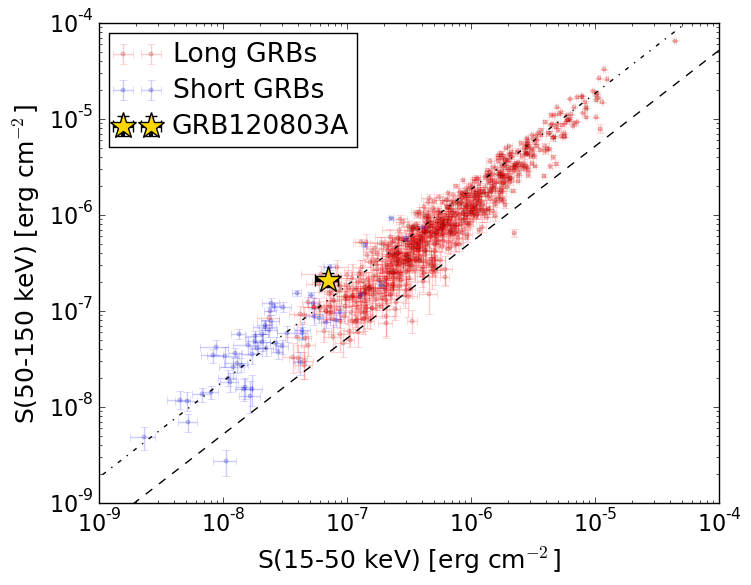
S(15-50 keV)  = 6.974418e-08
S(50-150 keV) = 2.109868e-07
The dash-dotted line and the dashed line traces the fluences calculated from the Band function with Epeak = 15 and 150 keV, respectively. Both lines assume a canonical values of alpha = -1 and beta = -2.5.
Mask shadow pattern
IMX = 6.236824423584943E-01, IMY = -2.468168698444961E-01
Spacecraft aspect plot
Bright source in the pre-burst/pre-slew/post-slew images
Pre-burst image of 15-350 keV band
Time interval of the image:
-239.600000 1.096000

# RAcent  DECcent POSerr Theta    Phi  PeakCts   SNR AngSep     Name
#  [deg]    [deg]    ['] [deg]  [deg]                   [']
244.9867 -15.6346    0.3  40.9  -19.7   9.4153  33.6    0.5	Sco X-1
255.9957 -37.8286    1.2  22.1  -50.3   1.9394  10.0    1.0	4U 1700-377
256.5036 -36.3968    3.5  21.9  -46.4   0.6525   3.3    3.7	GX 349+2
263.0233 -24.7715   15.3  22.2  -11.6   0.1405   0.8    1.7	GX 1+4
264.5203 -44.4830    6.2  16.1  -72.2   0.3653   1.9    9.7	4U 1735-44
268.3296  -1.4866    3.3  39.2   22.8   1.1754   3.5    3.1	SW J1753.5-0127
270.2770 -25.0694    1.6  17.4    1.8   1.2987   7.3    0.7	GX 5-1
270.3576 -25.5866  111.3  16.9    0.9   0.0211   0.1    9.8	GRS 1758-258
273.9976 -14.0152    2.2  25.5   25.0   1.0338   5.2    1.4	GX 17+2
275.9317 -30.4229    7.7  10.1    3.8   0.2510   1.5    3.4	H1820-303
285.1048 -25.0719   15.8  12.9   52.4   0.1242   0.7    9.8	HT1900.1-2455
263.0538 -33.8365    4.7  17.5  -34.7   0.4767   2.5    3.2	GX 354-0
  0.8867 -49.5266    3.0  54.3  177.1   3.0274   3.8 ------	UNKNOWN
276.3098 -37.2477    3.1   6.2  -38.1   0.6884   3.7 ------	UNKNOWN
  9.5251 -55.5648    3.4  57.2 -173.9   3.5763   3.4 ------	UNKNOWN
 18.2229 -66.4572    3.9  57.3 -160.1   3.4597   2.9 ------	UNKNOWN
 20.1815 -65.3129    3.2  58.5 -161.0   6.0932   3.6 ------	UNKNOWN
Pre-slew background subtracted image of 15-350 keV band
Time interval of the image:
1.096000 11.088000

# RAcent  DECcent POSerr Theta    Phi  PeakCts   SNR AngSep     Name
#  [deg]    [deg]    ['] [deg]  [deg]                   [']
244.9216 -15.5938   12.6  41.0  -19.7  -0.0453  -0.9    4.4	Sco X-1
255.9181 -38.0497    0.0  22.1  -51.0   0.0435   1.4   12.8	4U 1700-377
256.2288 -36.4221    7.7  22.2  -46.6   0.0479   1.5   10.0	GX 349+2
263.1379 -24.6696    6.7  22.2  -11.2  -0.0537  -1.7    8.4	GX 1+4
264.6991 -44.4638  637.3  15.9  -72.2  -0.0006  -0.0    2.1	4U 1735-44
268.4029  -1.5398    4.3  39.1   22.9   0.1424   2.7    5.6	SW J1753.5-0127
270.4228 -25.1689    7.9  17.2    2.0   0.0453   1.4    9.3	GX 5-1
270.3276 -25.8352    9.1  16.8    0.3   0.0390   1.3    5.7	GRS 1758-258
274.0182 -14.1457    3.6  25.4   24.9  -0.1123  -3.2    6.6	GX 17+2
276.0130 -30.3063  142.1  10.1    4.5   0.0024   0.1    5.8	H1820-303
284.9123 -25.0200    6.1  12.9   51.6   0.0588   1.9    9.0	HT1900.1-2455
263.0136 -33.6343  118.9  17.6  -34.1  -0.0030  -0.1   12.1	GX 354-0
269.5229  -6.7270    1.2  33.9   21.6   0.4031   9.6 ------	UNKNOWN
 14.0504 -58.7945    1.9  58.3 -169.3   1.0740   6.1 ------	UNKNOWN
326.2179 -87.0510    2.0  49.9 -134.4   0.7944   5.9 ------	UNKNOWN
Post-slew image of 15-350 keV band
Time interval of the image:
129.300600 962.471600

# RAcent  DECcent POSerr Theta    Phi  PeakCts   SNR AngSep     Name
#  [deg]    [deg]    ['] [deg]  [deg]                   [']
244.9881 -15.6345    0.3  25.7 -130.2  31.4657  43.3    0.6	Sco X-1
254.4427  35.3034    4.3  44.4  -35.6   3.2500   2.7    2.5	Her X-1
255.9378 -37.8652    3.4  33.5 -178.1   2.5053   3.4    2.6	4U 1700-377
256.2798 -36.4729    3.4  32.2 -177.4   2.1913   3.4    8.1	GX 349+2
263.0100 -24.7439    3.0  19.1 -179.2   1.9619   3.8    0.1	GX 1+4
264.5759 -44.4242    4.7  38.0  168.0   2.0755   2.5    7.3	4U 1735-44
268.2935  -1.4332    3.1   5.4  -31.7   2.2287   3.7    4.6	SW J1753.5-0127
270.2568 -25.0834    1.7  18.4  160.3   3.6885   6.8    1.5	GX 5-1
270.1702 -25.6499   10.4  18.9  160.6   0.6270   1.2    9.1	GRS 1758-258
273.9852 -14.1030    1.3   8.6  132.3   4.6312   8.9    4.2	GX 17+2
275.7936 -30.2626    4.1  24.3  149.1   1.8698   2.8    9.3	H1820-303
284.8816 -24.8791    5.8  23.3  125.0   1.2707   2.0    8.8	HT1900.1-2455
288.7922  10.9436    0.5  26.0   29.6  13.5762  24.6    0.4	GRS 1915+105
299.6383  35.1849    2.4  50.6   14.2   8.0214   4.9    2.6	Cyg X-1
263.0029 -33.8203    6.0  27.8  174.0  -1.2513  -1.9    1.1	GX 354-0
287.5567  -5.7224    2.5  17.9   70.0   2.8576   4.6 ------	UNKNOWN
290.8802  24.4625    3.5  37.4   15.1   2.5806   3.3 ------	UNKNOWN
270.6298  30.5585    2.6  37.3  -16.3   3.1529   4.4 ------	UNKNOWN
264.8007  36.5383    2.5  43.5  -23.4   4.5276   4.6 ------	UNKNOWN
239.8959  30.8434    4.5  47.1  -53.3   7.9474   2.6 ------	UNKNOWN