Analysis Summary
Notes:
- 1) No attempt has been made to eliminate the non-significant decimal places.
- 2) This batgrbproduct analysis is done using the HEASARC data.
- 3) This batgrbproduct analysis is using the flight position for the mask-weighting calculation.
======================================================================
                  BAT GRB EVENT DATA PROCESSING REPORT
    Process Script Ver: batgrbproduct v2.46
    Process Start Time: Mon Jan 13 02:17:46 EST 2014
             Host Name: batevent1
   Current Working Dir: /local/data/batevent/batevent_reproc/trigger529606
======================================================================

  Trigger: 00529606      Segment: 000

  BAT Trigger Time: 365684776.448   [s; MET]
      Trigger Stop: 365684777.472   [s; MET]
               UTC: 2012-08-03T11:06:06.951500    [includes UTCF correction]
       Where From?: TDRSS position message

  BAT
    RA: 314.22374452902   Dec: 53.2824925997842  [deg; J2000]

     Catalogged Source?: NO
     Point Source?:      YES
     GRB Indicated?:     YES    [ by BAT flight software ]
     Image S/N Ratio:    8.12
     Image Trigger?:     NO
     Rate S/N Ratio:     12.4899959967968  [ if not an image trigger ]
     Image S/N Ratio:    8.12

  Analysis Position:   [ source = BAT ]
    RA: 314.22374452902   Dec: 53.2824925997842  [deg; J2000]

  Refined Position:   [ source = BAT pre-slew burst ]
    RA: 314.220410918838   Dec: 53.295278350025  [deg; J2000]
        { 20h 56m 52.9s , +53d 17' 43.0" }
         +/- 0.841851231597906 [arcmin] (estimated 90% radius based on SNR)
         +/- 0.352947761609905 [arcmin] (formal 1-sigma fit error)
    SNR: 38.8977983505519

  Angular difference between the analysis and refined position is 0.776407 arcmin

  Partial Coding Fraction: 0.5859375    [ including projection effects ]

  Duration
     T90: 39.0119999051094 +/- 7.25639468561777
        Measured from: -0.143999993801117
                   to: 38.8679999113083     [s; relative to TRIGTIME]
     T50: 12.3759999275208 +/- 1.7875166980481
        Measured from: 3.88400000333786
                   to: 16.2599999308586     [s; relative to TRIGTIME]


  Fluence
     Peak Flux  (peak 1 second)
        Measured from: 4.49199998378754
                   to: 5.49199998378754     [s; relative to TRIGTIME]
     Total Fluence
        Measured from: -2.67199999094009
                   to: 52.055999994278     [s; relative to TRIGTIME]

             Band 1     Band 2     Band 3     Band 4
              15-25      25-50     50-100    100-350     keV
 Total     0.658049   1.096268   0.850035   0.240980
           0.042941   0.044855   0.040129   0.034323 [error]
 Peak      0.044600   0.069012   0.063226   0.013176
           0.006796   0.007565   0.006953   0.005565 [error]

     [ fluence units of on-axis counts / fully illuminated detector ]

======================================================================


====== Table of the duration information =============================

        Value   tstart    tstop
T100   54.728   -2.672   52.056
T90    39.012   -0.144   38.868
T50    12.376    3.884   16.260
Peak    1.000    4.492    5.492


====== Spectral Analysis Summary =====================================

Model      : spectral model: simple power-law (PL) and cutoff power-law (CPL)
Ph_index   : photon index: E^{Ph_index}
Ph_90err   : 90% error of the photon index
Epeak      : Epeak in keV
Epeak_90err: 90% error of Epeak
Norm       : normalization at 50 keV in both the PL model and CPL model
Nomr_90err : 90% error of the normalization
chi2       : Chi-Squared
dof        : degree of freedo

=== Time-averaged spectral analysis ===
(Best model with acceptable fit: CPL)

Model Ph_index Ph_90err_low Ph_90err_hi  Epeak  Epeak_90err_low  Epeak_90err_hi  Norm       Nomr_90err_low    Norm_90err_hi    chi2    dof
PL      -1.356    -0.083      0.083       -           -               -         3.57e-03     -1.69e-04          1.69e-04      58.020   57
CPL     -0.847    -0.346      0.377      118.287     -29.863       131.463      6.30e-03     -1.98e-03          3.20e-03      51.490   56


=== 1-s peak spectral analysis ===
(Best model with acceptable fit: PL)

Model Ph_index Ph_90err_low Ph_90err_hi  Epeak  Epeak_90err_low  Epeak_90err_hi  Norm       Nomr_90err_low    Norm_90err_hi    chi2    dof
PL      -1.278     -0.189     0.191       -           -               -         1.29e-02     -1.49e-03          1.49e-03      61.380   57
CPL     -0.677     -0.685     0.963      110.133     -41.316      -110.133      2.61e-02     -1.41e-02          5.27e-02      59.710   56


=== Fluence/Peak Flux Summary ===

              Model    Band1     Band2     Band3     Band4     Band5     Total
                       15-25     25-50    50-100    100-350    15-150    15-350    keV
Fluence         PL   2.18e-07  4.38e-07  6.84e-07  2.36e-06  1.91e-06  3.70e-06   erg/cm2
      90%_error_low -1.90e-08 -2.31e-08 -3.99e-08 -2.90e-07 -9.86e-08 -3.18e-07   erg/cm2
      90%_error_hi   1.95e-08  2.30e-08  3.97e-08  3.17e-07  9.91e-08  3.41e-07   erg/cm2
Peak flux       PL   4.29e-01  4.93e-01  4.07e-01  5.63e-01  1.53e+00  1.89e+00   ph/cm2/s
      90%_error_low -8.54e-02 -6.37e-02 -5.59e-02 -1.43e-01 -1.79e-01 -2.27e-01   ph/cm2/s
      90%_error_hi   9.00e-02  6.29e-02  5.53e-02  1.71e-01  1.80e-01  2.31e-01   ph/cm2/s

Fluence        CPL   1.97e-07  4.58e-07  7.10e-07  1.18e-06  1.84e-06  2.54e-06   erg/cm2
      90%_error_low -2.31e-08 -2.70e-08 -4.44e-08 -4.08e-07 -1.11e-07 -4.16e-07   erg/cm2
      90%_error_hi   2.36e-08  2.75e-08  4.50e-08  6.79e-07  1.10e-07  6.73e-07   erg/cm2
Peak flux      CPL   3.88e-01  5.25e-01  4.28e-01  2.88e-01  1.50e+00  1.63e+00   ph/cm2/s
      90%_error_low -1.01e-01 -7.68e-02 -6.36e-02 -1.65e-01 -1.85e-01 -2.54e-01   ph/cm2/s
      90%_error_hi   1.04e-01  8.03e-02  6.57e-02  3.29e-01  1.84e-01  3.91e-01   ph/cm2/s

======================================================================
Image
Pre-slew 15.0-350.0 keV image (Event data)
#   RAcent    DECcent   POSerr    Theta     Phi              Peak Cts       SNR   Name
  314.2204    53.2953   0.0050    28.0762   141.1999         1.8206186     38.898 TRIG_00529606

Foreground time interval of the image:
 -2.672  10.853 (delta_t =  13.525 [sec])
Background time interval of the image:
-594.147 -498.933 (delta_t =  95.214 [sec])
-239.448  -2.672 (delta_t = 236.776 [sec])
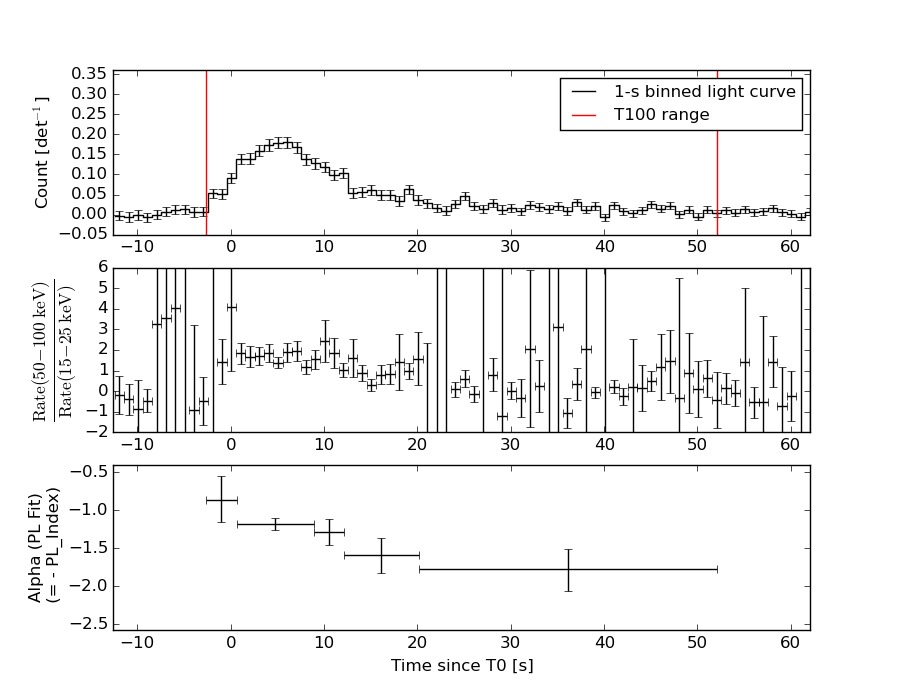
Light Curves
Note: The mask-weighted lightcurves have units of either count/det or counts/sec/det, where a det is 0.4 x 0.4 = 0.16 sq cm.
Full-time range; 1 s binning
Other quick-look light curves:
- 64 ms binning (zoomed)
- 16 ms binning (zoomed)
- 8 ms binning (zoomed)
- 2 ms binning (zoomed)
- SN=5 or 10 s binning (full-time range)
- Raw light curve
Spectra
- 64 ms binning (zoomed)
- 16 ms binning (zoomed)
- 8 ms binning (zoomed)
- 2 ms binning (zoomed)
- SN=5 or 10 s binning (full-time range)
- Raw light curve
Spectra
Notes:
- 1) The fitting includes the systematic errors.
- 2) When the burst includes telescope slew time periods, the fitting uses an average response file made from multiple 5-s response files through out the slew time plus single time preiod for the non-slew times, and weighted by the total counts in the corresponding time period using addrmf. An average response file is needed becuase a spectral fit using the pre-slew DRM will introduce some errors in both a spectral shape and a normalization if the PHA file contains a lot of the slew/post-slew time interval.
- 3) For fits to more complicated models (e.g. a power-law over a cutoff power-law), the BAT team has decided to require a chi-square improvement of more than 6 for each extra dof.
Time averaged spectrum fit using the average DRM
Power-law model
Time interval is from   -2.672 sec. to   52.056 sec.

Spectral model in power-law:
------------------------------------------------------------
Parameters  : value       lower 90%   higher 90%
Photon index: -1.35608     ( -0.0831225   0.0833385 )
Norm@50keV  : 3.57321E-03    ( -0.000168773   0.000168739 )
------------------------------------------------------------
#Fit statistic : Chi-Squared =          58.02 using 59 PHA bins.
# Reduced chi-squared =          1.018 for     57 degrees of freedom
# Null hypothesis probability =   4.373934e-01

Photon flux (15-150 keV)    in 54.73 sec: 0.431016 ( -0.021182  0.021218 ) ph/cm2/s
Energy fluence (15-150 keV)             : 1.90764e-06 ( -9.86492e-08  9.91242e-08 ) ergs/cm2
Cutoff power-law model
Time interval is from   -2.672 sec. to   52.056 sec.
Spectral model in the cutoff power-law:
------------------------------------------------------------
Parameters  : value       lower 90%   higher 90%
Photon index: -0.846591     ( -0.346317   0.377306 )
Epeak [keV] : 118.287      ( -29.8643 131.462 )
Norm@50keV  : 6.30305E-03    ( -0.00197686   0.00319991 )
------------------------------------------------------------
#Fit statistic : Chi-Squared =          51.49 using 59 PHA bins.
# Reduced chi-squared =         0.9195 for     56 degrees of freedom
# Null hypothesis probability =   6.459442e-01

Photon flux (15-150 keV)    in 54.73 sec: 0.419891 ( -0.022439  0.022445 ) ph/cm2/s
Energy fluence (15-150 keV)             : 1.83775e-06 ( -1.10773e-07  1.10328e-07 ) ergs/cm2
1-s peak spectrum fit
Power-law model

Time interval is from    4.492 sec. to    5.492 sec.

Spectral model in power-law:
------------------------------------------------------------
Parameters  : value       lower 90%   higher 90%
Photon index: -1.2781     ( -0.188847   0.190844 )
Norm@50keV  : 1.28997E-02    ( -0.00149229   0.00148949 )
------------------------------------------------------------
#Fit statistic : Chi-Squared =          61.38 using 59 PHA bins.
# Reduced chi-squared =          1.077 for     57 degrees of freedom
# Null hypothesis probability =   3.219324e-01

Photon flux (15-150 keV)    in 1 sec: 1.53295 ( -0.17945  0.17965 ) ph/cm2/s
Energy fluence (15-150 keV)             : 1.28183e-07 ( -1.64478e-08  1.65941e-08 ) ergs/cm2
Cutoff power-law model
Time interval is from    4.492 sec. to    5.492 sec.
Spectral model in the cutoff power-law:
------------------------------------------------------------
Parameters  : value       lower 90%   higher 90%
Photon index: -0.676509     ( -0.684619   0.962922 )
Epeak [keV] : 110.133      ( -41.3185 -110.135 )
Norm@50keV  : 2.61457E-02    ( -0.0141265   0.0527071 )
------------------------------------------------------------
#Fit statistic : Chi-Squared =          59.71 using 59 PHA bins.
# Reduced chi-squared =          1.066 for     56 degrees of freedom
# Null hypothesis probability =   3.422949e-01

Photon flux (15-150 keV)    in 1 sec: 1.50443 ( -0.18477  0.1841 ) ph/cm2/s
Energy fluence (15-150 keV)             : 1.22476e-07 ( -1.86252e-08  1.83848e-08 ) ergs/cm2
Time-resolved spectra
Distribution
T90 vs. Hardness ratio plot
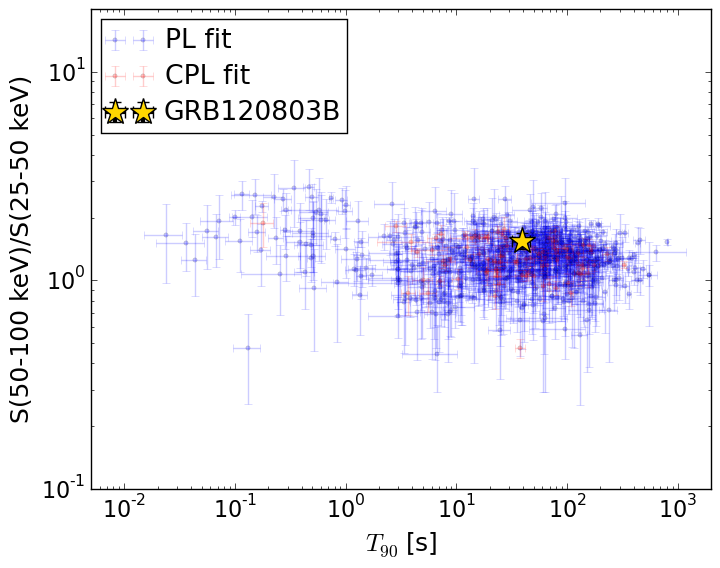
T90                                   = 39.012 sec.
Hardness ratio (energy fluence ratio) = 1.5513507867
S(15-50 keV) vs. S(50-150 keV) plot
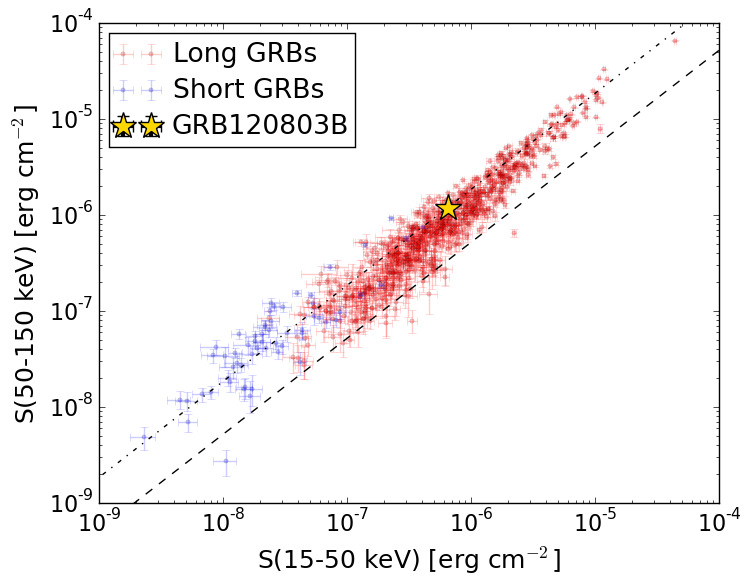
S(15-50 keV)  = 6.548382e-07
S(50-150 keV) = 1.1829291e-06
The dash-dotted line and the dashed line traces the fluences calculated from the Band function with Epeak = 15 and 150 keV, respectively. Both lines assume a canonical values of alpha = -1 and beta = -2.5.
Mask shadow pattern
IMX = -4.157109539910061E-01, IMY = -3.342416998680984E-01
Spacecraft aspect plot
Bright source in the pre-burst/pre-slew/post-slew images
Pre-burst image of 15-350 keV band
Time interval of the image:
-594.147380 -498.933500
-239.448000 -2.672000

# RAcent  DECcent POSerr Theta    Phi  PeakCts   SNR AngSep     Name
#  [deg]    [deg]    ['] [deg]  [deg]                   [']
308.1476  40.9679    2.4  40.1  132.5   2.8999   4.8    1.9	Cyg X-3
326.0154  38.3832   11.5  34.9  111.1  -0.5102  -1.0    8.2	Cyg X-2
 79.4888  36.3134    3.8  50.7  -44.5   4.0345   3.0 ------	UNKNOWN
Pre-slew background subtracted image of 15-350 keV band
Time interval of the image:
-2.672000 10.852600

# RAcent  DECcent POSerr Theta    Phi  PeakCts   SNR AngSep     Name
#  [deg]    [deg]    ['] [deg]  [deg]                   [']
308.0158  40.8175   18.5  40.3  132.4  -0.0639  -0.6    9.2	Cyg X-3
326.3443  38.4330   74.7  34.8  110.7   0.0138   0.2   10.5	Cyg X-2
314.2204  53.2953    0.3  28.1  141.2   1.8202  38.9 ------	UNKNOWN
117.4192  65.6928    2.1  40.9  -95.0   0.7750   5.5 ------	UNKNOWN
Post-slew image of 15-350 keV band
Time interval of the image:
59.452600 228.452600

# RAcent  DECcent POSerr Theta    Phi  PeakCts   SNR AngSep     Name
#  [deg]    [deg]    ['] [deg]  [deg]                   [']
254.5619  35.4492    4.7  44.7 -178.7  -0.5776  -2.5    8.2	Her X-1
299.6233  35.2301    1.2  20.8  125.4   1.3738   9.4    2.4	Cyg X-1
308.1465  40.9675    1.1  13.0  110.8   1.4306  10.5    1.9	Cyg X-3
325.9662  38.2426    4.7  17.1   57.0   0.3570   2.5   10.8	Cyg X-2
265.7856  17.2918    3.0  51.9  155.1   2.5901   3.8 ------	UNKNOWN
240.8943  29.3230    2.5  57.2 -173.8   3.0801   4.6 ------	UNKNOWN
228.9446  36.7436    4.3  58.7 -159.2   2.8841   2.7 ------	UNKNOWN