Analysis Summary
Notes:
- 1) No attempt has been made to eliminate the non-significant decimal places.
- 2) This batgrbproduct analysis is done using the HEASARC data.
- 3) This batgrbproduct analysis is using the flight position for the mask-weighting calculation.
======================================================================
                  BAT GRB EVENT DATA PROCESSING REPORT
    Process Script Ver: batgrbproduct v2.46
    Process Start Time: Mon Jan 13 02:08:11 EST 2014
             Host Name: batevent1
   Current Working Dir: /local/data/batevent/batevent_reproc/trigger529686
======================================================================

  Trigger: 00529686      Segment: 000

  BAT Trigger Time: 365734463.936   [s; MET]
      Trigger Stop: 365734464   [s; MET]
               UTC: 2012-08-04T00:54:14.437420    [includes UTCF correction]
       Where From?: (*SHORT BURST*) TDRSS scaled map message

  BAT
    RA: 233.929598045314   Dec: -28.7609483594276  [deg; J2000]

     Catalogged Source?: NO
     Point Source?:      YES
     GRB Indicated?:     YES    [ by BAT flight software ]
     Image S/N Ratio:    10.68
     Image Trigger?:     NO
     Rate S/N Ratio:     33.3466640010661  [ if not an image trigger ]
     Image S/N Ratio:    10.68

  Analysis Position:   [ source = BAT ]
    RA: 233.929598045314   Dec: -28.7609483594276  [deg; J2000]

  Refined Position:   [ source = BAT pre-slew burst ]
    RA: 233.950428989018   Dec: -28.7682038279128  [deg; J2000]
        { 15h 35m 48.1s , -28d 46' 05.5" }
         +/- 1.01181040655455 [arcmin] (estimated 90% radius based on SNR)
         +/- 0.352910897598455 [arcmin] (formal 1-sigma fit error)
    SNR: 29.9112037808232

  Angular difference between the analysis and refined position is 1.178947 arcmin

  Partial Coding Fraction: 0.2402344    [ including projection effects ]

  Duration
     T90: 0.807999968528748 +/- 0.0832345620352619
        Measured from: -0.0799999833106995
                   to: 0.727999985218048     [s; relative to TRIGTIME]
     T50: 0.351999938488007 +/- 0.0282842864203588
        Measured from: 0.0879999995231628
                   to: 0.439999938011169     [s; relative to TRIGTIME]


  Fluence
     Peak Flux  (peak 1 second)
        Measured from: -0.163999974727631
                   to: 0.836000025272369     [s; relative to TRIGTIME]
     Total Fluence
        Measured from: -0.163999974727631
                   to: 0.832000017166138     [s; relative to TRIGTIME]

             Band 1     Band 2     Band 3     Band 4
              15-25      25-50     50-100    100-350     keV
 Total     0.264145   0.446751   0.419487   0.106487
           0.017573   0.020170   0.019068   0.012641 [error]
 Peak      0.265216   0.447379   0.419467   0.105924
           0.017589   0.020185   0.019088   0.012653 [error]

     [ fluence units of on-axis counts / fully illuminated detector ]

======================================================================


====== Table of the duration information =============================

        Value   tstart    tstop
T100    0.996   -0.164    0.832
T90     0.808   -0.080    0.728
T50     0.352    0.088    0.440
Peak    1.000   -0.164    0.836


====== Spectral Analysis Summary =====================================

Model      : spectral model: simple power-law (PL) and cutoff power-law (CPL)
Ph_index   : photon index: E^{Ph_index}
Ph_90err   : 90% error of the photon index
Epeak      : Epeak in keV
Epeak_90err: 90% error of Epeak
Norm       : normalization at 50 keV in both the PL model and CPL model
Nomr_90err : 90% error of the normalization
chi2       : Chi-Squared
dof        : degree of freedo

=== Time-averaged spectral analysis ===
(Best model with acceptable fit: PL)

Model Ph_index Ph_90err_low Ph_90err_hi  Epeak  Epeak_90err_low  Epeak_90err_hi  Norm       Nomr_90err_low    Norm_90err_hi    chi2    dof
PL      -1.339    -0.082      0.082       -           -               -         9.00e-02     -4.35e-03          4.35e-03      59.650   57
CPL     -0.972    -0.322      0.346      156.107     -50.158       562.258      1.33e-01     -3.79e-02          5.73e-02      55.830   56


=== 1-s peak spectral analysis ===
(Best model with acceptable fit: PL)

Model Ph_index Ph_90err_low Ph_90err_hi  Epeak  Epeak_90err_low  Epeak_90err_hi  Norm       Nomr_90err_low    Norm_90err_hi    chi2    dof
PL      -1.343     -0.082     0.082       -           -               -         8.97e-02     -4.33e-03          4.33e-03      59.030   57
CPL     -0.979     -0.322     0.346      156.158     -50.415       592.591      1.32e-01     -3.77e-02          5.71e-02      55.270   56


=== Fluence/Peak Flux Summary ===

              Model    Band1     Band2     Band3     Band4     Band5     Total
                       15-25     25-50    50-100    100-350    15-150    15-350    keV
Fluence         PL   9.84e-08  2.00e-07  3.16e-07  1.11e-06  8.78e-07  1.72e-06   erg/cm2
      90%_error_low -8.78e-09 -1.10e-08 -1.80e-08 -1.32e-07 -4.53e-08 -1.45e-07   erg/cm2
      90%_error_hi   9.04e-09  1.10e-08  1.79e-08  1.43e-07  4.54e-08  1.53e-07   erg/cm2
Peak flux       PL   3.18e+00  3.51e+00  2.77e+00  3.60e+00  1.08e+01  1.31e+01   ph/cm2/s
      90%_error_low -2.88e-01 -1.99e-01 -1.54e-01 -4.00e-01 -5.51e-01 -6.38e-01   ph/cm2/s
      90%_error_hi   2.97e-01  1.98e-01  1.53e-01  4.28e-01  5.52e-01  6.39e-01   ph/cm2/s

Fluence        CPL   9.07e-08  2.06e-07  3.29e-07  6.99e-07  8.66e-07  1.32e-06   erg/cm2
      90%_error_low -1.08e-08 -1.24e-08 -2.14e-08 -2.20e-07 -4.72e-08 -2.20e-07   erg/cm2
      90%_error_hi   1.11e-08  1.26e-08  2.17e-08  3.47e-07  4.70e-08  3.41e-07   erg/cm2
Peak flux      CPL   2.91e+00  3.60e+00  2.89e+00  2.55e+00  1.06e+01  1.20e+01   ph/cm2/s
      90%_error_low -3.59e-01 -2.18e-01 -1.89e-01 -6.54e-01 -5.67e-01 -8.92e-01   ph/cm2/s
      90%_error_hi   3.68e-01  2.20e-01  1.92e-01  9.35e-01  5.68e-01  1.08e+00   ph/cm2/s

======================================================================
Image
Pre-slew 15.0-350.0 keV image (Event data)
#   RAcent    DECcent   POSerr    Theta     Phi              Peak Cts       SNR   Name
  233.9504   -28.7682   0.0064    42.3520   -47.0202         1.3267173     29.911 TRIG_00529686

Foreground time interval of the image:
 -0.164   0.832 (delta_t =   0.996 [sec])
Background time interval of the image:
-239.936  -0.164 (delta_t = 239.772 [sec])
Light Curves
Note: The mask-weighted lightcurves have units of either count/det or counts/sec/det, where a det is 0.4 x 0.4 = 0.16 sq cm.
Full-time range; 1 s binning
Other quick-look light curves:
- 64 ms binning (zoomed)
- 16 ms binning (zoomed)
- 8 ms binning (zoomed)
- 2 ms binning (zoomed)
- SN=5 or 10 s binning (full-time range)
- Raw light curve
Spectra
- 64 ms binning (zoomed)
- 16 ms binning (zoomed)
- 8 ms binning (zoomed)
- 2 ms binning (zoomed)
- SN=5 or 10 s binning (full-time range)
- Raw light curve
Spectra
Notes:
- 1) The fitting includes the systematic errors.
- 2) When the burst includes telescope slew time periods, the fitting uses an average response file made from multiple 5-s response files through out the slew time plus single time preiod for the non-slew times, and weighted by the total counts in the corresponding time period using addrmf. An average response file is needed becuase a spectral fit using the pre-slew DRM will introduce some errors in both a spectral shape and a normalization if the PHA file contains a lot of the slew/post-slew time interval.
- 3) For fits to more complicated models (e.g. a power-law over a cutoff power-law), the BAT team has decided to require a chi-square improvement of more than 6 for each extra dof.
Time averaged spectrum fit using the average DRM
Power-law model
Time interval is from   -0.164 sec. to    0.832 sec.

Spectral model in power-law:
------------------------------------------------------------
Parameters  : value       lower 90%   higher 90%
Photon index: -1.339     ( -0.0817444   0.0818753 )
Norm@50keV  : 8.99961E-02    ( -0.00434592   0.00434591 )
------------------------------------------------------------
#Fit statistic : Chi-Squared =          59.65 using 59 PHA bins.
# Reduced chi-squared =          1.047 for     57 degrees of freedom
# Null hypothesis probability =   3.795115e-01

Photon flux (15-150 keV)    in 0.996 sec: 10.8179 ( -0.5523  0.5532 ) ph/cm2/s
Energy fluence (15-150 keV)             : 8.77747e-07 ( -4.52947e-08  4.53969e-08 ) ergs/cm2
Cutoff power-law model

Time interval is from   -0.164 sec. to    0.832 sec.
Spectral model in the cutoff power-law:
------------------------------------------------------------
Parameters  : value       lower 90%   higher 90%
Photon index: -0.971965     ( -0.321933   0.346363 )
Epeak [keV] : 156.107      ( -50.1575 562.258 )
Norm@50keV  : 0.133118    ( -0.0378823   0.057304 )
------------------------------------------------------------
#Fit statistic : Chi-Squared =          55.83 using 59 PHA bins.
# Reduced chi-squared =         0.9970 for     56 degrees of freedom
# Null hypothesis probability =   4.812850e-01

Photon flux (15-150 keV)    in 0.996 sec: 10.6583 ( -0.5685  0.5695 ) ph/cm2/s
Energy fluence (15-150 keV)             : 8.65625e-07 ( -4.71799e-08  4.70151e-08 ) ergs/cm2
1-s peak spectrum fit
Power-law model
Time interval is from   -0.164 sec. to    0.836 sec.

Spectral model in power-law:
------------------------------------------------------------
Parameters  : value       lower 90%   higher 90%
Photon index: -1.34272     ( -0.0818164   0.08193 )
Norm@50keV  : 8.97295E-02    ( -0.00433422   0.00433422 )
------------------------------------------------------------
#Fit statistic : Chi-Squared =          59.03 using 59 PHA bins.
# Reduced chi-squared =          1.036 for     57 degrees of freedom
# Null hypothesis probability =   4.010888e-01

Photon flux (15-150 keV)    in 1 sec: 10.7939 ( -0.5511  0.552 ) ph/cm2/s
Energy fluence (15-150 keV)             : 8.7791e-07 ( -4.53223e-08  4.54478e-08 ) ergs/cm2
Cutoff power-law model
Time interval is from   -0.164 sec. to    0.836 sec.
Spectral model in the cutoff power-law:
------------------------------------------------------------
Parameters  : value       lower 90%   higher 90%
Photon index: -0.978508     ( -0.321917   0.346331 )
Epeak [keV] : 156.158      ( -50.4157 592.59 )
Norm@50keV  : 0.132373    ( -0.0376984   0.0570547 )
------------------------------------------------------------
#Fit statistic : Chi-Squared =          55.27 using 59 PHA bins.
# Reduced chi-squared =         0.9870 for     56 degrees of freedom
# Null hypothesis probability =   5.023678e-01

Photon flux (15-150 keV)    in 1 sec: 10.6356 ( -0.5674  0.5682 ) ph/cm2/s
Energy fluence (15-150 keV)             : 8.65785e-07 ( -4.7226e-08  4.70872e-08 ) ergs/cm2
Time-resolved spectra
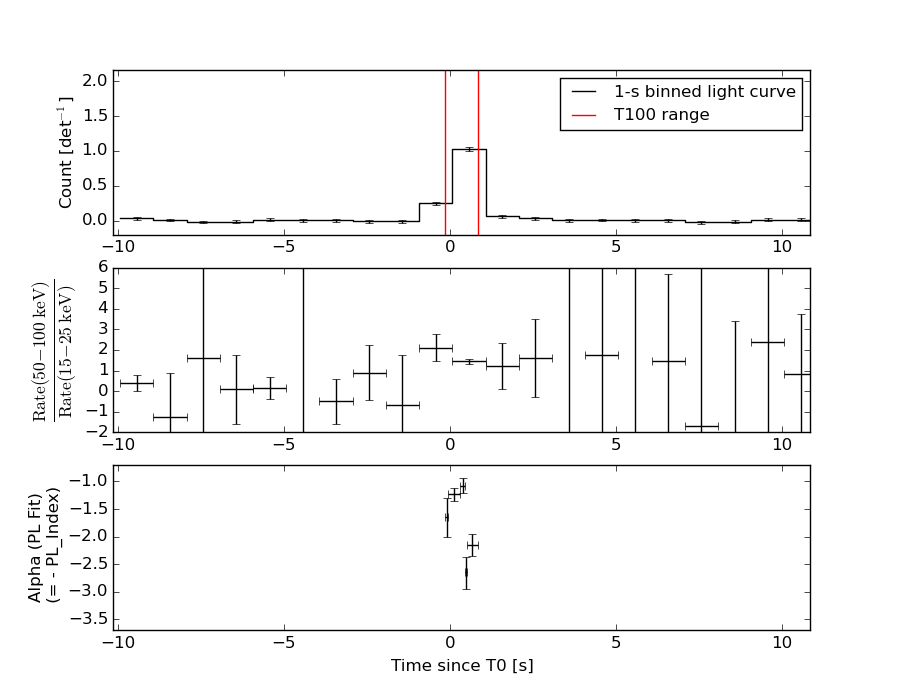
Distribution
T90 vs. Hardness ratio plot
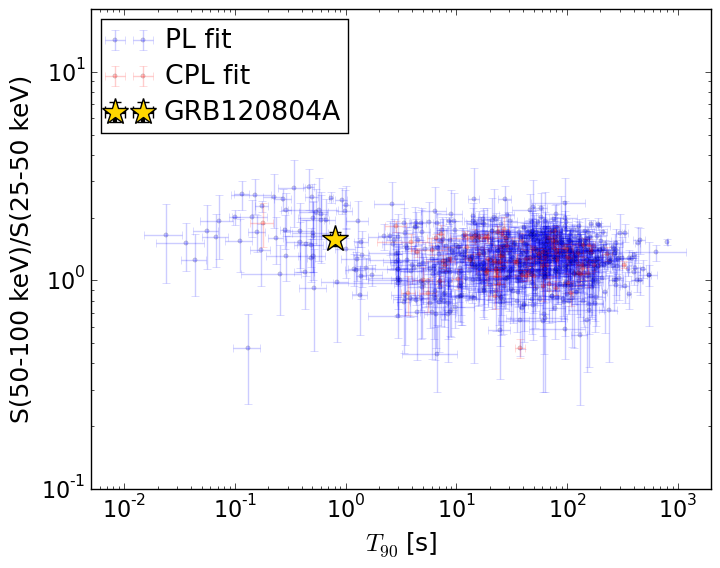
T90                                   = 0.808 sec.
Hardness ratio (energy fluence ratio) = 1.58121148797
S(15-50 keV) vs. S(50-150 keV) plot
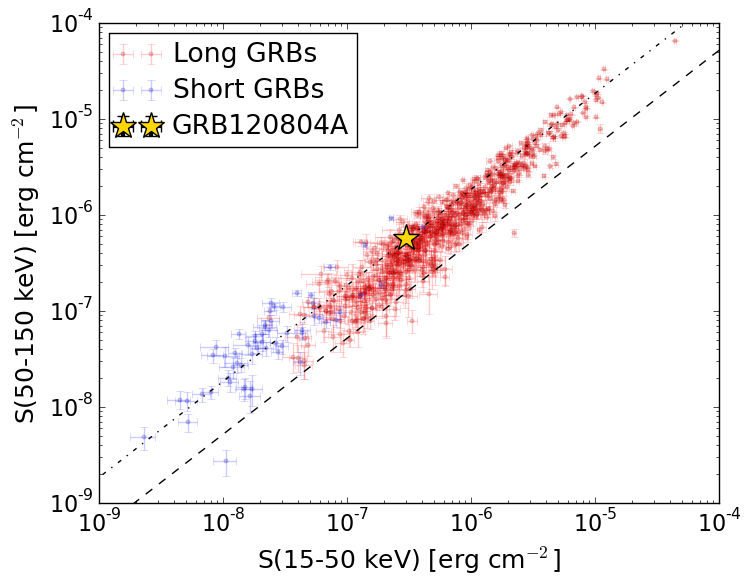
S(15-50 keV)  = 2.9808942e-07
S(50-150 keV) = 5.796605e-07
The dash-dotted line and the dashed line traces the fluences calculated from the Band function with Epeak = 15 and 150 keV, respectively. Both lines assume a canonical values of alpha = -1 and beta = -2.5.
Mask shadow pattern
IMX = 6.214673431926222E-01, IMY = 6.669133243108158E-01
Spacecraft aspect plot
Bright source in the pre-burst/pre-slew/post-slew images
Pre-burst image of 15-350 keV band
Time interval of the image:
-239.936000 -0.164000

# RAcent  DECcent POSerr Theta    Phi  PeakCts   SNR AngSep     Name
#  [deg]    [deg]    ['] [deg]  [deg]                   [']
244.9874 -15.6293    0.4  41.0  -22.0   8.0807  26.5    0.8	Sco X-1
256.0050 -37.7935   16.6  22.1  -52.5   0.1442   0.7    3.2	4U 1700-377
256.4310 -36.4383    2.9  22.0  -48.8   0.7880   3.9    0.9	GX 349+2
262.8469 -24.6675    4.2  22.4  -14.0   0.5355   2.8   10.0	GX 1+4
264.7196 -44.4757   19.1  15.9  -74.6   0.1277   0.6    1.8	4U 1735-44
268.4544  -1.3680    9.6  39.3   20.7   0.3639   1.2    7.3	SW J1753.5-0127
270.2156 -25.0843    2.0  17.4   -0.6   1.0894   5.7    3.7	GX 5-1
270.5259 -25.7651    8.2  16.7   -1.4   0.2695   1.4   12.1	GRS 1758-258
274.0674 -14.1014    4.2  25.4   22.8   0.5580   2.7    5.3	GX 17+2
275.7100 -30.3302    3.3  10.3    1.0   0.6444   3.5   11.3	H1820-303
284.9768 -24.7642    7.9  13.2   49.5   0.2719   1.5    9.9	HT1900.1-2455
262.9226 -33.6936   57.0  17.6  -36.7   0.0405   0.2    9.1	GX 354-0
288.6251  -1.9638    3.0  36.2   53.6   1.5253   3.9 ------	UNKNOWN
331.5754 -49.8569    3.4  35.6  171.2   0.9718   3.4 ------	UNKNOWN
296.7919 -46.9074    2.5  13.0 -176.1   0.8384   4.6 ------	UNKNOWN
Pre-slew background subtracted image of 15-350 keV band
Time interval of the image:
-0.164000 0.832000

# RAcent  DECcent POSerr Theta    Phi  PeakCts   SNR AngSep     Name
#  [deg]    [deg]    ['] [deg]  [deg]                   [']
245.0479 -15.4815    5.9  41.0  -21.8  -0.0447  -2.0   10.3	Sco X-1
256.0820 -37.6775    6.0  22.0  -52.2  -0.0341  -1.9   11.0	4U 1700-377
256.2741 -36.4886    5.0  22.1  -49.0  -0.0407  -2.3    8.7	GX 349+2
263.1133 -24.6363   10.0  22.2  -13.5  -0.0161  -1.2    8.7	GX 1+4
264.8929 -44.4850    5.9  15.8  -74.7   0.0308   2.0    6.8	4U 1735-44
268.2932  -1.4845    8.2  39.2   20.4   0.0306   1.4    4.9	SW J1753.5-0127
270.2456 -25.2650   19.8  17.2   -0.9   0.0084   0.6   11.3	GX 5-1
270.1291 -25.7765 2700.0  16.9   -2.3   0.0000   0.0    9.6	GRS 1758-258
273.9360 -13.9007    5.9  25.6   22.6   0.0289   2.0    9.1	GX 17+2
276.1685 -30.3818    0.0  10.0    2.6  -0.0163  -1.2   12.6	H1820-303
284.9767 -25.0731    5.5  12.8   49.6   0.0294   2.1    9.7	HT1900.1-2455
263.0445 -33.9770    6.1  17.4  -37.5   0.0278   1.9    9.0	GX 354-0
233.9504 -28.7682    0.4  42.4  -47.0   1.3268  29.9 ------	UNKNOWN
239.6601 -80.8995    2.3  45.9 -125.2   0.4080   5.1 ------	UNKNOWN
Post-slew image of 15-350 keV band
Time interval of the image:
77.364590 933.764610

# RAcent  DECcent POSerr Theta    Phi  PeakCts   SNR AngSep     Name
#  [deg]    [deg]    ['] [deg]  [deg]                   [']
170.4383 -60.4294    4.8  52.3 -156.9   5.3854   2.4   12.2	Cen X-3
186.6775 -62.7928    0.6  45.6 -162.7  29.5356  18.3    1.5	GX 301-2
244.9792 -15.6325    0.1  16.6   29.3  59.1010  89.9    0.5	Sco X-1
255.9035 -37.9892   17.6  20.4  111.7   0.5117   0.7    9.6	4U 1700-377
256.2504 -36.4809    3.4  20.2  107.4   2.7988   3.4    9.6	GX 349+2
262.8800 -24.6123    5.6  26.1   76.9   2.0913   2.0   10.7	GX 1+4
264.7969 -44.5768    4.9  29.1  120.5  -2.4740  -2.4    8.0	4U 1735-44
268.4921  -1.6075    3.3  42.7   45.9   6.0156   3.5   11.9	SW J1753.5-0127
270.2272 -25.0821    3.4  32.4   81.4   4.5341   3.4    3.1	GX 5-1
270.3821 -25.7087    3.2  32.4   82.6   4.8865   3.6    4.8	GRS 1758-258
274.1242 -13.9508  228.9  40.0   66.1  -0.1297  -0.1    8.6	GX 17+2
275.8595 -30.5015    9.2  36.2   92.5   2.5452   1.3    8.8	H1820-303
262.9902 -33.8170  143.3  25.2   98.1  -0.0764  -0.1    1.1	GX 354-0
255.3930 -21.0571    3.0  20.9   62.4   3.2021   3.8 ------	UNKNOWN
252.8170 -40.2012    2.5  19.2  120.7   3.3042   4.6 ------	UNKNOWN
205.5682 -41.4223    3.3  26.3 -137.2   2.6643   3.5 ------	UNKNOWN