Analysis Summary
Notes:
- 1) No attempt has been made to eliminate the non-significant decimal places.
- 2) This batgrbproduct analysis is done using the HEASARC data.
- 3) This batgrbproduct analysis is using the flight position for the mask-weighting calculation.
======================================================================
BAT GRB EVENT DATA PROCESSING REPORT
Process Script Ver: batgrbproduct v2.46
Process Start Time: Mon Jan 13 02:02:10 EST 2014
Host Name: batevent1
Current Working Dir: /local/data/batevent/batevent_reproc/trigger530031
======================================================================
Trigger: 00530031 Segment: 000
BAT Trigger Time: 365894899.392 [s; MET]
Trigger Stop: 365894907.584 [s; MET]
UTC: 2012-08-05T21:28:09.886740 [includes UTCF correction]
Where From?: TDRSS position message
BAT
RA: 216.533341737596 Dec: 5.80233114541574 [deg; J2000]
Catalogged Source?: NO
Point Source?: YES
GRB Indicated?: YES [ by BAT flight software ]
Image S/N Ratio: 8.44
Image Trigger?: NO
Rate S/N Ratio: 8.18535277187245 [ if not an image trigger ]
Image S/N Ratio: 8.44
Analysis Position: [ source = BAT ]
RA: 216.533341737596 Dec: 5.80233114541574 [deg; J2000]
Refined Position: [ source = BAT pre-slew burst ]
RA: 216.535850685373 Dec: 5.85246087633791 [deg; J2000]
{ 14h 26m 08.6s , +05d 51' 08.9" }
+/- 2.12347681179799 [arcmin] (estimated 90% radius based on SNR)
+/- 0.753481091534828 [arcmin] (formal 1-sigma fit error)
SNR: 10.3730777475377
Angular difference between the analysis and refined position is 3.011510 arcmin
Partial Coding Fraction: 0.3789062 [ including projection effects ]
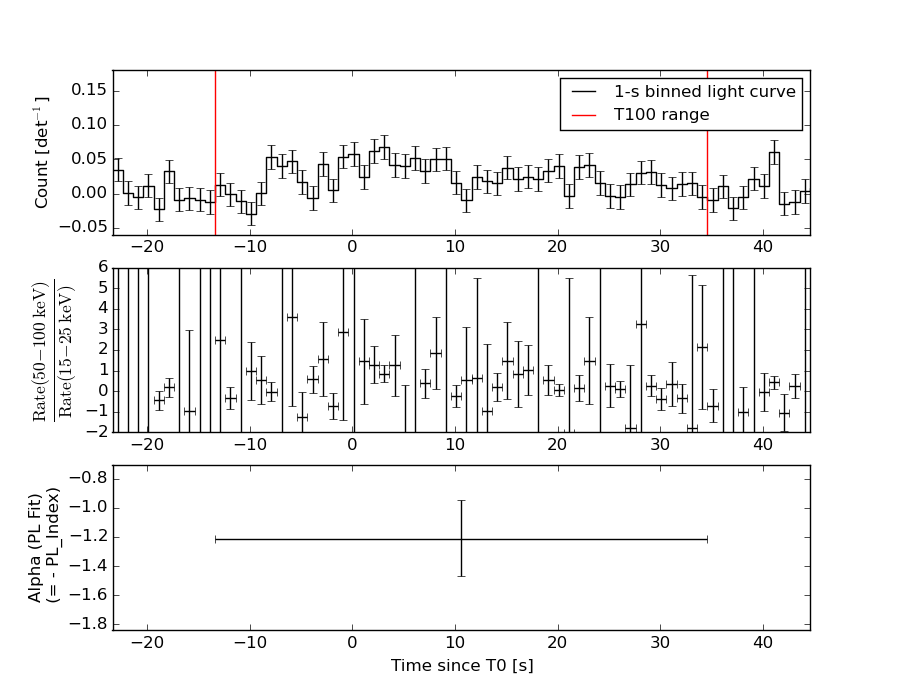
Duration
T90: 48 +/- 22.6274169979695
Measured from: -13.3920000195503
to: 34.6079999804497 [s; relative to TRIGTIME]
T50: 32 +/- 16
Measured from: -13.3920000195503
to: 18.6079999804497 [s; relative to TRIGTIME]
Fluence
Peak Flux (peak 1 second)
Measured from: 10.1079999804497
to: 11.1079999804497 [s; relative to TRIGTIME]
Total Fluence
Measured from: -13.3920000195503
to: 34.6079999804497 [s; relative to TRIGTIME]
Band 1 Band 2 Band 3 Band 4
15-25 25-50 50-100 100-350 keV
Total 0.122604 0.486728 0.382732 0.154389
0.069091 0.062391 0.055052 0.048611 [error]
Peak 0.005921 0.007939 0.009432 -0.007827
0.009939 0.008788 0.007851 0.006976 [error]
[ fluence units of on-axis counts / fully illuminated detector ]
======================================================================
====== Table of the duration information =============================
Value tstart tstop
T100 48.000 -13.392 34.608
T90 48.000 -13.392 34.608
T50 32.000 -13.392 18.608
Peak 1.000 10.108 11.108
====== Spectral Analysis Summary =====================================
Model : spectral model: simple power-law (PL) and cutoff power-law (CPL)
Ph_index : photon index: E^{Ph_index}
Ph_90err : 90% error of the photon index
Epeak : Epeak in keV
Epeak_90err: 90% error of Epeak
Norm : normalization at 50 keV in both the PL model and CPL model
Nomr_90err : 90% error of the normalization
chi2 : Chi-Squared
dof : degree of freedo
=== Time-averaged spectral analysis ===
(Best model with acceptable fit: PL)
Model Ph_index Ph_90err_low Ph_90err_hi Epeak Epeak_90err_low Epeak_90err_hi Norm Nomr_90err_low Norm_90err_hi chi2 dof
PL -1.213 -0.258 0.269 - - - 1.73e-03 -2.69e-04 2.68e-04 64.070 57
CPL -0.183 -1.107 1.518 94.805 -29.798 -94.805 5.27e-03 -5.27e-03 2.04e-02 61.630 56
=== 1-s peak spectral analysis ===
(Best model with acceptable fit: N/A)
Model Ph_index Ph_90err_low Ph_90err_hi Epeak Epeak_90err_low Epeak_90err_hi Norm Nomr_90err_low Norm_90err_hi chi2 dof
PL -1.758 1.758 1.758 - - - 1.30e-03 -1.30e-03 1.81e-03 48.090 57
CPL 0.359 N/A N/A 53.416 N/A N/A 1.71e-02 N/A N/A 47.610 56
=== Fluence/Peak Flux Summary ===
Model Band1 Band2 Band3 Band4 Band5 Total
15-25 25-50 50-100 100-350 15-150 15-350 keV
Fluence PL 8.12e-08 1.78e-07 3.07e-07 1.23e-06 8.41e-07 1.79e-06 erg/cm2
90%_error_low -2.37e-08 -3.36e-08 -5.24e-08 -4.06e-07 -1.34e-07 -4.43e-07 erg/cm2
90%_error_hi 2.63e-08 3.30e-08 5.19e-08 5.35e-07 1.35e-07 5.48e-07 erg/cm2
Peak flux PL 6.06e-02 5.70e-02 3.74e-02 3.51e-02 1.72e-01 1.91e-01 ph/cm2/s
90%_error_low -6.06e-02 -5.70e-02 -3.74e-02 -3.51e-02 -1.72e-01 -1.91e-01 ph/cm2/s
90%_error_hi 1.42e-01 7.95e-02 5.88e-02 5.70e-01 2.35e-01 2.59e-01 ph/cm2/s
Fluence CPL 6.49e-08 1.92e-07 3.32e-07 3.76e-07 7.86e-07 9.65e-07 erg/cm2
90%_error_low -2.74e-08 -3.88e-08 -6.11e-08 N/A -1.51e-07 -2.95e-07 erg/cm2
90%_error_hi 3.11e-08 4.05e-08 6.32e-08 N/A 1.50e-07 1.14e-06 erg/cm2
Peak flux CPL 6.34e-02 1.24e-01 1.73e-03 7.48e-09 1.45e-01 1.45e-01 ph/cm2/s
90%_error_low -6.34e-02 -1.24e-01 -1.73e-03 -7.48e-09 -1.45e-01 -1.45e-01 ph/cm2/s
90%_error_hi 1.34e-01 1.06e-01 1.09e-01 6.84e-02 2.27e-01 2.27e-01 ph/cm2/s
======================================================================
Image
Pre-slew 15.0-350.0 keV image (Event data)
#   RAcent    DECcent   POSerr    Theta     Phi              Peak Cts       SNR   Name
  216.5359     5.8525   0.0185    38.4594   -46.5122         1.3109695     10.373 TRIG_00530031

Foreground time interval of the image:
-13.392  34.608 (delta_t =  48.000 [sec])
Background time interval of the image:
-239.392 -13.392 (delta_t = 226.000 [sec])
Light Curves
Note: The mask-weighted lightcurves have units of either count/det or counts/sec/det, where a det is 0.4 x 0.4 = 0.16 sq cm.
Full-time range; 1 s binning
Other quick-look light curves:
- 64 ms binning (zoomed)
- 16 ms binning (zoomed)
- 8 ms binning (zoomed)
- 2 ms binning (zoomed)
- SN=5 or 10 s binning (full-time range)
- Raw light curve
Spectra
- 64 ms binning (zoomed)
- 16 ms binning (zoomed)
- 8 ms binning (zoomed)
- 2 ms binning (zoomed)
- SN=5 or 10 s binning (full-time range)
- Raw light curve
Spectra
Notes:
- 1) The fitting includes the systematic errors.
- 2) When the burst includes telescope slew time periods, the fitting uses an average response file made from multiple 5-s response files through out the slew time plus single time preiod for the non-slew times, and weighted by the total counts in the corresponding time period using addrmf. An average response file is needed becuase a spectral fit using the pre-slew DRM will introduce some errors in both a spectral shape and a normalization if the PHA file contains a lot of the slew/post-slew time interval.
- 3) For fits to more complicated models (e.g. a power-law over a cutoff power-law), the BAT team has decided to require a chi-square improvement of more than 6 for each extra dof.
Time averaged spectrum fit using the average DRM
Power-law model
Time interval is from  -13.392 sec. to   34.608 sec.

Spectral model in power-law:
------------------------------------------------------------
Parameters  : value       lower 90%   higher 90%
Photon index: -1.21311     ( -0.258123   0.26947 )
Norm@50keV  : 1.73226E-03    ( -0.000269435   0.000268486 )
------------------------------------------------------------
#Fit statistic : Chi-Squared =          64.07 using 59 PHA bins.
# Reduced chi-squared =          1.124 for     57 degrees of freedom
# Null hypothesis probability =   2.423831e-01

Photon flux (15-150 keV)    in 48 sec: 0.203720 ( -0.033551  0.033928 ) ph/cm2/s
Energy fluence (15-150 keV)             : 8.40566e-07 ( -1.34312e-07  1.351e-07 ) ergs/cm2
Cutoff power-law model
Time interval is from  -13.392 sec. to   34.608 sec.
Spectral model in the cutoff power-law:
------------------------------------------------------------
Parameters  : value       lower 90%   higher 90%
Photon index: -0.182646     ( -1.10672   1.51802 )
Epeak [keV] : 94.8047      ( -29.8049 -94.8111 )
Norm@50keV  : 5.26964E-03    ( -0.00526847   0.0203842 )
------------------------------------------------------------
#Fit statistic : Chi-Squared =          61.63 using 59 PHA bins.
# Reduced chi-squared =          1.101 for     56 degrees of freedom
# Null hypothesis probability =   2.816174e-01

Photon flux (15-150 keV)    in 48 sec: 0.194061 ( -0.034836  0.035385 ) ph/cm2/s
Energy fluence (15-150 keV)             : 7.86379e-07 ( -1.51266e-07  1.49762e-07 ) ergs/cm2
1-s peak spectrum fit
Power-law model
Time interval is from   10.108 sec. to   11.108 sec.

Spectral model in power-law:
------------------------------------------------------------
Parameters  : value       lower 90%   higher 90%
Photon index: -1.75848     ( 1.52642   1.52642 )
Norm@50keV  : 1.30162E-03    ( -0.00130165   0.0018086 )
------------------------------------------------------------
#Fit statistic : Chi-Squared =          48.09 using 59 PHA bins.
# Reduced chi-squared =         0.8437 for     57 degrees of freedom
# Null hypothesis probability =   7.935663e-01

Photon flux (15-150 keV)    in 1 sec: 0.172455 ( -0.172455  0.235072 ) ph/cm2/s
Energy fluence (15-150 keV)             : 1.22079e-08 ( 1  1.79596e-08 ) ergs/cm2
Cutoff power-law model
Time interval is from   10.108 sec. to   11.108 sec.
Spectral model in the cutoff power-law:
------------------------------------------------------------
Parameters  : value       lower 90%   higher 90%
Photon index: 9.98648     (       )
Epeak [keV] : 30.8463      (   )
Norm@50keV  : 1.51565E+05    (     )
------------------------------------------------------------
#Fit statistic : Chi-Squared =          46.88 using 59 PHA bins.
# Reduced chi-squared =         0.8371 for     56 degrees of freedom
# Null hypothesis probability =   8.023039e-01

Photon flux (15-150 keV)    in 1 sec: 0.145123 ( -0.145123  0.226798 ) ph/cm2/s
Energy fluence (15-150 keV)             : 1.09853e-08 ( 1  1.78119e-08 ) ergs/cm2
Time-resolved spectra
Distribution
T90 vs. Hardness ratio plot
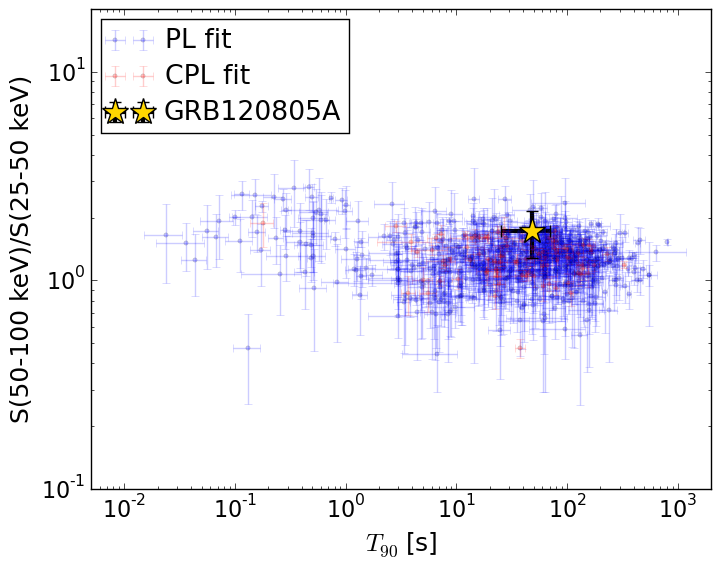
T90                                   = 48.0 sec.
Hardness ratio (energy fluence ratio) = 1.72532159897
S(15-50 keV) vs. S(50-150 keV) plot
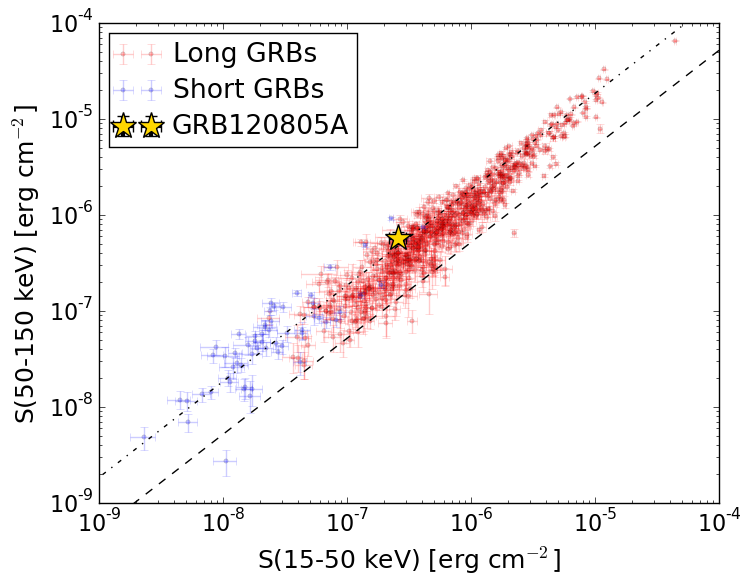
S(15-50 keV)  = 2.5914559e-07
S(50-150 keV) = 5.814318e-07
The dash-dotted line and the dashed line traces the fluences calculated from the Band function with Epeak = 15 and 150 keV, respectively. Both lines assume a canonical values of alpha = -1 and beta = -2.5.
Mask shadow pattern
IMX = 5.466238681313339E-01, IMY = 5.762675584740097E-01
Spacecraft aspect plot
Bright source in the pre-burst/pre-slew/post-slew images
Pre-burst image of 15-350 keV band
Time interval of the image:
-239.392000 -13.392000

# RAcent  DECcent POSerr Theta    Phi  PeakCts   SNR AngSep     Name
#  [deg]    [deg]    ['] [deg]  [deg]                   [']
170.3226 -60.6305   83.0  52.4 -164.3   0.0935   0.1    0.5	Cen X-3
186.6381 -62.8095    1.8  45.6 -169.9   2.8671   6.5    2.4	GX 301-2
244.9804 -15.6446    0.2  16.6   22.2  14.3390  63.7    0.3	Sco X-1
256.0681 -37.8201    1.8  20.5  104.0   1.7272   6.5    4.1	4U 1700-377
256.4292 -36.4896    9.5  20.4  100.1   0.3354   1.2    4.0	GX 349+2
263.1700 -24.7930    4.1  26.3   70.3   0.8600   2.8    9.2	GX 1+4
264.9509 -44.4097   11.7  29.1  112.9  -0.3555  -1.0    9.2	4U 1735-44
268.2412  -1.5405    8.3  42.5   38.5   0.7656   1.4    9.3	SW J1753.5-0127
270.2374 -25.0486    6.6  32.5   74.2   0.7019   1.8    3.1	GX 5-1
270.1695 -25.8361   41.0  32.2   75.6   0.1111   0.3    9.1	GRS 1758-258
274.0293 -14.0609    4.8  39.9   59.1   1.6167   2.4    2.0	GX 17+2
275.9063 -30.4888   18.9  36.3   85.4   0.3838   0.6    7.4	H1820-303
263.1664 -33.7855    8.6  25.4   90.9  -0.4029  -1.3    9.3	GX 354-0
264.4516  16.8604    2.8  54.3   18.8   5.0232   4.2 ------	UNKNOWN
264.4196  16.6141    2.4  54.1   18.9   5.9731   4.9 ------	UNKNOWN
235.2937  21.9655    2.4  50.8  -16.3   2.3622   4.7 ------	UNKNOWN
Pre-slew background subtracted image of 15-350 keV band
Time interval of the image:
-13.392000 34.608000

# RAcent  DECcent POSerr Theta    Phi  PeakCts   SNR AngSep     Name
#  [deg]    [deg]    ['] [deg]  [deg]                   [']
170.1098 -60.7937  324.4  52.5 -164.4   0.0073   0.0   11.9	Cen X-3
186.4422 -62.7259    3.7  45.6 -169.8  -0.4400  -3.2    6.5	GX 301-2
244.8387 -15.5845    5.0  16.6   21.7   0.1764   2.3    8.8	Sco X-1
255.8121 -37.8495    5.1  20.3  104.2   0.2157   2.3    8.3	4U 1700-377
256.4479 -36.5574    6.2  20.4  100.3   0.1791   1.9    8.1	GX 349+2
262.8526 -24.6141   77.0  26.1   69.7  -0.0167  -0.2   11.6	GX 1+4
264.6827 -44.4152    7.1  29.0  113.1  -0.2005  -1.6    3.3	4U 1735-44
268.3645  -1.3096    5.5  42.8   38.4   0.4238   2.1    8.6	SW J1753.5-0127
270.3353 -25.1172    7.7  32.5   74.3   0.2405   1.5    3.6	GX 5-1
270.2417 -25.6845   15.8  32.3   75.3  -0.1200  -0.7    4.8	GRS 1758-258
273.8939 -13.9082    3.8  39.8   58.8  -0.7300  -3.1   10.1	GX 17+2
276.0474 -30.2620    4.2  36.5   85.0  -0.6370  -2.8    8.9	H1820-303
262.9924 -33.7739   10.7  25.3   90.9   0.1246   1.1    3.6	GX 354-0
216.5358   5.8525    1.1  38.5  -46.5   1.3111  10.4 ------	UNKNOWN
Post-slew image of 15-350 keV band
Time interval of the image:
106.908590 362.738000

# RAcent  DECcent POSerr Theta    Phi  PeakCts   SNR AngSep     Name
#  [deg]    [deg]    ['] [deg]  [deg]                   [']
244.9932 -15.6524    2.0  35.4  111.9  14.8073   5.7    1.1	Sco X-1
254.4664  35.3335   29.5  45.7   28.8   1.0722   0.4    0.7	Her X-1
247.3798  55.2397    2.2  55.2    5.1  24.6099   5.2 ------	UNKNOWN
227.2499  49.7405    2.9  44.9   -5.9   6.9688   4.0 ------	UNKNOWN
218.9175  51.1876    2.9  45.4  -13.6   8.1123   3.9 ------	UNKNOWN
190.2927  30.3502    3.4  34.8  -57.7   5.8592   3.4 ------	UNKNOWN