Analysis Summary
Notes:
- 1) No attempt has been made to eliminate the non-significant decimal places.
- 2) This batgrbproduct analysis is done using the HEASARC data.
- 3) This batgrbproduct analysis is using the flight position for the mask-weighting calculation.
======================================================================
BAT GRB EVENT DATA PROCESSING REPORT
Process Script Ver: batgrbproduct v2.46
Process Start Time: Mon Jan 13 01:56:06 EST 2014
Host Name: batevent1
Current Working Dir: /local/data/batevent/batevent_reproc/trigger530267
======================================================================
Trigger: 00530267 Segment: 000
BAT Trigger Time: 366016187.264 [s; MET]
Trigger Stop: 366016188.288 [s; MET]
UTC: 2012-08-07T07:09:37.753700 [includes UTCF correction]
Where From?: TDRSS position message
BAT
RA: 241.210902101014 Dec: -47.4899662888597 [deg; J2000]
Catalogged Source?: NO
Point Source?: YES
GRB Indicated?: YES [ by BAT flight software ]
Image S/N Ratio: 7.03
Image Trigger?: NO
Rate S/N Ratio: 10.3923048454133 [ if not an image trigger ]
Image S/N Ratio: 7.03
Analysis Position: [ source = BAT ]
RA: 241.210902101014 Dec: -47.4899662888597 [deg; J2000]
Refined Position: [ source = BAT pre-slew burst ]
RA: 241.290202566376 Dec: -47.4601856405004 [deg; J2000]
{ 16h 05m 09.6s , -47d 27' 36.7" }
+/- 2.02585498317881 [arcmin] (estimated 90% radius based on SNR)
+/- 1.06402588874266 [arcmin] (formal 1-sigma fit error)
SNR: 11.0944670755058
Angular difference between the analysis and refined position is 3.679058 arcmin
Partial Coding Fraction: 0.890625 [ including projection effects ]
Duration
T90: 19.8839999437332 +/- 5.7625414379985
Measured from: 0.791999995708466
to: 20.6759999394417 [s; relative to TRIGTIME]
T50: 7.63199990987778 +/- 5.38687739219413
Measured from: 1.45200002193451
to: 9.08399993181229 [s; relative to TRIGTIME]
Fluence
Peak Flux (peak 1 second)
Measured from: 0.65200001001358
to: 1.65200001001358 [s; relative to TRIGTIME]
Total Fluence
Measured from: -0.244000017642975
to: 24.1560000181198 [s; relative to TRIGTIME]
Band 1 Band 2 Band 3 Band 4
15-25 25-50 50-100 100-350 keV
Total 0.219643 0.178756 0.134917 0.034403
0.031961 0.026887 0.022506 0.019498 [error]
Peak 0.038195 0.044978 0.019678 0.000510
0.006869 0.005872 0.004812 0.004018 [error]
[ fluence units of on-axis counts / fully illuminated detector ]
======================================================================
====== Table of the duration information =============================
Value tstart tstop
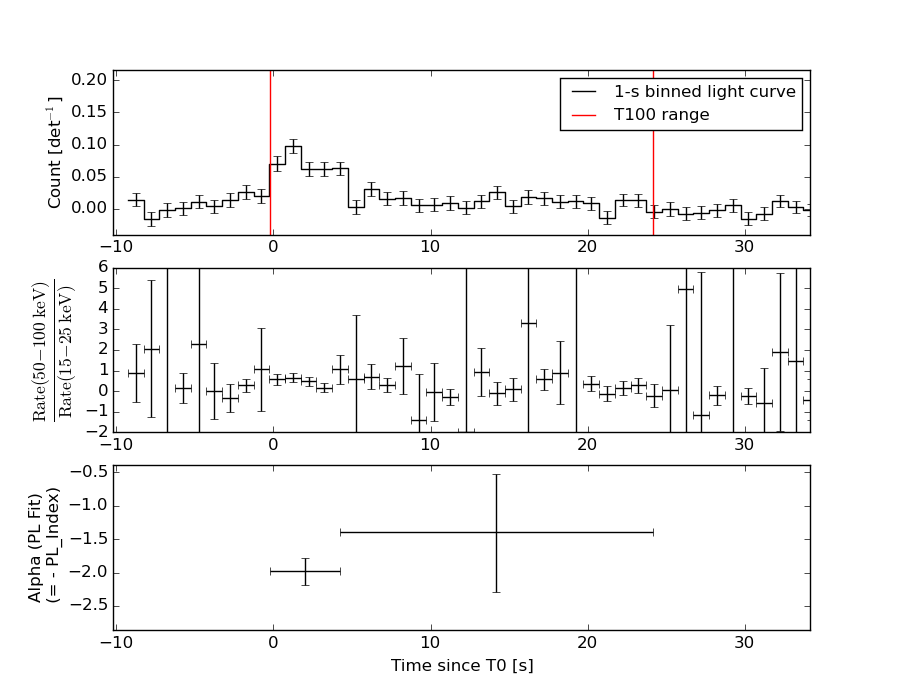
T100 24.400 -0.244 24.156
T90 19.884 0.792 20.676
T50 7.632 1.452 9.084
Peak 1.000 0.652 1.652
====== Spectral Analysis Summary =====================================
Model : spectral model: simple power-law (PL) and cutoff power-law (CPL)
Ph_index : photon index: E^{Ph_index}
Ph_90err : 90% error of the photon index
Epeak : Epeak in keV
Epeak_90err: 90% error of Epeak
Norm : normalization at 50 keV in both the PL model and CPL model
Nomr_90err : 90% error of the normalization
chi2 : Chi-Squared
dof : degree of freedo
=== Time-averaged spectral analysis ===
(Best model with acceptable fit: PL)
Model Ph_index Ph_90err_low Ph_90err_hi Epeak Epeak_90err_low Epeak_90err_hi Norm Nomr_90err_low Norm_90err_hi chi2 dof
PL -1.825 -0.312 0.299 - - - 1.30e-03 -2.31e-04 2.23e-04 44.370 57
CPL -1.837 -0.303 0.744 9999.350 -9999.340 -9999.350 1.29e-03 -2.21e-04 1.85e-03 44.380 56
=== 1-s peak spectral analysis ===
(Best model with acceptable fit: PL)
Model Ph_index Ph_90err_low Ph_90err_hi Epeak Epeak_90err_low Epeak_90err_hi Norm Nomr_90err_low Norm_90err_hi chi2 dof
PL -2.027 -0.312 0.289 - - - 5.65e-03 -1.18e-03 1.15e-03 65.750 57
CPL -0.141 -1.474 2.237 40.165 -13.743 14.482 7.00e-02 -7.00e-02 1.47e+00 60.470 56
=== Fluence/Peak Flux Summary ===
Model Band1 Band2 Band3 Band4 Band5 Total
15-25 25-50 50-100 100-350 15-150 15-350 keV
Fluence PL 5.51e-08 8.31e-08 9.38e-08 2.01e-07 2.92e-07 4.33e-07 erg/cm2
90%_error_low -1.33e-08 -1.26e-08 -2.28e-08 -8.64e-08 -5.11e-08 -1.10e-07 erg/cm2
90%_error_hi 1.41e-08 1.25e-08 2.30e-08 1.24e-07 5.24e-08 1.40e-07 erg/cm2
Peak flux PL 3.87e-01 2.85e-01 1.40e-01 9.77e-02 8.58e-01 9.10e-01 ph/cm2/s
90%_error_low -8.99e-02 -4.81e-02 -3.69e-02 -4.15e-02 -1.46e-01 -1.53e-01 ph/cm2/s
90%_error_hi 9.47e-02 4.81e-02 3.80e-02 5.72e-02 1.46e-01 1.54e-01 ph/cm2/s
Fluence CPL 5.35e-08 7.13e-08 7.01e-08 2.03e-07 2.96e-07 4.28e-07 erg/cm2
90%_error_low -1.54e-08 -1.97e-08 -3.49e-08 -8.47e-08 -6.39e-08 -1.53e-07 erg/cm2
90%_error_hi 1.54e-08 1.95e-08 2.26e-08 1.23e-07 5.82e-08 1.09e-07 erg/cm2
Peak flux CPL 3.20e-01 3.44e-01 1.30e-01 1.30e-02 8.05e-01 8.06e-01 ph/cm2/s
90%_error_low -1.05e-01 -6.59e-02 -5.24e-02 -1.30e-02 -1.48e-01 -1.49e-01 ph/cm2/s
90%_error_hi 1.09e-01 7.02e-02 4.83e-02 4.79e-02 1.50e-01 1.53e-01 ph/cm2/s
======================================================================
Image
Pre-slew 15.0-350.0 keV image (Event data)
#   RAcent    DECcent   POSerr    Theta     Phi              Peak Cts       SNR   Name
  241.2902   -47.4602   0.0173    19.5375   149.0987         0.4517674     11.094 TRIG_00530267

Foreground time interval of the image:
 -0.244  12.637 (delta_t =  12.881 [sec])
Background time interval of the image:
-239.264  -0.244 (delta_t = 239.020 [sec])
Light Curves
Note: The mask-weighted lightcurves have units of either count/det or counts/sec/det, where a det is 0.4 x 0.4 = 0.16 sq cm.
Full-time range; 1 s binning
Other quick-look light curves:
- 64 ms binning (zoomed)
- 16 ms binning (zoomed)
- 8 ms binning (zoomed)
- 2 ms binning (zoomed)
- SN=5 or 10 s binning (full-time range)
- Raw light curve
Spectra
- 64 ms binning (zoomed)
- 16 ms binning (zoomed)
- 8 ms binning (zoomed)
- 2 ms binning (zoomed)
- SN=5 or 10 s binning (full-time range)
- Raw light curve
Spectra
Notes:
- 1) The fitting includes the systematic errors.
- 2) When the burst includes telescope slew time periods, the fitting uses an average response file made from multiple 5-s response files through out the slew time plus single time preiod for the non-slew times, and weighted by the total counts in the corresponding time period using addrmf. An average response file is needed becuase a spectral fit using the pre-slew DRM will introduce some errors in both a spectral shape and a normalization if the PHA file contains a lot of the slew/post-slew time interval.
- 3) For fits to more complicated models (e.g. a power-law over a cutoff power-law), the BAT team has decided to require a chi-square improvement of more than 6 for each extra dof.
Time averaged spectrum fit using the average DRM
Power-law model
Time interval is from   -0.244 sec. to   24.156 sec.

Spectral model in power-law:
------------------------------------------------------------
Parameters  : value       lower 90%   higher 90%
Photon index: -1.82529     ( -0.31229   0.298745 )
Norm@50keV  : 1.30289E-03    ( -0.000230868   0.000222634 )
------------------------------------------------------------
#Fit statistic : Chi-Squared =          44.37 using 59 PHA bins.
# Reduced chi-squared =         0.7785 for     57 degrees of freedom
# Null hypothesis probability =   8.887101e-01

Photon flux (15-150 keV)    in 24.4 sec: 0.181336 ( -0.027796  0.02793 ) ph/cm2/s
Energy fluence (15-150 keV)             : 2.9249e-07 ( -5.11331e-08  5.2431e-08 ) ergs/cm2
Cutoff power-law model

Time interval is from   -0.244 sec. to   24.156 sec.
Spectral model in the cutoff power-law:
------------------------------------------------------------
Parameters  : value       lower 90%   higher 90%
Photon index: -1.83664     ( -0.306072   0.740713 )
Epeak [keV] : 9999.35      ( -9999.35 -9999.36 )
Norm@50keV  : 1.29426E-03    ( -0.000228141   0.00184823 )
------------------------------------------------------------
#Fit statistic : Chi-Squared =          44.38 using 59 PHA bins.
# Reduced chi-squared =         0.7925 for     56 degrees of freedom
# Null hypothesis probability =   8.687406e-01

Photon flux (15-150 keV)    in 24.4 sec: 0.152258 ( -0.043999  0.041123 ) ph/cm2/s
Energy fluence (15-150 keV)             : 2.9555e-07 ( -6.39173e-08  5.82355e-08 ) ergs/cm2
1-s peak spectrum fit
Power-law model
Time interval is from    0.652 sec. to    1.652 sec.

Spectral model in power-law:
------------------------------------------------------------
Parameters  : value       lower 90%   higher 90%
Photon index: -2.02688     ( -0.311714   0.289388 )
Norm@50keV  : 5.64993E-03    ( -0.00117672   0.00115127 )
------------------------------------------------------------
#Fit statistic : Chi-Squared =          65.75 using 59 PHA bins.
# Reduced chi-squared =          1.153 for     57 degrees of freedom
# Null hypothesis probability =   1.997191e-01

Photon flux (15-150 keV)    in 1 sec: 0.858213 ( -0.14554  0.145737 ) ph/cm2/s
Energy fluence (15-150 keV)             : 5.21915e-08 ( -1.00345e-08  1.03358e-08 ) ergs/cm2
Cutoff power-law model
Time interval is from    0.652 sec. to    1.652 sec.
Spectral model in the cutoff power-law:
------------------------------------------------------------
Parameters  : value       lower 90%   higher 90%
Photon index: -0.140907     ( -1.47534   2.23559 )
Epeak [keV] : 40.1650      ( -13.7404 14.4844 )
Norm@50keV  : 6.99725E-02    ( -0.0701784   1.47088 )
------------------------------------------------------------
#Fit statistic : Chi-Squared =          60.47 using 59 PHA bins.
# Reduced chi-squared =          1.080 for     56 degrees of freedom
# Null hypothesis probability =   3.175968e-01

Photon flux (15-150 keV)    in 1 sec: 0.804802 ( -0.14841  0.149938 ) ph/cm2/s
Energy fluence (15-150 keV)             : 4.51263e-08 ( -9.54515e-09  1.09656e-08 ) ergs/cm2
Time-resolved spectra
Distribution
T90 vs. Hardness ratio plot
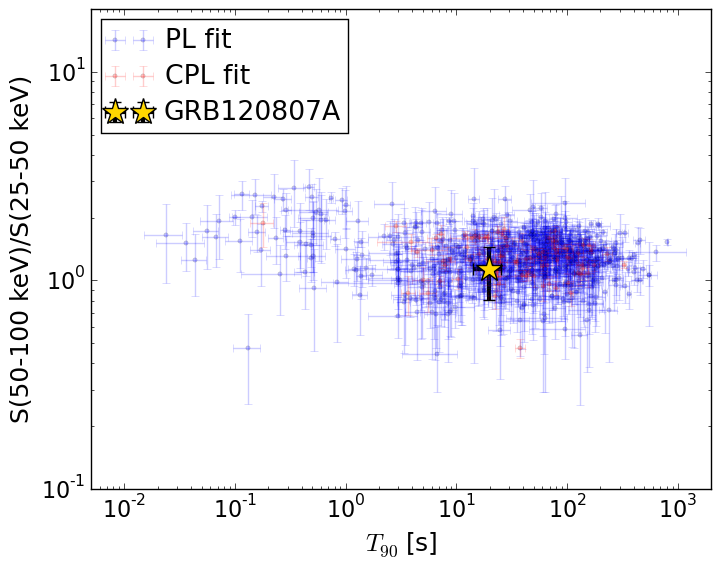
T90                                   = 19.884 sec.
Hardness ratio (energy fluence ratio) = 1.12878173642
S(15-50 keV) vs. S(50-150 keV) plot
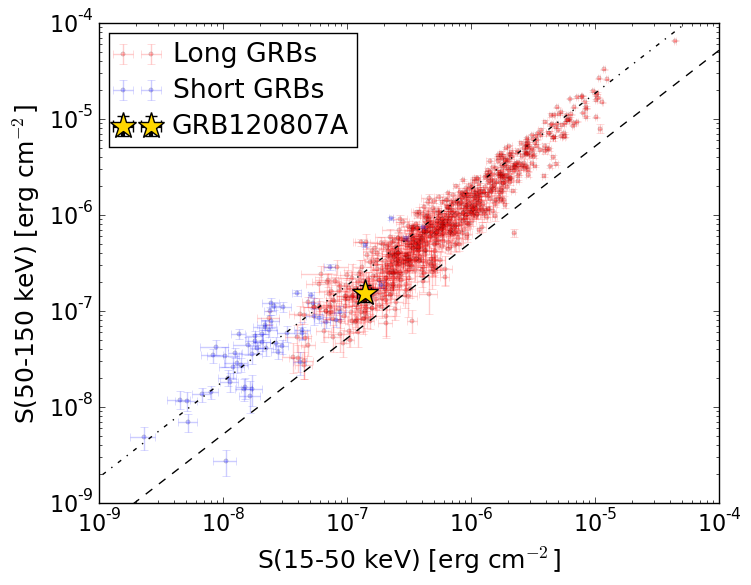
S(15-50 keV)  = 1.3826379e-07
S(50-150 keV) = 1.5422457e-07
The dash-dotted line and the dashed line traces the fluences calculated from the Band function with Epeak = 15 and 150 keV, respectively. Both lines assume a canonical values of alpha = -1 and beta = -2.5.
Mask shadow pattern
IMX = -3.044848519053462E-01, IMY = -1.822395329684092E-01
Spacecraft aspect plot
Bright source in the pre-burst/pre-slew/post-slew images
Pre-burst image of 15-350 keV band
Time interval of the image:
-239.264000 -0.244000

# RAcent  DECcent POSerr Theta    Phi  PeakCts   SNR AngSep     Name
#  [deg]    [deg]    ['] [deg]  [deg]                   [']
170.4041 -60.7131    5.1  52.3 -162.3   1.6886   2.3    6.0	Cen X-3
186.5401 -62.7477    3.8  45.6 -167.7   1.7018   3.0    3.5	GX 301-2
244.9786 -15.6425    0.1  16.6   24.3  24.8259  89.9    0.1	Sco X-1
255.9837 -37.7575    3.0  20.4  105.9   1.2572   3.8    5.2	4U 1700-377
256.2633 -36.2747    0.0  20.2  101.6  -0.2951  -0.9   12.2	GX 349+2
262.9906 -24.7827    4.4  26.2   72.2   1.0439   2.6    2.4	GX 1+4
264.7386 -44.5859    4.8  29.1  115.4   1.0276   2.4    8.2	4U 1735-44
268.2660  -1.3435    3.3  42.7   40.4   2.4547   3.5    9.0	SW J1753.5-0127
270.4403 -25.0325    8.6  32.6   76.3   0.7105   1.3    8.9	GX 5-1
270.1465 -25.7921    3.9  32.2   77.5   1.5492   2.9    8.9	GRS 1758-258
274.0255 -13.9137   22.0  40.0   60.9   0.4388   0.5    7.5	GX 17+2
275.7655 -30.4921    9.5  36.2   87.4  -0.9084  -1.2   11.2	H1820-303
262.8080 -33.8637    8.0  25.1   93.1   0.5365   1.4    9.2	GX 354-0
240.7205 -82.6055    3.2  53.9  163.0   4.9898   3.6 ------	UNKNOWN
241.2443  10.0934    2.4  39.5   -4.5   2.0127   4.7 ------	UNKNOWN
195.2566 -57.9097    2.1  39.5 -164.4   2.1053   5.4 ------	UNKNOWN
228.7359  -1.9950    2.6  27.2  -27.3   1.3176   4.4 ------	UNKNOWN
179.7788 -52.2397    3.3  46.0 -152.2   2.0378   3.5 ------	UNKNOWN
206.8832  10.4552    3.9  47.1  -53.5   4.6801   3.0 ------	UNKNOWN
206.5912  10.0983    2.9  47.0  -54.1   6.4233   4.1 ------	UNKNOWN
Pre-slew background subtracted image of 15-350 keV band
Time interval of the image:
-0.244000 12.636630

# RAcent  DECcent POSerr Theta    Phi  PeakCts   SNR AngSep     Name
#  [deg]    [deg]    ['] [deg]  [deg]                   [']
170.2256 -60.6819   20.4  52.4 -162.3  -0.0556  -0.6    4.4	Cen X-3
186.5315 -62.9504    5.3  45.7 -168.0   0.1445   2.2   11.3	GX 301-2
244.9929 -15.6580    1.4  16.6   24.3  -0.2997  -8.2    1.3	Sco X-1
256.0497 -37.8748    4.5  20.5  106.2  -0.1156  -2.6    3.5	4U 1700-377
256.4800 -36.2837    4.7  20.4  101.5   0.1051   2.4    8.6	GX 349+2
262.9629 -24.6058    7.1  26.2   71.8  -0.0878  -1.6    8.8	GX 1+4
264.7062 -44.4221    3.6  29.0  115.1   0.1767   3.2    2.3	4U 1735-44
268.5043  -1.6275    0.0  42.7   40.9  -0.2652  -2.6   13.3	SW J1753.5-0127
270.1857 -24.9762   10.6  32.4   76.1  -0.0740  -1.1    8.2	GX 5-1
270.1383 -25.7683   32.9  32.2   77.5   0.0242   0.3    9.0	GRS 1758-258
273.8631 -14.0882    8.3  39.7   61.0  -0.1723  -1.4    8.9	GX 17+2
276.1049 -30.4082    9.4  36.5   87.3   0.1322   1.2    9.6	H1820-303
263.1048 -33.9706   30.4  25.4   93.4  -0.0201  -0.4   10.0	GX 354-0
271.7030 -79.7487    2.3  53.3  156.3   1.0048   5.1 ------	UNKNOWN
258.7419   3.5677    2.1  40.2   24.6   0.3796   5.5 ------	UNKNOWN
241.2902 -47.4602    1.0  19.5  149.1   0.4534  11.1 ------	UNKNOWN
188.5147 -55.7589    2.0  41.9 -159.0   0.3190   5.7 ------	UNKNOWN
195.1624 -50.1753    2.6  36.2 -153.1   0.2164   4.4 ------	UNKNOWN
Post-slew image of 15-350 keV band
Time interval of the image:
55.636610 962.816000

# RAcent  DECcent POSerr Theta    Phi  PeakCts   SNR AngSep     Name
#  [deg]    [deg]    ['] [deg]  [deg]                   [']
170.1944 -60.5053   34.9  41.4 -136.6   0.5019   0.3    7.9	Cen X-3
186.4969 -62.6834    2.8  33.5 -138.5   3.8340   4.1    6.8	GX 301-2
244.9797 -15.6394    0.2  32.0    5.6  52.5848  71.8    0.0	Sco X-1
256.0101 -37.8575    1.7  14.5   52.6   3.9555   6.8    1.4	4U 1700-377
256.3775 -36.4034    3.2  15.8   49.6   2.2531   3.5    3.0	GX 349+2
262.9370 -24.7339    6.0  28.5   43.5   1.5495   1.9    4.0	GX 1+4
264.7875 -44.4945    9.4  16.6   87.1   0.8754   1.2    3.3	4U 1735-44
270.3320 -25.0911    8.3  32.1   54.8   1.4364   1.4    2.7	GX 5-1
270.1792 -25.8545    4.6  31.4   55.5   2.5384   2.5    9.4	GRS 1758-258
273.9026 -13.9200    8.5  43.2   48.8   2.7919   1.4    9.2	GX 17+2
275.8466 -30.3453    6.0  31.6   68.4   1.9853   1.9    4.3	H1820-303
262.7710 -33.7248    0.0  21.3   56.3   1.2870   1.8   12.7	GX 354-0
255.4363 -35.9357    2.1  15.6   46.4   3.2993   5.4 ------	UNKNOWN
250.0787 -16.4078    3.2  31.9   15.0   2.5635   3.6 ------	UNKNOWN
249.3796 -14.1147    2.7  34.1   13.0   3.2407   4.2 ------	UNKNOWN
205.2842 -11.3873    3.5  47.0  -53.1  11.1407   3.4 ------	UNKNOWN
162.5846 -53.1592    3.8  47.9 -128.9   9.9976   3.1 ------	UNKNOWN