Analysis Summary
Notes:
- 1) No attempt has been made to eliminate the non-significant decimal places.
- 2) This batgrbproduct analysis is done using the HEASARC data.
- 3) This batgrbproduct analysis is using the flight position for the mask-weighting calculation.
======================================================================
                  BAT GRB EVENT DATA PROCESSING REPORT
    Process Script Ver: batgrbproduct v2.46
    Process Start Time: Mon Jan 13 01:50:28 EST 2014
             Host Name: batevent1
   Current Working Dir: /local/data/batevent/batevent_reproc/trigger530581
======================================================================

  Trigger: 00530581      Segment: 000

  BAT Trigger Time: 366345328.448   [s; MET]
      Trigger Stop: 366345329.472   [s; MET]
               UTC: 2012-08-11T02:35:18.923980    [includes UTCF correction]
       Where From?: TDRSS position message

  BAT
    RA: 257.18263991766   Dec: -22.7358138782081  [deg; J2000]

     Catalogged Source?: YES
     Point Source?:      YES
     GRB Indicated?:     NO    [ by BAT flight software ]
     Image S/N Ratio:    7.05
     Image Trigger?:     NO
     Rate S/N Ratio:     10.2469507659596  [ if not an image trigger ]
     Image S/N Ratio:    7.05

  Analysis Position:   [ source = BAT ]
    RA: 257.18263991766   Dec: -22.7358138782081  [deg; J2000]

  Refined Position:   [ source = BAT pre-slew burst ]
    RA: 257.17947119836   Dec: -22.7233681892249  [deg; J2000]
        { 17h 08m 43.1s , -22d 43' 24.1" }
         +/- 1.37791621551423 [arcmin] (estimated 90% radius based on SNR)
         +/- 0.631614799157089 [arcmin] (formal 1-sigma fit error)
    SNR: 19.2410447641108

  Angular difference between the analysis and refined position is 0.767055 arcmin

  Partial Coding Fraction: 0.984375    [ including projection effects ]

  Duration
     T90: 29.0080000758171 +/- 4.93882578064389
        Measured from: -11.5760000348091
                   to: 17.432000041008     [s; relative to TRIGTIME]
     T50: 10.176000058651 +/- 2.17464663064374
        Measured from: -3.65600001811981
                   to: 6.52000004053116     [s; relative to TRIGTIME]


  Fluence
     Peak Flux  (peak 1 second)
        Measured from: 0.427999973297119
                   to: 1.42799997329712     [s; relative to TRIGTIME]
     Total Fluence
        Measured from: -14.1999999880791
                   to: 22.1840000152588     [s; relative to TRIGTIME]

             Band 1     Band 2     Band 3     Band 4
              15-25      25-50     50-100    100-350     keV
 Total     0.570805   0.534398   0.295289   0.087234
           0.035646   0.031922   0.026555   0.022150 [error]
 Peak      0.050098   0.043567   0.024974  -0.000757
           0.006113   0.005699   0.004543   0.003844 [error]

     [ fluence units of on-axis counts / fully illuminated detector ]

======================================================================


====== Table of the duration information =============================

        Value   tstart    tstop
T100   36.384  -14.200   22.184
T90    29.008  -11.576   17.432
T50    10.176   -3.656    6.520
Peak    1.000    0.428    1.428


====== Spectral Analysis Summary =====================================

Model      : spectral model: simple power-law (PL) and cutoff power-law (CPL)
Ph_index   : photon index: E^{Ph_index}
Ph_90err   : 90% error of the photon index
Epeak      : Epeak in keV
Epeak_90err: 90% error of Epeak
Norm       : normalization at 50 keV in both the PL model and CPL model
Nomr_90err : 90% error of the normalization
chi2       : Chi-Squared
dof        : degree of freedo

=== Time-averaged spectral analysis ===
(Best model with acceptable fit: PL)

Model Ph_index Ph_90err_low Ph_90err_hi  Epeak  Epeak_90err_low  Epeak_90err_hi  Norm       Nomr_90err_low    Norm_90err_hi    chi2    dof
PL      -1.957    -0.137      0.134       -           -               -         2.25e-03     -1.84e-04          1.81e-04      51.540   57
CPL     -1.958    -0.137      0.135     9999.360      N/A           N/A         2.25e-03        N/A               N/A         51.540   56


=== 1-s peak spectral analysis ===
(Best model with acceptable fit: PL)

Model Ph_index Ph_90err_low Ph_90err_hi  Epeak  Epeak_90err_low  Epeak_90err_hi  Norm       Nomr_90err_low    Norm_90err_hi    chi2    dof
PL      -1.983     -0.273     0.255       -           -               -         6.60e-03     -1.16e-03          1.12e-03      63.330   57
CPL     -1.577     -0.809     1.216       44.605      N/A           N/A         1.12e-02        N/A               N/A         62.860   56


=== Fluence/Peak Flux Summary ===

              Model    Band1     Band2     Band3     Band4     Band5     Total
                       15-25     25-50    50-100    100-350    15-150    15-350    keV
Fluence         PL   1.61e-07  2.24e-07  2.30e-07  4.34e-07  7.53e-07  1.05e-06   erg/cm2
      90%_error_low -1.72e-08 -1.53e-08 -2.60e-08 -9.30e-08 -5.88e-08 -1.20e-07   erg/cm2
      90%_error_hi   1.76e-08  1.53e-08  2.63e-08  1.10e-07  5.95e-08  1.32e-07   erg/cm2
Peak flux       PL   4.33e-01  3.28e-01  1.66e-01  1.20e-01  9.82e-01  1.05e+00   ph/cm2/s
      90%_error_low -8.64e-02 -4.52e-02 -3.77e-02 -4.57e-02 -1.36e-01 -1.45e-01   ph/cm2/s
      90%_error_hi   9.00e-02  4.52e-02  3.82e-02  6.04e-02  1.36e-01  1.46e-01   ph/cm2/s

Fluence        CPL   1.61e-07  2.24e-07  2.30e-07  4.37e-07  7.53e-07  1.05e-06   erg/cm2
      90%_error_low -1.73e-08 -1.52e-08 -2.60e-08 -6.99e-08 -6.35e-08 -2.71e-07   erg/cm2
      90%_error_hi   1.86e-08  1.53e-08  2.57e-08  6.35e-08  5.85e-08  6.97e-08   erg/cm2
Peak flux      CPL   4.15e-01  3.43e-01  1.66e-01  6.91e-02  9.67e-01  9.93e-01   ph/cm2/s
      90%_error_low -1.00e-01 -7.47e-02 -4.11e-02 -6.91e-02 -1.42e-01 -1.58e-01   ph/cm2/s
      90%_error_hi   9.75e-02  6.09e-02  4.06e-02  8.13e-02  1.42e-01  2.67e-01   ph/cm2/s

======================================================================
Image
Pre-slew 15.0-350.0 keV image (Event data)
#   RAcent    DECcent   POSerr    Theta     Phi              Peak Cts       SNR   Name
  257.1795   -22.7234   0.0100    15.7422     9.0098         1.4662310     19.241 TRIG_00530581

Foreground time interval of the image:
-14.200  22.184 (delta_t =  36.384 [sec])
Background time interval of the image:
-87.347 -14.200 (delta_t =  73.147 [sec])
Light Curves
Note: The mask-weighted lightcurves have units of either count/det or counts/sec/det, where a det is 0.4 x 0.4 = 0.16 sq cm.
Full-time range; 1 s binning
Other quick-look light curves:
- 64 ms binning (zoomed)
- 16 ms binning (zoomed)
- 8 ms binning (zoomed)
- 2 ms binning (zoomed)
- SN=5 or 10 s binning (full-time range)
- Raw light curve
Spectra
- 64 ms binning (zoomed)
- 16 ms binning (zoomed)
- 8 ms binning (zoomed)
- 2 ms binning (zoomed)
- SN=5 or 10 s binning (full-time range)
- Raw light curve
Spectra
Notes:
- 1) The fitting includes the systematic errors.
- 2) When the burst includes telescope slew time periods, the fitting uses an average response file made from multiple 5-s response files through out the slew time plus single time preiod for the non-slew times, and weighted by the total counts in the corresponding time period using addrmf. An average response file is needed becuase a spectral fit using the pre-slew DRM will introduce some errors in both a spectral shape and a normalization if the PHA file contains a lot of the slew/post-slew time interval.
- 3) For fits to more complicated models (e.g. a power-law over a cutoff power-law), the BAT team has decided to require a chi-square improvement of more than 6 for each extra dof.
Time averaged spectrum fit using the average DRM
Power-law model
Time interval is from  -14.200 sec. to   22.184 sec.

Spectral model in power-law:
------------------------------------------------------------
Parameters  : value       lower 90%   higher 90%
Photon index: -1.95746     ( -0.136902   0.133917 )
Norm@50keV  : 2.24746E-03    ( -0.000183531   0.000180831 )
------------------------------------------------------------
#Fit statistic : Chi-Squared =          51.54 using 59 PHA bins.
# Reduced chi-squared =         0.9042 for     57 degrees of freedom
# Null hypothesis probability =   6.793818e-01

Photon flux (15-150 keV)    in 36.38 sec: 0.330716 ( -0.023204  0.023257 ) ph/cm2/s
Energy fluence (15-150 keV)             : 7.52735e-07 ( -5.87777e-08  5.95391e-08 ) ergs/cm2
Cutoff power-law model

Time interval is from  -14.200 sec. to   22.184 sec.
Spectral model in the cutoff power-law:
------------------------------------------------------------
Parameters  : value       lower 90%   higher 90%
Photon index: -1.95818     ( -0.136956   0.135131 )
Epeak [keV] : 9999.36      (   )
Norm@50keV  : 2.24711E-03    (     )
------------------------------------------------------------
#Fit statistic : Chi-Squared =          51.54 using 59 PHA bins.
# Reduced chi-squared =         0.9203 for     56 degrees of freedom
# Null hypothesis probability =   6.442980e-01

Photon flux (15-150 keV)    in 36.38 sec: 0.330773 ( -0.024578  0.023193 ) ph/cm2/s
Energy fluence (15-150 keV)             : 7.53084e-07 ( -6.35391e-08  5.84798e-08 ) ergs/cm2
1-s peak spectrum fit
Power-law model
Time interval is from    0.428 sec. to    1.428 sec.

Spectral model in power-law:
------------------------------------------------------------
Parameters  : value       lower 90%   higher 90%
Photon index: -1.98293     ( -0.272934   0.255271 )
Norm@50keV  : 6.60011E-03    ( -0.00115607   0.00112023 )
------------------------------------------------------------
#Fit statistic : Chi-Squared =          63.33 using 59 PHA bins.
# Reduced chi-squared =          1.111 for     57 degrees of freedom
# Null hypothesis probability =   2.631113e-01

Photon flux (15-150 keV)    in 1 sec: 0.982396 ( -0.13637  0.136444 ) ph/cm2/s
Energy fluence (15-150 keV)             : 6.08247e-08 ( -9.92561e-09  1.0169e-08 ) ergs/cm2
Cutoff power-law model
Time interval is from    0.428 sec. to    1.428 sec.
Spectral model in the cutoff power-law:
------------------------------------------------------------
Parameters  : value       lower 90%   higher 90%
Photon index: -1.57675     ( -0.808686   1.21621 )
Epeak [keV] : 44.6045      (   )
Norm@50keV  : 1.12373E-02    (     )
------------------------------------------------------------
#Fit statistic : Chi-Squared =          62.86 using 59 PHA bins.
# Reduced chi-squared =          1.123 for     56 degrees of freedom
# Null hypothesis probability =   2.463216e-01

Photon flux (15-150 keV)    in 1 sec: 0.966932 ( -0.141752  0.141558 ) ph/cm2/s
Energy fluence (15-150 keV)             : 5.8475e-08 ( -1.09327e-08  1.11684e-08 ) ergs/cm2
Time-resolved spectra
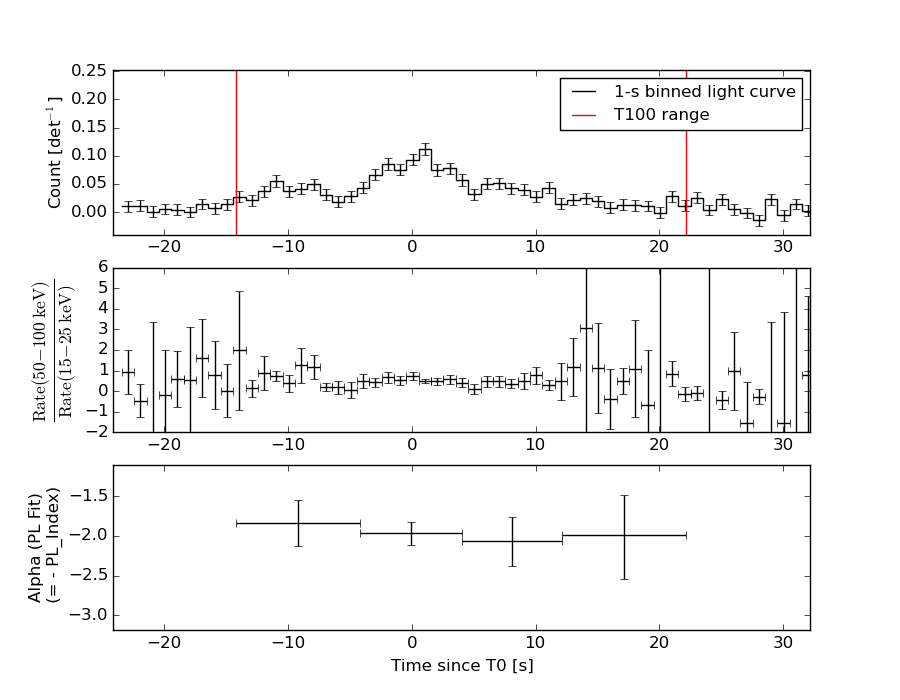
Distribution
T90 vs. Hardness ratio plot
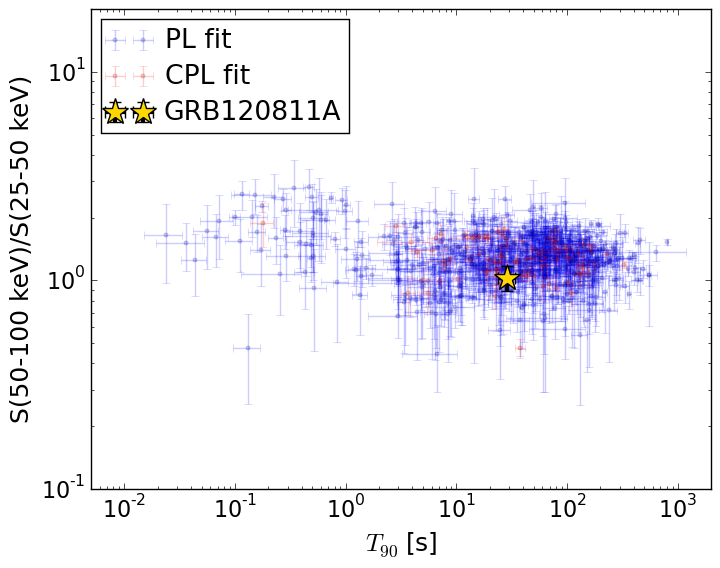
T90                                   = 29.008 sec.
Hardness ratio (energy fluence ratio) = 1.02998258329
S(15-50 keV) vs. S(50-150 keV) plot
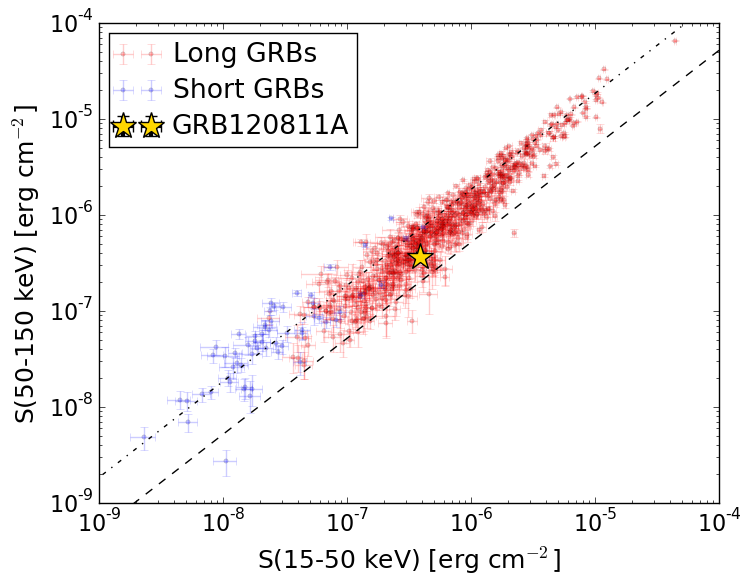
S(15-50 keV)  = 3.84392e-07
S(50-150 keV) = 3.683504e-07
The dash-dotted line and the dashed line traces the fluences calculated from the Band function with Epeak = 15 and 150 keV, respectively. Both lines assume a canonical values of alpha = -1 and beta = -2.5.
Mask shadow pattern
IMX = 2.784046720988066E-01, IMY = -4.414401037912250E-02
Spacecraft aspect plot
Bright source in the pre-burst/pre-slew/post-slew images
Pre-burst image of 15-350 keV band
Time interval of the image:
-87.347400 -14.200000

# RAcent  DECcent POSerr Theta    Phi  PeakCts   SNR AngSep     Name
#  [deg]    [deg]    ['] [deg]  [deg]                   [']
186.6602 -62.7702 2700.0  48.1 -132.9  -0.0001  -0.0    0.1	GX 301-2
244.9881 -15.6388    0.4  25.5  -18.5   2.8726  31.6    0.5	Sco X-1
256.1597 -37.7584    4.1   1.5  -52.3  -0.2670  -2.8    9.7	4U 1700-377
256.3816 -36.2786    8.2   2.5  -18.1   0.1279   1.4    9.0	GX 349+2
263.0226 -24.7347  347.4  14.4   30.5  -0.0030  -0.0    1.0	GX 1+4
264.5162 -44.4245    3.1   7.8  154.0   0.3172   3.7    9.8	4U 1735-44
268.3854  -1.3042    3.6  38.4   28.5   0.5190   3.2    9.0	SW J1753.5-0127
270.0956 -24.9783   13.9  17.0   52.5   0.0859   0.8   11.9	GX 5-1
270.3182 -25.8417    3.8  16.4   54.8   0.3106   3.1    6.0	GRS 1758-258
274.0112 -13.9767    4.5  28.3   46.1   0.3074   2.5    3.6	GX 17+2
275.9568 -30.3062    7.7  16.9   78.2   0.1501   1.5    4.0	H1820-303
285.0823 -25.0394    5.3  26.6   79.2   0.2739   2.2    7.6	HT1900.1-2455
262.9151 -33.9671    4.4   6.0   55.0   0.2314   2.6    8.8	GX 354-0
197.4304 -50.6573    2.1  43.5 -115.2   2.2595   5.5 ------	UNKNOWN
Pre-slew background subtracted image of 15-350 keV band
Time interval of the image:
-14.200000 22.184000

# RAcent  DECcent POSerr Theta    Phi  PeakCts   SNR AngSep     Name
#  [deg]    [deg]    ['] [deg]  [deg]                   [']
186.7377 -62.9156    5.4  48.0 -133.1   0.6472   2.1    9.0	GX 301-2
244.9268 -15.6843    2.8  25.5  -18.7   0.3214   4.2    4.0	Sco X-1
255.8996 -38.0089    8.5   1.6  -63.4  -0.0948  -1.3   10.7	4U 1700-377
256.6138 -36.3755    4.5   2.3  -15.2   0.1854   2.6    9.1	GX 349+2
263.0720 -24.7444   17.9  14.4   30.7   0.0474   0.6    3.4	GX 1+4
264.7484 -44.4558  819.6   7.9  153.2   0.0010   0.0    0.4	4U 1735-44
268.3366  -1.4595   96.6  38.2   28.5   0.0155   0.1    1.9	SW J1753.5-0127
270.1268 -25.1188    9.7  16.9   52.8   0.1013   1.2    8.9	GX 5-1
270.0920 -25.6482    0.0  16.4   53.8   0.0976   1.2   12.7	GRS 1758-258
274.1167 -13.9259   44.1  28.4   46.2  -0.0274  -0.3    9.3	GX 17+2
275.7003 -30.2879    0.0  16.8   77.7   0.1675   2.0   12.6	H1820-303
285.0859 -25.0480    5.4  26.6   79.2  -0.2221  -2.1    8.1	HT1900.1-2455
263.0389 -33.6700   12.9   6.3   54.0  -0.0656  -0.9   10.2	GX 354-0
257.1794 -22.7233    0.6  15.7    9.0   1.4665  19.2 ------	UNKNOWN
318.6393 -86.0513    2.3  49.7 -173.0   0.8309   4.9 ------	UNKNOWN
232.2167  10.3574    3.3  54.4  -20.2   0.8301   3.5 ------	UNKNOWN
225.4834 -10.2061    3.2  40.5  -42.9   0.4726   3.6 ------	UNKNOWN
157.1237 -76.5354    2.4  55.2 -152.3   1.4787   4.8 ------	UNKNOWN
205.8196 -46.2124    2.1  38.6 -107.4   1.0857   5.6 ------	UNKNOWN
Post-slew image of 15-350 keV band
Time interval of the image:
250.452610 962.592000

# RAcent  DECcent POSerr Theta    Phi  PeakCts   SNR AngSep     Name
#  [deg]    [deg]    ['] [deg]  [deg]                   [']
244.9792 -15.6395    0.2  22.6  -58.2  31.3352  55.5    0.0	Sco X-1
255.9225 -37.9437   58.2  16.2 -135.0  -0.0918  -0.2    6.7	4U 1700-377
256.2874 -36.5004    3.3  14.9 -132.4   1.6138   3.5    8.5	GX 349+2
263.0575 -24.7257    3.4   3.6  -78.0   1.6019   3.4    2.9	GX 1+4
264.7483 -44.2978   16.5  19.6 -163.1   0.3257   0.7    9.1	4U 1735-44
268.2874  -1.4384    3.2  23.4   15.3   1.6982   3.6    4.9	SW J1753.5-0127
270.2428 -25.1245    7.1   3.0  109.5   0.8285   1.6    3.5	GX 5-1
270.2996 -25.8977    4.3   3.2  123.4   1.4034   2.7    9.3	GRS 1758-258
274.0008 -14.0420    1.4  12.6   44.9   3.7994   8.3    0.4	GX 17+2
275.8607 -30.2697    4.0   9.6  139.0   1.3321   2.9    6.7	H1820-303
284.8752 -24.8205   67.4  16.2  106.0  -0.0883  -0.2   10.6	HT1900.1-2455
288.7698  10.9688    2.2  41.6   45.3   7.3470   5.3    2.2	GRS 1915+105
262.9551 -33.7403    4.1   9.6 -147.4   1.3852   2.8    5.9	GX 354-0
278.9068   9.4178    2.5  36.1   32.3   3.3401   4.6 ------	UNKNOWN
317.6969 -75.9491    4.2  56.9  179.1  10.1869   2.8 ------	UNKNOWN
254.8599  31.0255    3.3  57.0   -0.4   8.9417   3.5 ------	UNKNOWN
298.2055 -80.4641    3.5  57.2 -173.8   8.3717   3.3 ------	UNKNOWN
255.2456 -41.6292    2.2  19.5 -140.7   2.4753   5.2 ------	UNKNOWN
264.4983 -75.3105    3.6  50.6 -167.1   4.4438   3.3 ------	UNKNOWN
251.3996 -45.6171    2.1  24.3 -140.8   2.8093   5.4 ------	UNKNOWN
250.2803 -53.7272    1.8  31.5 -148.9   3.6834   6.5 ------	UNKNOWN
	UNKNOWN
	UNKNOWN
	UNKNOWN
	UNKNOWN