Analysis Summary
Notes:
- 1) No attempt has been made to eliminate the non-significant decimal places.
- 2) This batgrbproduct analysis is done using the HEASARC data.
- 3) This batgrbproduct analysis is using the flight position for the mask-weighting calculation.
======================================================================
BAT GRB EVENT DATA PROCESSING REPORT
Process Script Ver: batgrbproduct v2.46
Process Start Time: Mon Jan 13 01:42:57 EST 2014
Host Name: batevent1
Current Working Dir: /local/data/batevent/batevent_reproc/trigger530689
======================================================================
Trigger: 00530689 Segment: 000
BAT Trigger Time: 366392101.696 [s; MET]
Trigger Stop: 366392102.72 [s; MET]
UTC: 2012-08-11T15:34:52.170040 [includes UTCF correction]
Where From?: TDRSS position message
BAT
RA: 199.709572292913 Dec: 62.2913515948821 [deg; J2000]
Catalogged Source?: NO
Point Source?: YES
GRB Indicated?: YES [ by BAT flight software ]
Image S/N Ratio: 12.6
Image Trigger?: NO
Rate S/N Ratio: 22.8910462845192 [ if not an image trigger ]
Image S/N Ratio: 12.6
Analysis Position: [ source = BAT ]
RA: 199.709572292913 Dec: 62.2913515948821 [deg; J2000]
Refined Position: [ source = BAT pre-slew burst ]
RA: 199.691572640752 Dec: 62.2970895444334 [deg; J2000]
{ 13h 18m 46.0s , +62d 17' 49.5" }
+/- 0.55783317115792 [arcmin] (estimated 90% radius based on SNR)
+/- 0.162278695238235 [arcmin] (formal 1-sigma fit error)
SNR: 70.0253105067732
Angular difference between the analysis and refined position is 0.608808 arcmin
Partial Coding Fraction: 0.890625 [ including projection effects ]
Duration
T90: 24.3439999222755 +/- 3.05592145665642
Measured from: -4.01199996471405
to: 20.3319999575615 [s; relative to TRIGTIME]
T50: 7.07199990749359 +/- 0.495628927585199
Measured from: 2.52400004863739
to: 9.59599995613098 [s; relative to TRIGTIME]
Fluence
Peak Flux (peak 1 second)
Measured from: 5.26800000667572
to: 6.26800000667572 [s; relative to TRIGTIME]
Total Fluence
Measured from: -9.67599999904633
to: 31.3880000114441 [s; relative to TRIGTIME]
Band 1 Band 2 Band 3 Band 4
15-25 25-50 50-100 100-350 keV
Total 2.028852 2.230797 1.140891 0.153598
0.037779 0.040201 0.036573 0.036458 [error]
Peak 0.159384 0.194819 0.119972 0.017493
0.007435 0.008088 0.007071 0.005946 [error]
[ fluence units of on-axis counts / fully illuminated detector ]
======================================================================
====== Table of the duration information =============================
Value tstart tstop
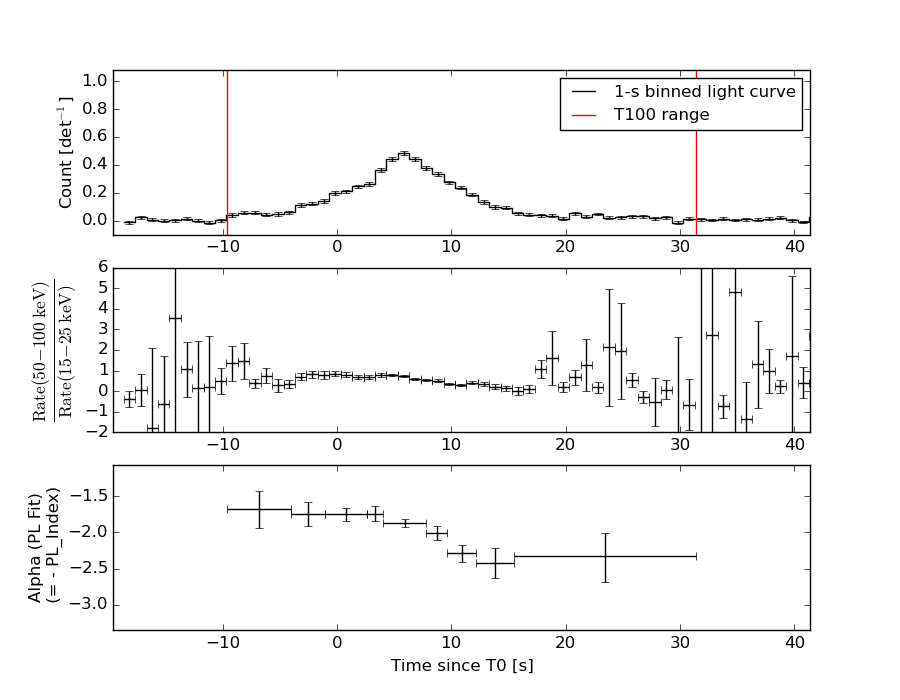
T100 41.064 -9.676 31.388
T90 24.344 -4.012 20.332
T50 7.072 2.524 9.596
Peak 1.000 5.268 6.268
====== Spectral Analysis Summary =====================================
Model : spectral model: simple power-law (PL) and cutoff power-law (CPL)
Ph_index : photon index: E^{Ph_index}
Ph_90err : 90% error of the photon index
Epeak : Epeak in keV
Epeak_90err: 90% error of Epeak
Norm : normalization at 50 keV in both the PL model and CPL model
Nomr_90err : 90% error of the normalization
chi2 : Chi-Squared
dof : degree of freedo
=== Time-averaged spectral analysis ===
(Best model with acceptable fit: CPL)
Model Ph_index Ph_90err_low Ph_90err_hi Epeak Epeak_90err_low Epeak_90err_hi Norm Nomr_90err_low Norm_90err_hi chi2 dof
PL -1.991 -0.057 0.056 - - - 8.05e-03 -2.39e-04 2.38e-04 65.950 57
CPL -1.331 -0.261 0.278 47.312 -4.709 5.248 1.76e-02 -4.60e-03 6.79e-03 45.520 56
=== 1-s peak spectral analysis ===
(Best model with acceptable fit: CPL)
Model Ph_index Ph_90err_low Ph_90err_hi Epeak Epeak_90err_low Epeak_90err_hi Norm Nomr_90err_low Norm_90err_hi chi2 dof
PL -1.777 -0.093 0.092 - - - 3.02e-02 -1.69e-03 1.68e-03 62.100 57
CPL -1.020 -0.397 0.437 60.075 -8.369 18.088 7.61e-02 -2.88e-02 5.28e-02 50.670 56
=== Fluence/Peak Flux Summary ===
Model Band1 Band2 Band3 Band4 Band5 Total
15-25 25-50 50-100 100-350 15-150 15-350 keV
Fluence PL 6.71e-07 9.15e-07 9.20e-07 1.68e-06 3.05e-06 4.18e-06 erg/cm2
90%_error_low -3.27e-08 -2.55e-08 -3.84e-08 -1.48e-07 -8.71e-08 -1.77e-07 erg/cm2
90%_error_hi 3.33e-08 2.55e-08 3.85e-08 1.57e-07 8.73e-08 1.84e-07 erg/cm2
Peak flux PL 1.62e+00 1.39e+00 8.09e-01 7.06e-01 4.12e+00 4.52e+00 ph/cm2/s
90%_error_low -1.32e-01 -7.14e-02 -5.92e-02 -9.81e-02 -2.12e-01 -2.28e-01 ph/cm2/s
90%_error_hi 1.35e-01 7.13e-02 5.92e-02 1.08e-01 2.12e-01 2.28e-01 ph/cm2/s
Fluence CPL 5.96e-07 9.57e-07 9.15e-07 6.68e-07 2.84e-06 3.14e-06 erg/cm2
90%_error_low -4.18e-08 -3.04e-08 -4.22e-08 -1.80e-07 -1.13e-07 -2.19e-07 erg/cm2
90%_error_hi 4.26e-08 3.06e-08 4.19e-08 2.59e-07 1.14e-07 2.88e-07 erg/cm2
Peak flux CPL 1.44e+00 1.49e+00 8.30e-01 3.06e-01 3.96e+00 4.06e+00 ph/cm2/s
90%_error_low -1.58e-01 -8.82e-02 -6.59e-02 -1.05e-01 -2.26e-01 -2.57e-01 ph/cm2/s
90%_error_hi 1.61e-01 8.97e-02 6.61e-02 1.59e-01 2.26e-01 2.75e-01 ph/cm2/s
======================================================================
Image
Pre-slew 15.0-350.0 keV image (Event data)
#   RAcent    DECcent   POSerr    Theta     Phi              Peak Cts       SNR   Name
  199.6916    62.2971   0.0027    21.2378   159.5756         4.7735500     70.025 TRIG_00530689

Foreground time interval of the image:
 -9.676  12.205 (delta_t =  21.881 [sec])
Background time interval of the image:
-427.295 -408.540 (delta_t =  18.755 [sec])
-239.696  -9.676 (delta_t = 230.020 [sec])
Light Curves
Note: The mask-weighted lightcurves have units of either count/det or counts/sec/det, where a det is 0.4 x 0.4 = 0.16 sq cm.
Full-time range; 1 s binning
Other quick-look light curves:
- 64 ms binning (zoomed)
- 16 ms binning (zoomed)
- 8 ms binning (zoomed)
- 2 ms binning (zoomed)
- SN=5 or 10 s binning (full-time range)
- Raw light curve
Spectra
- 64 ms binning (zoomed)
- 16 ms binning (zoomed)
- 8 ms binning (zoomed)
- 2 ms binning (zoomed)
- SN=5 or 10 s binning (full-time range)
- Raw light curve
Spectra
Notes:
- 1) The fitting includes the systematic errors.
- 2) When the burst includes telescope slew time periods, the fitting uses an average response file made from multiple 5-s response files through out the slew time plus single time preiod for the non-slew times, and weighted by the total counts in the corresponding time period using addrmf. An average response file is needed becuase a spectral fit using the pre-slew DRM will introduce some errors in both a spectral shape and a normalization if the PHA file contains a lot of the slew/post-slew time interval.
- 3) For fits to more complicated models (e.g. a power-law over a cutoff power-law), the BAT team has decided to require a chi-square improvement of more than 6 for each extra dof.
Time averaged spectrum fit using the average DRM
Power-law model
Time interval is from   -9.676 sec. to   31.388 sec.

Spectral model in power-law:
------------------------------------------------------------
Parameters  : value       lower 90%   higher 90%
Photon index: -1.99143     ( -0.0566533   0.0561722 )
Norm@50keV  : 8.04955E-03    ( -0.000239251   0.000238326 )
------------------------------------------------------------
#Fit statistic : Chi-Squared =          65.95 using 59 PHA bins.
# Reduced chi-squared =          1.157 for     57 degrees of freedom
# Null hypothesis probability =   1.950401e-01

Photon flux (15-150 keV)    in 41.06 sec: 1.20279 ( -0.03612  0.03627 ) ph/cm2/s
Energy fluence (15-150 keV)             : 3.04719e-06 ( -8.70681e-08  8.7319e-08 ) ergs/cm2
Cutoff power-law model
Time interval is from   -9.676 sec. to   31.388 sec.
Spectral model in the cutoff power-law:
------------------------------------------------------------
Parameters  : value       lower 90%   higher 90%
Photon index: -1.33097     ( -0.260566   0.277675 )
Epeak [keV] : 47.3123      ( -4.70883 5.24831 )
Norm@50keV  : 1.76154E-02    ( -0.00460366   0.00678926 )
------------------------------------------------------------
#Fit statistic : Chi-Squared =          45.52 using 59 PHA bins.
# Reduced chi-squared =         0.8129 for     56 degrees of freedom
# Null hypothesis probability =   8.402219e-01

Photon flux (15-150 keV)    in 41.06 sec: 1.13683 ( -0.04304  0.0433 ) ph/cm2/s
Energy fluence (15-150 keV)             : 2.84485e-06 ( -1.1292e-07  1.13772e-07 ) ergs/cm2
1-s peak spectrum fit
Power-law model
Time interval is from    5.268 sec. to    6.268 sec.

Spectral model in power-law:
------------------------------------------------------------
Parameters  : value       lower 90%   higher 90%
Photon index: -1.77651     ( -0.0930843   0.0915318 )
Norm@50keV  : 3.01951E-02    ( -0.00169052   0.00167843 )
------------------------------------------------------------
#Fit statistic : Chi-Squared =          62.10 using 59 PHA bins.
# Reduced chi-squared =          1.089 for     57 degrees of freedom
# Null hypothesis probability =   2.995141e-01

Photon flux (15-150 keV)    in 1 sec: 4.12374 ( -0.21209  0.21231 ) ph/cm2/s
Energy fluence (15-150 keV)             : 2.78285e-07 ( -1.599e-08  1.61165e-08 ) ergs/cm2
Cutoff power-law model
Time interval is from    5.268 sec. to    6.268 sec.
Spectral model in the cutoff power-law:
------------------------------------------------------------
Parameters  : value       lower 90%   higher 90%
Photon index: -1.01966     ( -0.39746   0.43709 )
Epeak [keV] : 60.0747      ( -8.36932 18.0877 )
Norm@50keV  : 7.61236E-02    ( -0.0288086   0.052776 )
------------------------------------------------------------
#Fit statistic : Chi-Squared =          50.67 using 59 PHA bins.
# Reduced chi-squared =         0.9049 for     56 degrees of freedom
# Null hypothesis probability =   6.760537e-01

Photon flux (15-150 keV)    in 1 sec: 3.96476 ( -0.22611  0.22635 ) ph/cm2/s
Energy fluence (15-150 keV)             : 2.60268e-07 ( -1.80313e-08  1.83249e-08 ) ergs/cm2
Time-resolved spectra
Distribution
T90 vs. Hardness ratio plot
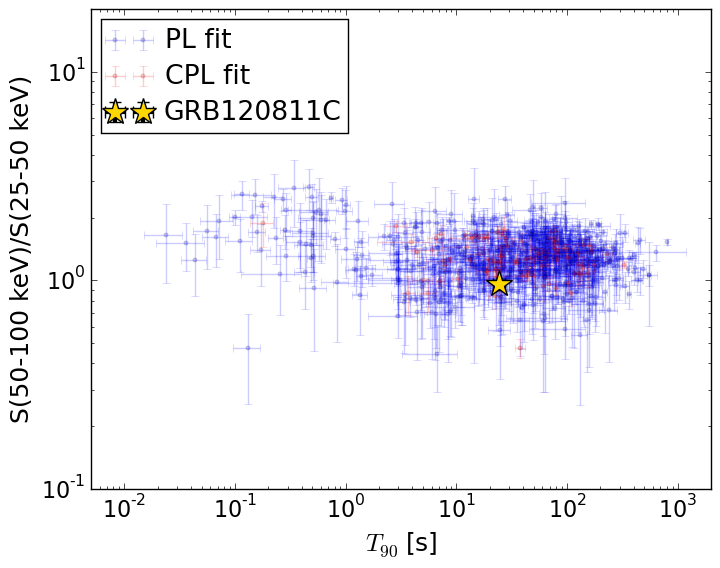
T90                                   = 24.344 sec.
Hardness ratio (energy fluence ratio) = 0.956621063029
S(15-50 keV) vs. S(50-150 keV) plot
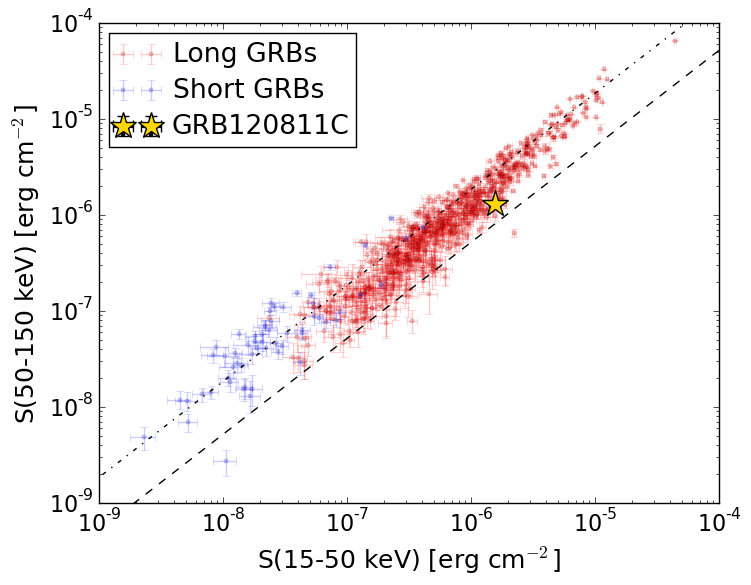
S(15-50 keV)  = 1.552626e-06
S(50-150 keV) = 1.2922151e-06
The dash-dotted line and the dashed line traces the fluences calculated from the Band function with Epeak = 15 and 150 keV, respectively. Both lines assume a canonical values of alpha = -1 and beta = -2.5.
Mask shadow pattern
IMX = -3.642017794637605E-01, IMY = -1.356221535428241E-01
Spacecraft aspect plot
Bright source in the pre-burst/pre-slew/post-slew images
Pre-burst image of 15-350 keV band
Time interval of the image:
-427.295400 -408.540500
-239.696000 -9.676000

# RAcent  DECcent POSerr Theta    Phi  PeakCts   SNR AngSep     Name
#  [deg]    [deg]    ['] [deg]  [deg]                   [']
206.0618  21.8673    2.6  58.4 -171.7   5.2825   4.5 ------	UNKNOWN
143.2927  28.6510    3.0  41.2  -98.0   4.2448   3.8 ------	UNKNOWN
Pre-slew background subtracted image of 15-350 keV band
Time interval of the image:
-9.676000 12.204600

# RAcent  DECcent POSerr Theta    Phi  PeakCts   SNR AngSep     Name
#  [deg]    [deg]    ['] [deg]  [deg]                   [']
199.6916  62.2971    0.2  21.2  159.6   4.7736  70.0 ------	UNKNOWN
189.8005  19.7735    2.2  55.7 -153.7   1.5486   5.2 ------	UNKNOWN
Post-slew image of 15-350 keV band
Time interval of the image:
55.404620 962.350700

# RAcent  DECcent POSerr Theta    Phi  PeakCts   SNR AngSep     Name
#  [deg]    [deg]    ['] [deg]  [deg]                   [']
254.6205  35.4400   24.0  43.0  124.6  -1.0657  -0.5    9.9	Her X-1
 49.2633  60.3147    2.8  55.3    5.1   8.1982   4.1 ------	UNKNOWN
 94.1333  74.3180    3.3  35.0   -4.6   2.4068   3.5 ------	UNKNOWN
215.1824  12.2801    2.6  51.2 -177.2   6.0958   4.5 ------	UNKNOWN
 88.4414  55.3760    2.6  50.7  -20.8   5.0558   4.4 ------	UNKNOWN