Analysis Summary
Notes:
- 1) No attempt has been made to eliminate the non-significant decimal places.
- 2) This batgrbproduct analysis is done using the HEASARC data.
- 3) This batgrbproduct analysis is using the flight position for the mask-weighting calculation.
======================================================================
BAT GRB EVENT DATA PROCESSING REPORT
Process Script Ver: batgrbproduct v2.46
Process Start Time: Mon Jan 13 01:37:44 EST 2014
Host Name: batevent1
Current Working Dir: /local/data/batevent/batevent_reproc/trigger531003
======================================================================
Trigger: 00531003 Segment: 000
BAT Trigger Time: 366689648.32 [s; MET]
Trigger Stop: 366689649.344 [s; MET]
UTC: 2012-08-15T02:13:58.781640 [includes UTCF correction]
Where From?: TDRSS position message
BAT
RA: 273.955183891862 Dec: -52.1341064210625 [deg; J2000]
Catalogged Source?: NO
Point Source?: YES
GRB Indicated?: YES [ by BAT flight software ]
Image S/N Ratio: 9.23
Image Trigger?: NO
Rate S/N Ratio: 16.0312195418814 [ if not an image trigger ]
Image S/N Ratio: 9.23
Analysis Position: [ source = BAT ]
RA: 273.955183891862 Dec: -52.1341064210625 [deg; J2000]
Refined Position: [ source = BAT pre-slew burst ]
RA: 273.97646673786 Dec: -52.1243089172957 [deg; J2000]
{ 18h 15m 54.4s , -52d 07' 27.5" }
+/- 1.79104064271745 [arcmin] (estimated 90% radius based on SNR)
+/- 0.729000159722781 [arcmin] (formal 1-sigma fit error)
SNR: 13.2293704705461
Angular difference between the analysis and refined position is 0.979839 arcmin
Partial Coding Fraction: 0.2851562 [ including projection effects ]
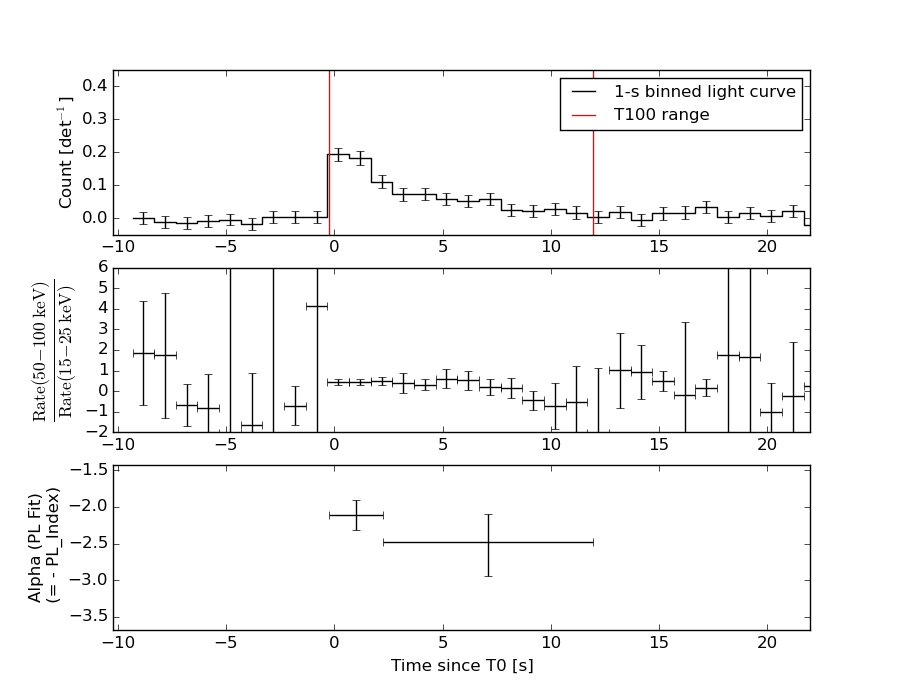
Duration
T90: 7.23199999332428 +/- 2.51676054269014
Measured from: -0.00800001621246338
to: 7.22399997711182 [s; relative to TRIGTIME]
T50: 4.29999995231628 +/- 1.54716770236409
Measured from: 0.804000020027161
to: 5.10399997234344 [s; relative to TRIGTIME]
Fluence
Peak Flux (peak 1 second)
Measured from: 0.171999990940094
to: 1.17199999094009 [s; relative to TRIGTIME]
Total Fluence
Measured from: -0.244000017642975
to: 11.9679999947548 [s; relative to TRIGTIME]
Band 1 Band 2 Band 3 Band 4
15-25 25-50 50-100 100-350 keV
Total 0.364728 0.370263 0.134919 0.037699
0.036766 0.037678 0.031765 0.026992 [error]
Peak 0.090140 0.083915 0.053956 0.013105
0.011840 0.011975 0.009949 0.008615 [error]
[ fluence units of on-axis counts / fully illuminated detector ]
======================================================================
====== Table of the duration information =============================
Value tstart tstop
T100 12.212 -0.244 11.968
T90 7.232 -0.008 7.224
T50 4.300 0.804 5.104
Peak 1.000 0.172 1.172
====== Spectral Analysis Summary =====================================
Model : spectral model: simple power-law (PL) and cutoff power-law (CPL)
Ph_index : photon index: E^{Ph_index}
Ph_90err : 90% error of the photon index
Epeak : Epeak in keV
Epeak_90err: 90% error of Epeak
Norm : normalization at 50 keV in both the PL model and CPL model
Nomr_90err : 90% error of the normalization
chi2 : Chi-Squared
dof : degree of freedo
=== Time-averaged spectral analysis ===
(Best model with acceptable fit: PL)
Model Ph_index Ph_90err_low Ph_90err_hi Epeak Epeak_90err_low Epeak_90err_hi Norm Nomr_90err_low Norm_90err_hi chi2 dof
PL -2.300 -0.237 0.219 - - - 4.21e-03 -7.11e-04 6.97e-04 53.810 57
CPL -1.184 -0.791 1.384 27.252 N/A N/A 2.07e-02 N/A N/A 50.290 56
=== 1-s peak spectral analysis ===
(Best model with acceptable fit: PL)
Model Ph_index Ph_90err_low Ph_90err_hi Epeak Epeak_90err_low Epeak_90err_hi Norm Nomr_90err_low Norm_90err_hi chi2 dof
PL -1.933 -0.253 0.241 - - - 1.53e-02 -2.56e-03 2.50e-03 61.720 57
CPL -1.194 -0.891 1.309 46.081 N/A N/A 4.08e-02 N/A N/A 60.190 56
=== Fluence/Peak Flux Summary ===
Model Band1 Band2 Band3 Band4 Band5 Total
15-25 25-50 50-100 100-350 15-150 15-350 keV
Fluence PL 1.40e-07 1.59e-07 1.29e-07 1.75e-07 4.92e-07 6.03e-07 erg/cm2
90%_error_low -2.11e-08 -1.97e-08 -2.86e-08 -6.43e-08 -6.82e-08 -1.07e-07 erg/cm2
90%_error_hi 2.15e-08 1.95e-08 2.98e-08 8.52e-08 6.98e-08 1.21e-07 erg/cm2
Peak flux PL 9.56e-01 7.45e-01 3.90e-01 2.96e-01 2.23e+00 2.39e+00 ph/cm2/s
90%_error_low -1.97e-01 -1.07e-01 -8.27e-02 -1.05e-01 -3.23e-01 -3.42e-01 ph/cm2/s
90%_error_hi 2.05e-01 1.07e-01 8.32e-02 1.34e-01 3.24e-01 3.42e-01 ph/cm2/s
Fluence CPL N/A N/A N/A N/A N/A N/A erg/cm2
90%_error_low -2.11e-08 -1.97e-08 -2.86e-08 -6.43e-08 -6.82e-08 -1.07e-07 erg/cm2
90%_error_hi 2.15e-08 1.95e-08 2.98e-08 8.52e-08 6.98e-08 1.21e-07 erg/cm2
Peak flux CPL 8.93e-01 8.16e-01 3.90e-01 1.17e-01 2.18e+00 2.22e+00 ph/cm2/s
90%_error_low -2.20e-01 -1.44e-01 -1.02e-01 -1.17e-01 -3.29e-01 -3.48e-01 ph/cm2/s
90%_error_hi 2.24e-01 1.52e-01 9.39e-02 2.25e-01 3.29e-01 3.95e-01 ph/cm2/s
======================================================================
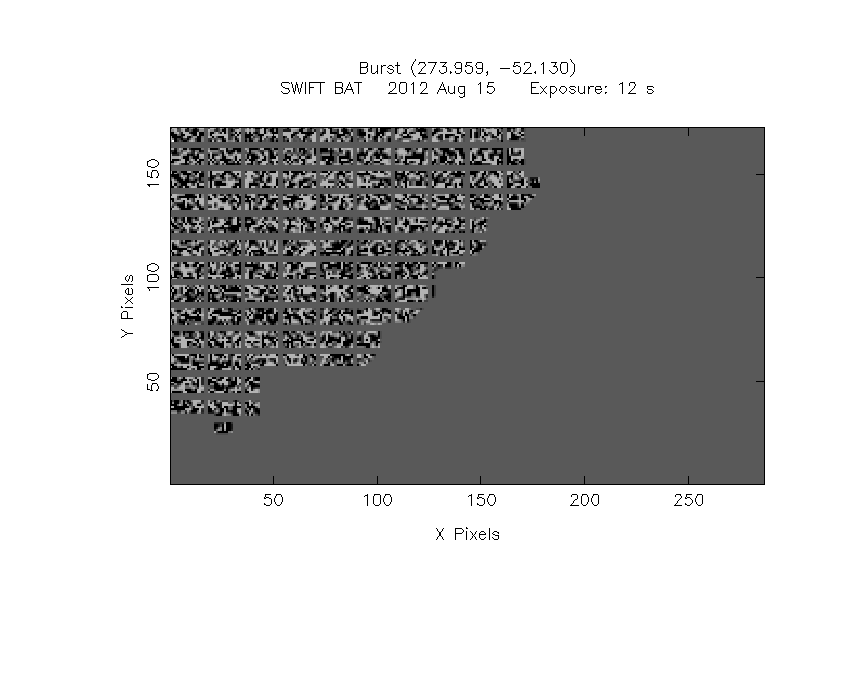
Image
Pre-slew 15.0-350.0 keV image (Event data)
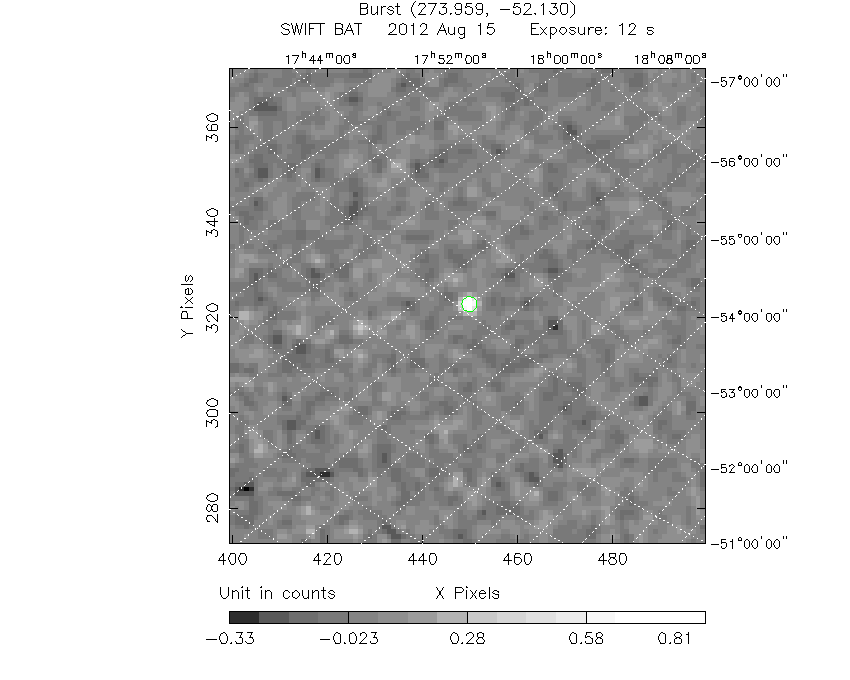
#   RAcent    DECcent   POSerr    Theta     Phi              Peak Cts       SNR   Name
  273.9765   -52.1243   0.0146    43.7996    19.6862         0.9560139     13.229 TRIG_00531003

Foreground time interval of the image:
 -0.244  11.968 (delta_t =  12.212 [sec])
Background time interval of the image:
-239.320  -0.244 (delta_t = 239.076 [sec])
Light Curves
Note: The mask-weighted lightcurves have units of either count/det or counts/sec/det, where a det is 0.4 x 0.4 = 0.16 sq cm.
Full-time range; 1 s binning
Other quick-look light curves:
- 64 ms binning (zoomed)
- 16 ms binning (zoomed)
- 8 ms binning (zoomed)
- 2 ms binning (zoomed)
- SN=5 or 10 s binning (full-time range)
- Raw light curve
Spectra
- 64 ms binning (zoomed)
- 16 ms binning (zoomed)
- 8 ms binning (zoomed)
- 2 ms binning (zoomed)
- SN=5 or 10 s binning (full-time range)
- Raw light curve
Spectra
Notes:
- 1) The fitting includes the systematic errors.
- 2) When the burst includes telescope slew time periods, the fitting uses an average response file made from multiple 5-s response files through out the slew time plus single time preiod for the non-slew times, and weighted by the total counts in the corresponding time period using addrmf. An average response file is needed becuase a spectral fit using the pre-slew DRM will introduce some errors in both a spectral shape and a normalization if the PHA file contains a lot of the slew/post-slew time interval.
- 3) For fits to more complicated models (e.g. a power-law over a cutoff power-law), the BAT team has decided to require a chi-square improvement of more than 6 for each extra dof.
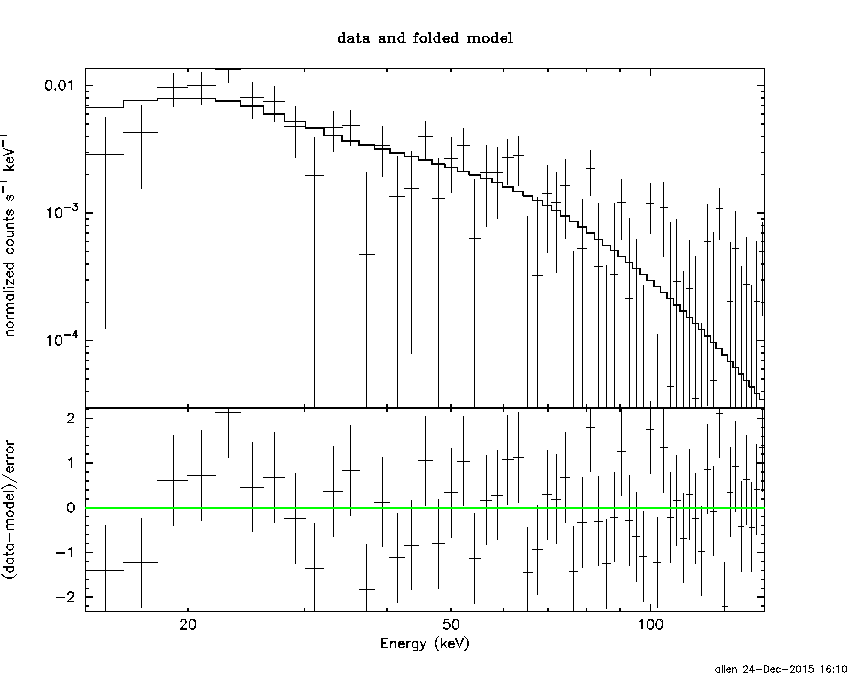
Time averaged spectrum fit using the average DRM
Power-law model
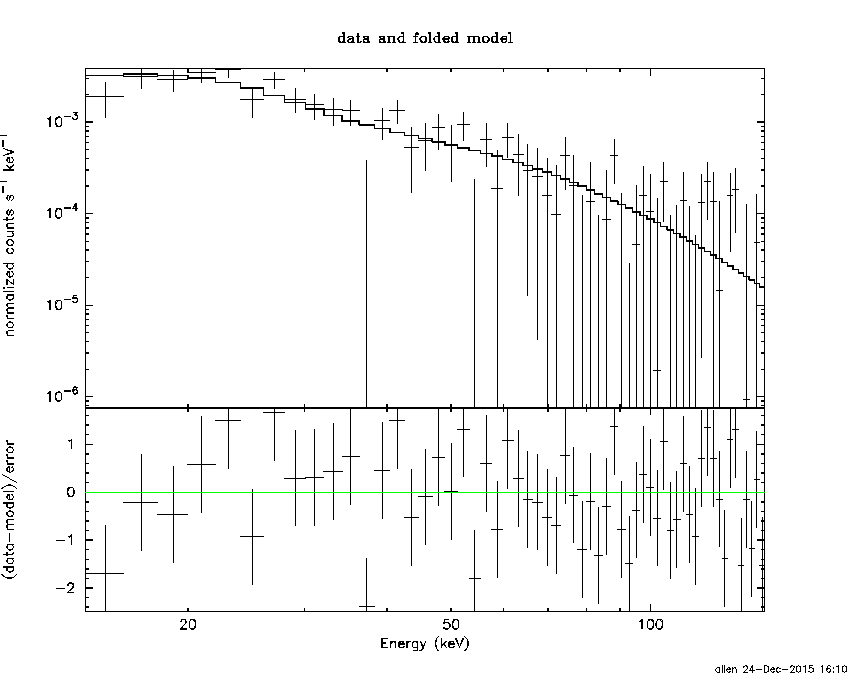
Time interval is from   -0.244 sec. to   11.968 sec.

Spectral model in power-law:
------------------------------------------------------------
Parameters  : value       lower 90%   higher 90%
Photon index: -2.30031     ( -0.236915   0.218651 )
Norm@50keV  : 4.21300E-03    ( -0.000710565   0.000696567 )
------------------------------------------------------------
#Fit statistic : Chi-Squared =          53.81 using 59 PHA bins.
# Reduced chi-squared =         0.9440 for     57 degrees of freedom
# Null hypothesis probability =   5.955690e-01

Photon flux (15-150 keV)    in 12.21 sec: 0.736468 ( -0.086466  0.086482 ) ph/cm2/s
Energy fluence (15-150 keV)             : 4.91706e-07 ( -6.8214e-08  6.97882e-08 ) ergs/cm2
Cutoff power-law model
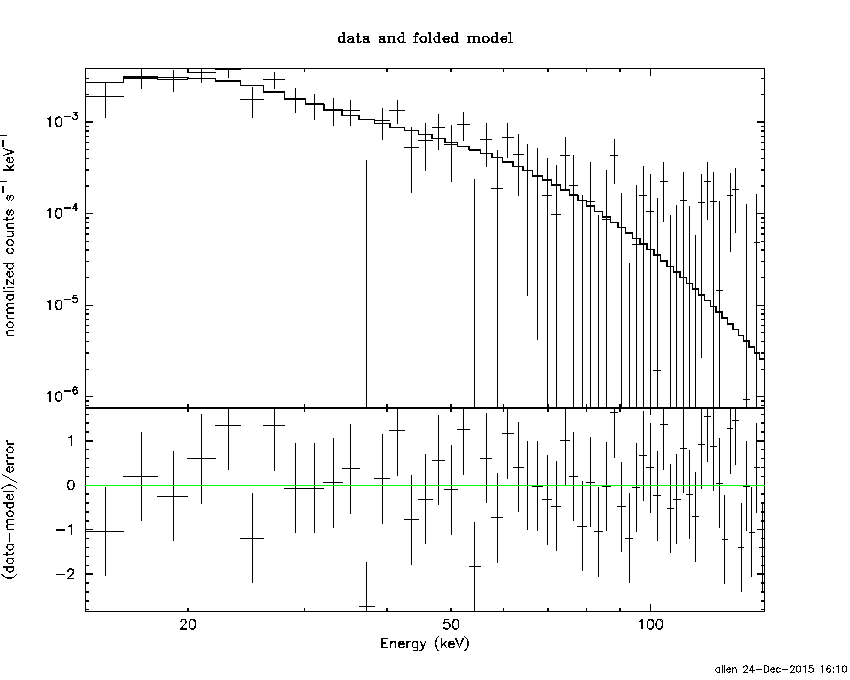
Time interval is from   -0.244 sec. to   11.968 sec.
Spectral model in the cutoff power-law:
------------------------------------------------------------
Parameters  : value       lower 90%   higher 90%
Photon index: -1.18405     ( -0.791134   1.38404 )
Epeak [keV] : 27.2523      (   )
Norm@50keV  : 2.06925E-02    (     )
------------------------------------------------------------
#Fit statistic : Chi-Squared =          50.29 using 59 PHA bins.
# Reduced chi-squared =         0.8981 for     56 degrees of freedom
# Null hypothesis probability =   6.898097e-01

Photon flux (15-150 keV)    in 12.21 sec: 0.716067 ( -0.087949  0.088286 ) ph/cm2/s
Energy fluence (15-150 keV)             : 0 ( 0  0 ) ergs/cm2
1-s peak spectrum fit
Power-law model
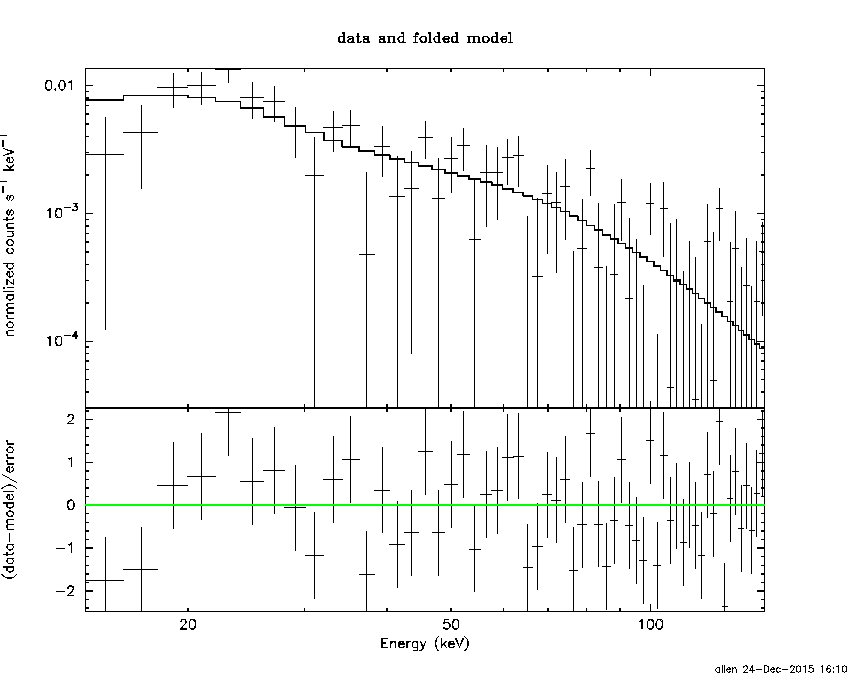
Time interval is from    0.172 sec. to    1.172 sec.

Spectral model in power-law:
------------------------------------------------------------
Parameters  : value       lower 90%   higher 90%
Photon index: -1.93336     ( -0.253409   0.240784 )
Norm@50keV  : 1.52874E-02    ( -0.00255767   0.00250011 )
------------------------------------------------------------
#Fit statistic : Chi-Squared =          61.72 using 59 PHA bins.
# Reduced chi-squared =          1.083 for     57 degrees of freedom
# Null hypothesis probability =   3.112799e-01

Photon flux (15-150 keV)    in 1 sec: 2.22579 ( -0.32341  0.32377 ) ph/cm2/s
Energy fluence (15-150 keV)             : 1.40647e-07 ( -2.26557e-08  2.29857e-08 ) ergs/cm2
Cutoff power-law model
Time interval is from    0.172 sec. to    1.172 sec.
Spectral model in the cutoff power-law:
------------------------------------------------------------
Parameters  : value       lower 90%   higher 90%
Photon index: -1.19407     ( -0.890586   1.30852 )
Epeak [keV] : 46.0806      (   )
Norm@50keV  : 4.08434E-02    (     )
------------------------------------------------------------
#Fit statistic : Chi-Squared =          60.19 using 59 PHA bins.
# Reduced chi-squared =          1.075 for     56 degrees of freedom
# Null hypothesis probability =   3.265274e-01

Photon flux (15-150 keV)    in 1 sec: 2.18369 ( -0.32899  0.32919 ) ph/cm2/s
Energy fluence (15-150 keV)             : 0 ( 0  0 ) ergs/cm2
Time-resolved spectra
Distribution
T90 vs. Hardness ratio plot
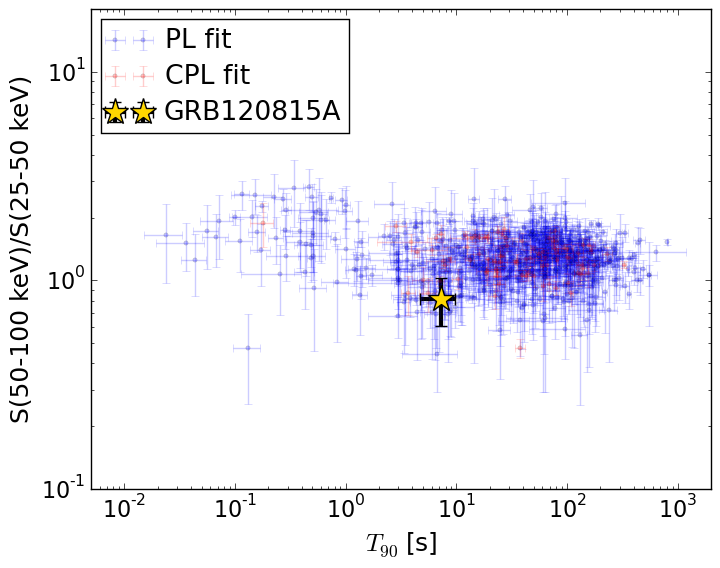
T90                                   = 7.232 sec.
Hardness ratio (energy fluence ratio) = 0.81211979602
S(15-50 keV) vs. S(50-150 keV) plot
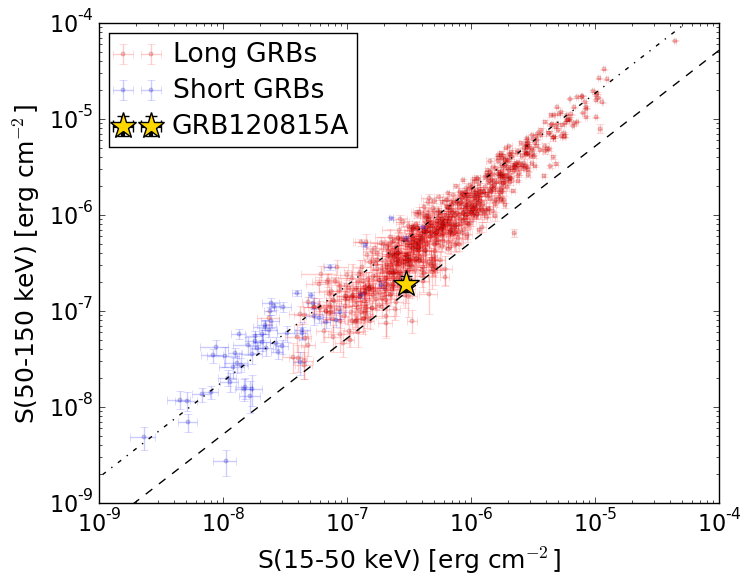
S(15-50 keV)  = 2.988823e-07
S(50-150 keV) = 1.9283135e-07
The dash-dotted line and the dashed line traces the fluences calculated from the Band function with Epeak = 15 and 150 keV, respectively. Both lines assume a canonical values of alpha = -1 and beta = -2.5.
Mask shadow pattern
IMX = 9.029025794022019E-01, IMY = -3.230404159963384E-01
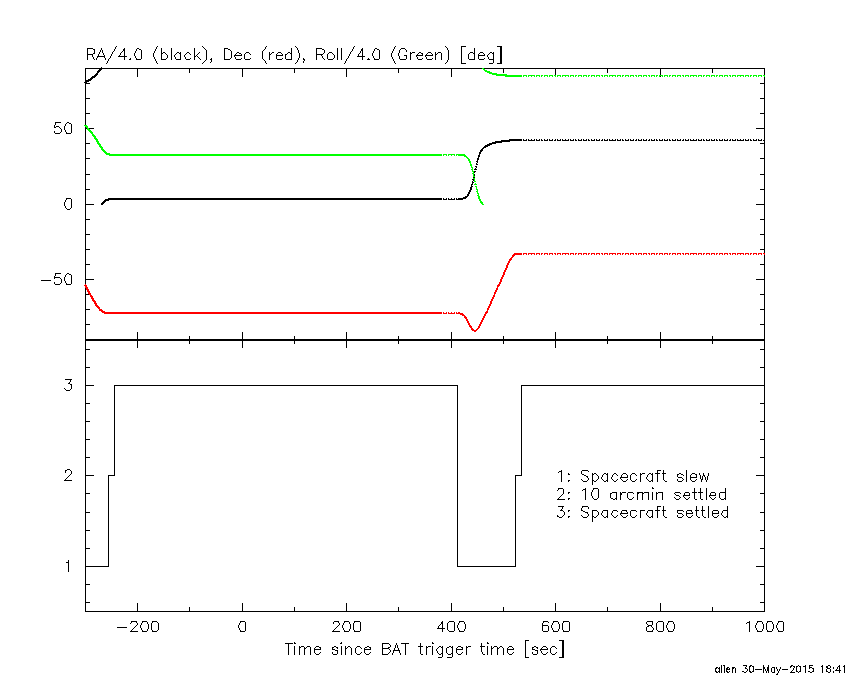
Spacecraft aspect plot
Bright source in the pre-burst/pre-slew/post-slew images
Pre-burst image of 15-350 keV band
Time interval of the image:
-239.320000 -0.244000

# RAcent  DECcent POSerr Theta    Phi  PeakCts   SNR AngSep     Name
#  [deg]    [deg]    ['] [deg]  [deg]                   [']
170.4218 -60.6537  124.6  46.0  -56.8  -0.0776  -0.1    3.6	Cen X-3
186.3053 -62.7157    5.9  44.8  -46.0   1.0665   2.0   10.2	GX 301-2
264.6080 -44.3913    6.5  53.4   16.1   1.4030   1.8    6.8	4U 1735-44
260.0368 -43.1046    2.8  55.7   12.8   4.0365   4.1 ------	UNKNOWN
273.2647 -59.8847    2.4  37.1   13.6   1.2210   4.9 ------	UNKNOWN
328.8991 -69.9008    3.1  14.3   36.7   0.5984   3.7 ------	UNKNOWN
 43.1326 -40.7110    2.6  34.8  179.8   0.9479   4.5 ------	UNKNOWN
101.8941 -49.3889    2.0  43.2 -113.2   4.5028   5.6 ------	UNKNOWN
Pre-slew background subtracted image of 15-350 keV band
Time interval of the image:
-0.244000 11.968000

# RAcent  DECcent POSerr Theta    Phi  PeakCts   SNR AngSep     Name
#  [deg]    [deg]    ['] [deg]  [deg]                   [']
170.5468 -60.7354    5.0  46.0  -56.7   0.3159   2.3    9.6	Cen X-3
186.2570 -62.7881   32.6  44.7  -46.0  -0.0296  -0.4   11.0	GX 301-2
264.5992 -44.3410    5.4  53.4   16.1  -0.3297  -2.1    9.0	4U 1735-44
273.9765 -52.1243    0.9  43.8   19.7   0.9562  13.2 ------	UNKNOWN
344.5032 -81.7927    2.4  11.1  -20.4   0.1471   4.9 ------	UNKNOWN
Post-slew image of 15-350 keV band
Time interval of the image:
523.080610 962.777700

# RAcent  DECcent POSerr Theta    Phi  PeakCts   SNR AngSep     Name
#  [deg]    [deg]    ['] [deg]  [deg]                   [']
135.5753 -40.5405    1.9  28.1  174.3   2.1105   6.2    2.3	Vela X-1
170.4669 -60.6050    4.7  27.8  109.1  -1.0645  -2.4    4.6	Cen X-3
186.7557 -62.7909    8.8  31.9   95.2   0.7071   1.3    3.0	GX 301-2
208.4396  12.9207    3.4  58.9  -24.4   8.0946   3.4 ------	UNKNOWN