Analysis Summary
Notes:
- 1) No attempt has been made to eliminate the non-significant decimal places.
- 2) This batgrbproduct analysis is done using the HEASARC data.
- 3) This batgrbproduct analysis is using the flight position for the mask-weighting calculation.
FLUX-mask-weighted light curve (pcodethresh=0.05; aperture=CALDB:FLUX)
==========================================================================
BAT GROUND-DETECTED GRB DATA PROCESSING REPORT
Process Script Ver: batgrbproduct v2.46
Process Start Time: Thu Dec 17 16:33:35 EST 2015
Host Name: bat1
Current Working Dir: /local/data/bat1/alien/Swift_3rdBATcatalog/event/batevent_reproc/trigger531259
======================================================================
Trigger: 00531259 Segment: 000
BAT Trigger Time: 366868959.252
UTC: 2012-08-17T04:02:29.706 [includes UTCF correction]
Where From?: Ground analysis (best_duration.txt)
NOTE: BAT trigger time for ground-detected burst is the T100 start time.
Analysis Position: [ source = GCN ]
RA: 8.310 Dec: -26.428 [deg; J2000]
Refined Position: [ source = BAT pre-slew image ]
RA: 8.31 Dec: -26.428 [deg; J2000]
{ 00h 33m 14.4s , -26d -25' -40.8" }
+/- 2.43406974085 [arcmin] (estimated 90% radius based on SNR)
SNR: 8.53632393016
Angular difference between the analysis and refined position is 0.000000 arcmin
Partial Coding Fraction: 0.05175781 [ including projection effects ]
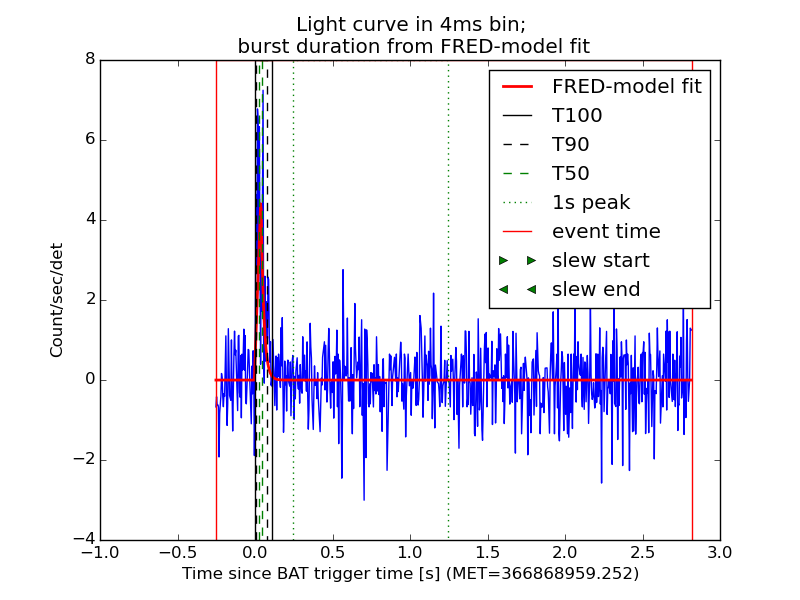
Duration (found by FRED-model fit)
T90: 0.072 +/- N/A
Measured from: 0.00800002
to: 0.08 [s; relative to TRIGTIME]
T50: 0.024 +/- N/A
Measured from: 0.024
to: 0.048
====== Table of the duration information =============================
Value tstart tstop
T100 0.108 0.000 0.108
T90 0.072 0.008 0.080
T50 0.024 0.024 0.048
Peak 1.000 -0.462 0.538
====== Spectral Analysis Summary =====================================
Model : spectral model: simple power-law (PL) and cutoff power-law (CPL)
Ph_index : photon index: E^{Ph_index}
Ph_90err : 90% error of the photon index
Epeak : Epeak in keV
Epeak_90err: 90% error of Epeak
Norm : normalization at 50 keV in both the PL model and CPL model
Nomr_90err : 90% error of the normalization
chi2 : Chi-Squared
dof : degree of freedo
=== Time-averaged spectral analysis ===
(Best model with acceptable fit: N/A)
Model Ph_index Ph_90err_low Ph_90err_hi Epeak Epeak_90err_low Epeak_90err_hi Norm Nomr_90err_low Norm_90err_hi chi2 dof
PL N/A N/A N/A - - - N/A N/A N/A N/A N/A
CPL N/A N/A N/A N/A N/A N/A N/A N/A N/A N/A N/A
=== 1-s peak spectral analysis ===
(Best model with acceptable fit: N/A)
Model Ph_index Ph_90err_low Ph_90err_hi Epeak Epeak_90err_low Epeak_90err_hi Norm Nomr_90err_low Norm_90err_hi chi2 dof
PL N/A N/A N/A - - - N/A N/A N/A N/A N/A
CPL N/A N/A N/A N/A N/A N/A N/A N/A N/A N/A N/A
=== Fluence/Peak Flux Summary ===
Model Band1 Band2 Band3 Band4 Band5 Total
15-25 25-50 50-100 100-350 15-150 15-350 keV
Fluence PL N/A N/A N/A N/A N/A N/A erg/cm2
Image
15.0-350.0 keV image (Event data with DETECTION mask)
#RAcent DECcent POSerr Theta  Phi  Peak_Cts  SNR Name
8.310 -26.428 0.000 46.005 126.693 0.349 8.536 TRIG_00531259
Image time interval: 0.000 to 0.108 [sec]
Light Curves
Note: The mask-weighted lightcurves have units of either count/det or counts/sec/det, where a det is 0.4 x 0.4 = 0.16 sq cm.
Best duration plot
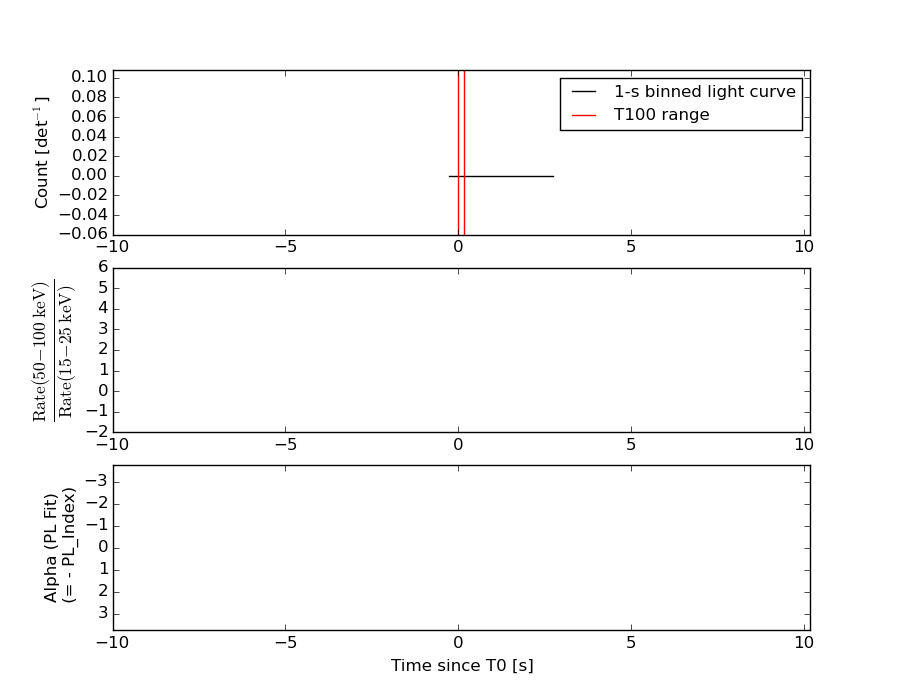
Full-time range; 1 s binning
Other quick-look light curves:
- 64 ms binning (zoomed)
- 16 ms binning (zoomed)
- 8 ms binning (zoomed)
- 2 ms binning (zoomed)
- SN=5 or 10 s binning (full-time range)
- Raw light curve
Spectra
- 64 ms binning (zoomed)
- 16 ms binning (zoomed)
- 8 ms binning (zoomed)
- 2 ms binning (zoomed)
- SN=5 or 10 s binning (full-time range)
- Raw light curve
Spectra
Notes:
- 1) The fitting includes the systematic errors.
- 2) When the burst includes telescope slew time periods, the fitting uses an average response file made from multiple 5-s response files through out the slew time plus single time preiod for the non-slew times, and weighted by the total counts in the corresponding time period using addrmf. An average response file is needed becuase a spectral fit using the pre-slew DRM will introduce some errors in both a spectral shape and a normalization if the PHA file contains a lot of the slew/post-slew time interval.
- 3) For fits to more complicated models (e.g. a power-law over a cutoff power-law), the BAT team has decided to require a chi-square improvement of more than 6 for each extra dof.
Time averaged spectrum fit using the average DRM
Power-law model

Multiple GTIs in the spectrum
tstart tstop
Photon index:       (       )
Cutoff power-law model

Multiple GTIs in the spectrum
tstart tstop
Photon index:       (       )
1-s peak spectrum fit
Power-law model

Time interval is from   -0.252 sec. to    2.818 sec.
Photon index:       (       )
Cutoff power-law model

Time interval is from   -0.252 sec. to    2.818 sec.
Photon index:       (       )
Time-resolved spectra
Distribution
T90 vs. Hardness ratio plot
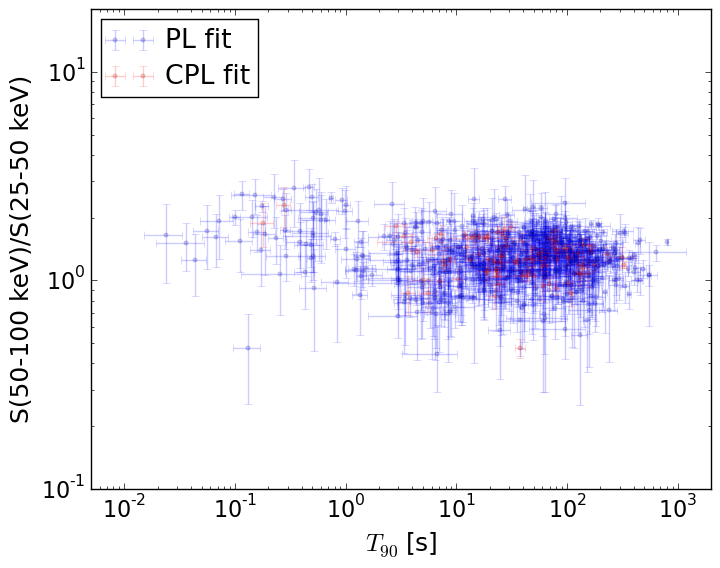
T90                                   = N/A sec.
Hardness ratio (energy fluence ratio) = N/A
S(15-50 keV) vs. S(50-150 keV) plot
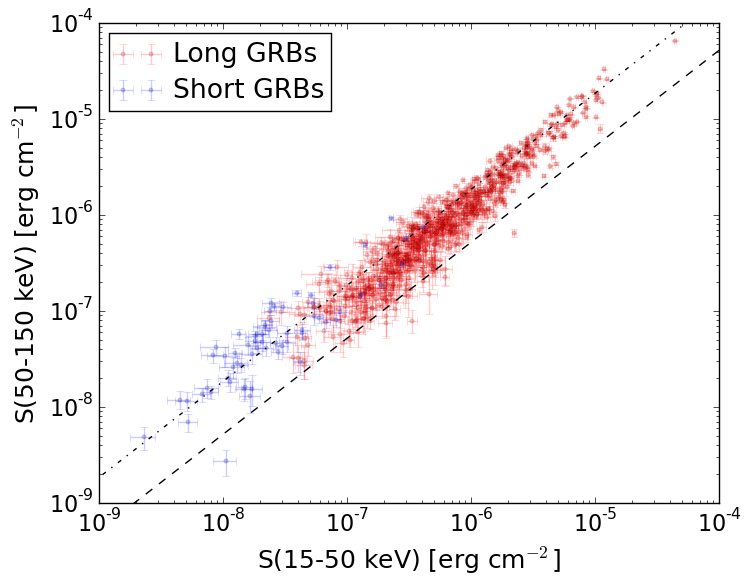
S(15-50 keV)  = N/A
S(50-150 keV) = N/A
The dash-dotted line and the dashed line traces the fluences calculated from the Band function with Epeak = 15 and 150 keV, respectively. Both lines assume a canonical values of alpha = -1 and beta = -2.5.
Mask shadow pattern (with DETECTION mask)
IMX = -0.61887045537, IMY = -0.83050126764
Spacecraft aspect plot
Bright source in the event data image
Event data image of 15-350 keV band
Time interval of the image:
-0.252000 2.818000

# RAcent  DECcent POSerr Theta    Phi  PeakCts   SNR AngSep     Name
#  [deg]    [deg]    ['] [deg]  [deg]                   [']
170.2118 -60.7761    0.0  45.9  -62.4  -0.0512  -0.6    9.7	Cen X-3
186.8174 -62.7614    7.2  44.8  -51.2   0.0679   1.6    4.4	GX 301-2
264.7748 -44.6053    5.6  53.2   10.6   0.1251   2.1    9.4	4U 1735-44
 10.2764 -41.9410    2.4  30.4  128.4   0.1101   4.8 ------	UNKNOWN
 55.5938 -33.9169    2.1  44.1 -173.7   0.1486   5.4 ------	UNKNOWN
Webpage updated on:
Thu Dec 17 16:43:09 EST 2015