Analysis Summary
Notes:
- 1) No attempt has been made to eliminate the non-significant decimal places.
- 2) This batgrbproduct analysis is done using the HEASARC data.
- 3) This batgrbproduct analysis is using the flight position for the mask-weighting calculation.
======================================================================
BAT GRB EVENT DATA PROCESSING REPORT
Process Script Ver: batgrbproduct v2.46
Process Start Time: Thu Jun 11 22:39:55 EDT 2015
Host Name: bat1
Current Working Dir: /local/data/bat1/alien/Swift_3rdBATcatalog/event/batevent_reproc/trigger531428
======================================================================
Trigger: 00531428 Segment: 000
BAT Trigger Time: 367074624 [s; MET]
Trigger Stop: 367074696 [s; MET]
UTC: 2012-08-19T13:10:14.445520 [includes UTCF correction]
Where From?: TDRSS position message
BAT
RA: 235.887635135529 Dec: -7.30488686709695 [deg; J2000]
Catalogged Source?: NO
Point Source?: YES
GRB Indicated?: YES [ by BAT flight software ]
Image S/N Ratio: 7.61
Image Trigger?: YES
Rate S/N Ratio: 0 [ if not an image trigger ]
Image S/N Ratio: 7.61
Analysis Position: [ source = BAT ]
RA: 235.887635135529 Dec: -7.30488686709695 [deg; J2000]
Refined Position: [ source = BAT pre-slew burst ]
RA: 235.879923719611 Dec: -7.29881705637643 [deg; J2000]
{ 15h 43m 31.2s , -07d 17' 55.7" }
+/- 2.23634410683237 [arcmin] (estimated 90% radius based on SNR)
+/- 1.28343333246984 [arcmin] (formal 1-sigma fit error)
SNR: 9.63335313855334
Angular difference between the analysis and refined position is 0.585878 arcmin
Partial Coding Fraction: 0.3085938 [ including projection effects ]
Duration
T90: 71.0199999809265 +/- 17.3326166382544
Measured from: 5.66399997472763
to: 76.6839999556541 [s; relative to TRIGTIME]
T50: 27.755999982357 +/- 15.0192393376962
Measured from: 14.8799999952316
to: 42.6359999775887 [s; relative to TRIGTIME]
Fluence
Peak Flux (peak 1 second)
Measured from: 6.19599997997284
to: 7.19599997997284 [s; relative to TRIGTIME]
Total Fluence
Measured from: 4.4200000166893
to: 83.0120000243187 [s; relative to TRIGTIME]
Band 1 Band 2 Band 3 Band 4
15-25 25-50 50-100 100-350 keV
Total 0.428290 0.795839 0.595127 0.226233
0.107100 0.096783 0.082591 0.074119 [error]
Peak 0.020453 0.021202 0.041349 0.022462
0.012478 0.011545 0.010346 0.009223 [error]
[ fluence units of on-axis counts / fully illuminated detector ]
======================================================================
====== Table of the duration information =============================
Value tstart tstop
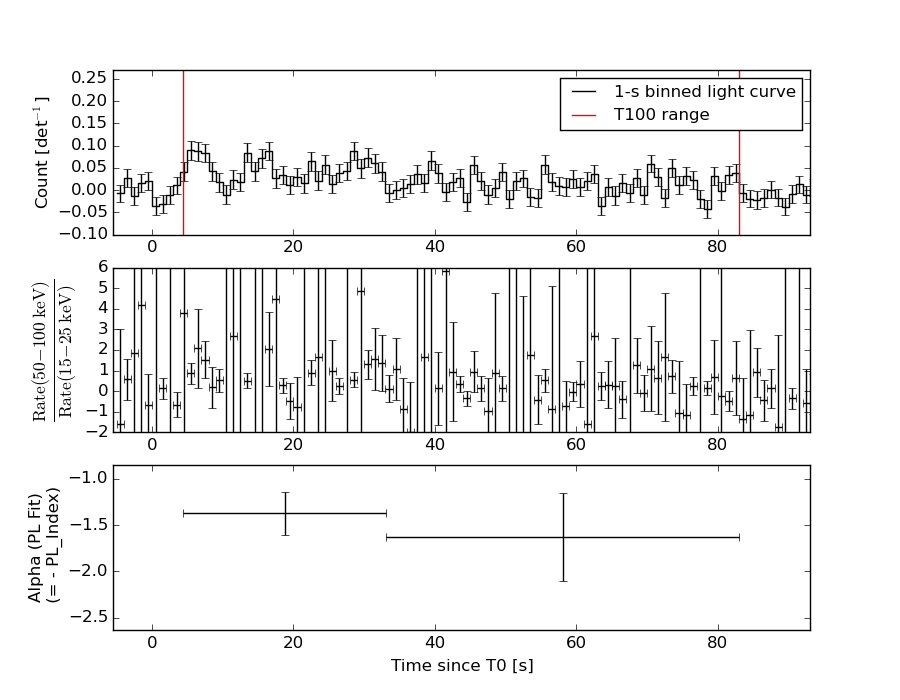
T100 78.592 4.420 83.012
T90 71.020 5.664 76.684
T50 27.756 14.880 42.636
Peak 1.000 6.196 7.196
====== Spectral Analysis Summary =====================================
Model : spectral model: simple power-law (PL) and cutoff power-law (CPL)
Ph_index : photon index: E^{Ph_index}
Ph_90err : 90% error of the photon index
Epeak : Epeak in keV
Epeak_90err: 90% error of Epeak
Norm : normalization at 50 keV in both the PL model and CPL model
Nomr_90err : 90% error of the normalization
chi2 : Chi-Squared
dof : degree of freedo
=== Time-averaged spectral analysis ===
(Best model with acceptable fit: PL)
Model Ph_index Ph_90err_low Ph_90err_hi Epeak Epeak_90err_low Epeak_90err_hi Norm Nomr_90err_low Norm_90err_hi chi2 dof
PL -1.478 -0.228 0.230 - - - 1.88e-03 -2.49e-04 2.48e-04 48.720 57
CPL -0.511 -1.039 1.473 76.110 -21.348 -76.110 5.76e-03 -5.76e-03 2.55e-02 46.370 56
=== 1-s peak spectral analysis ===
(Best model with acceptable fit: PL)
Model Ph_index Ph_90err_low Ph_90err_hi Epeak Epeak_90err_low Epeak_90err_hi Norm Nomr_90err_low Norm_90err_hi chi2 dof
PL -0.785 -0.622 0.752 - - - 6.63e-03 -2.70e-03 2.47e-03 61.230 57
CPL -0.421 0.421 7.059 303.112 -303.112 -303.112 8.87e-03 -4.75e-03 6.48e-01 61.180 56
=== Fluence/Peak Flux Summary ===
Model Band1 Band2 Band3 Band4 Band5 Total
15-25 25-50 50-100 100-350 15-150 15-350 keV
Fluence PL 1.84e-07 3.43e-07 4.93e-07 1.50e-06 1.40e-06 2.52e-06 erg/cm2
90%_error_low -4.21e-08 -4.98e-08 -8.12e-08 -4.70e-07 -1.99e-07 -5.40e-07 erg/cm2
90%_error_hi 4.51e-08 4.92e-08 8.06e-08 6.03e-07 2.00e-07 6.44e-07 erg/cm2
Peak flux PL 1.38e-01 2.14e-01 2.48e-01 5.53e-01 7.63e-01 1.15e+00 ph/cm2/s
90%_error_low -9.54e-02 -1.11e-01 -7.95e-02 -3.15e-01 -2.74e-01 -3.84e-01 ph/cm2/s
90%_error_hi 1.45e-01 1.14e-01 7.95e-02 5.55e-01 2.87e-01 4.52e-01 ph/cm2/s
Fluence CPL 1.56e-07 3.75e-07 5.14e-07 4.39e-07 1.30e-06 1.48e-06 erg/cm2
90%_error_low -5.20e-08 -6.18e-08 -9.30e-08 -3.15e-07 -2.34e-07 -3.92e-07 erg/cm2
90%_error_hi 5.45e-08 6.57e-08 9.28e-08 1.21e-06 2.35e-07 1.24e-06 erg/cm2
Peak flux CPL 1.18e-01 2.09e-01 2.58e-01 4.28e-01 7.44e-01 1.04e+00 ph/cm2/s
90%_error_low -1.18e-01 -2.09e-01 -8.91e-02 -4.28e-01 -3.11e-01 -5.87e-01 ph/cm2/s
90%_error_hi 1.61e-01 1.19e-01 1.20e-01 6.49e-01 3.01e-01 3.10e-01 ph/cm2/s
======================================================================
Image
Pre-slew 15.0-350.0 keV image (Event data)
#   RAcent    DECcent   POSerr    Theta     Phi              Peak Cts       SNR   Name
  235.8799    -7.2988   0.0200    36.0466   -63.6585         2.0262079      9.633 TRIG_00531428

Foreground time interval of the image:
  4.420  82.701 (delta_t =  78.281 [sec])
Background time interval of the image:
-239.000   4.420 (delta_t = 243.420 [sec])
Light Curves
Note: The mask-weighted lightcurves have units of either count/det or counts/sec/det, where a det is 0.4 x 0.4 = 0.16 sq cm.
Full-time range; 1 s binning
Other quick-look light curves:
- 64 ms binning (zoomed)
- 16 ms binning (zoomed)
- 8 ms binning (zoomed)
- 2 ms binning (zoomed)
- SN=5 or 10 s binning (full-time range)
- Raw light curve
Spectra
- 64 ms binning (zoomed)
- 16 ms binning (zoomed)
- 8 ms binning (zoomed)
- 2 ms binning (zoomed)
- SN=5 or 10 s binning (full-time range)
- Raw light curve
Spectra
Notes:
- 1) The fitting includes the systematic errors.
- 2) When the burst includes telescope slew time periods, the fitting uses an average response file made from multiple 5-s response files through out the slew time plus single time preiod for the non-slew times, and weighted by the total counts in the corresponding time period using addrmf. An average response file is needed becuase a spectral fit using the pre-slew DRM will introduce some errors in both a spectral shape and a normalization if the PHA file contains a lot of the slew/post-slew time interval.
- 3) For fits to more complicated models (e.g. a power-law over a cutoff power-law), the BAT team has decided to require a chi-square improvement of more than 6 for each extra dof.
Time averaged spectrum fit using the average DRM
Power-law model

Time interval is from    4.420 sec. to   83.012 sec.

Spectral model in power-law:
------------------------------------------------------------
Parameters  : value       lower 90%   higher 90%
Photon index: -1.47808     ( -0.227962   0.229509 )
Norm@50keV  : 1.87516E-03    ( -0.000248916   0.000248097 )
------------------------------------------------------------
#Fit statistic : Chi-Squared =          48.72 using 59 PHA bins.
# Reduced chi-squared =         0.8548 for     57 degrees of freedom
# Null hypothesis probability =   7.742381e-01

Photon flux (15-150 keV)    in 78.59 sec: 0.232746 ( -0.032163  0.032351 ) ph/cm2/s
Energy fluence (15-150 keV)             : 1.40336e-06 ( -1.98607e-07  2.00431e-07 ) ergs/cm2
Cutoff power-law model
Time interval is from    4.420 sec. to   83.012 sec.
Spectral model in the cutoff power-law:
------------------------------------------------------------
Parameters  : value       lower 90%   higher 90%
Photon index: -0.510698     ( -1.03926   1.47289 )
Epeak [keV] : 76.1100      ( -21.3352 -76.0972 )
Norm@50keV  : 5.76092E-03    ( -0.00576374   0.0255084 )
------------------------------------------------------------
#Fit statistic : Chi-Squared =          46.37 using 59 PHA bins.
# Reduced chi-squared =         0.8281 for     56 degrees of freedom
# Null hypothesis probability =   8.169389e-01

Photon flux (15-150 keV)    in 78.59 sec: 0.221587 ( -0.034869  0.034737 ) ph/cm2/s
Energy fluence (15-150 keV)             : 1.29585e-06 ( -2.3397e-07  2.35012e-07 ) ergs/cm2
1-s peak spectrum fit
Power-law model
Time interval is from    6.196 sec. to    7.196 sec.

Spectral model in power-law:
------------------------------------------------------------
Parameters  : value       lower 90%   higher 90%
Photon index: -0.785376     ( -0.621917   0.75154 )
Norm@50keV  : 6.63171E-03    ( -0.00270321   0.0024707 )
------------------------------------------------------------
#Fit statistic : Chi-Squared =          61.23 using 59 PHA bins.
# Reduced chi-squared =          1.074 for     57 degrees of freedom
# Null hypothesis probability =   3.268856e-01

Photon flux (15-150 keV)    in 1 sec: 0.762617 ( -0.274311  0.287453 ) ph/cm2/s
Energy fluence (15-150 keV)             : 7.79848e-08 ( -2.54012e-08  2.54818e-08 ) ergs/cm2
Cutoff power-law model

Time interval is from    6.196 sec. to    7.196 sec.
Spectral model in the cutoff power-law:
------------------------------------------------------------
Parameters  : value       lower 90%   higher 90%
Photon index: -0.42098     ( 0.419057   7.05757 )
Epeak [keV] : 303.112      ( -301.78 -301.78 )
Norm@50keV  : 8.86597E-03    ( -0.00476452   0.647968 )
------------------------------------------------------------
#Fit statistic : Chi-Squared =          61.18 using 59 PHA bins.
# Reduced chi-squared =          1.092 for     56 degrees of freedom
# Null hypothesis probability =   2.954967e-01

Photon flux (15-150 keV)    in 1 sec: 0.744212 ( -0.310609  0.300918 ) ph/cm2/s
Energy fluence (15-150 keV)             : 7.74373e-08 ( -2.63774e-08  2.57937e-08 ) ergs/cm2
Time-resolved spectra
Distribution
T90 vs. Hardness ratio plot
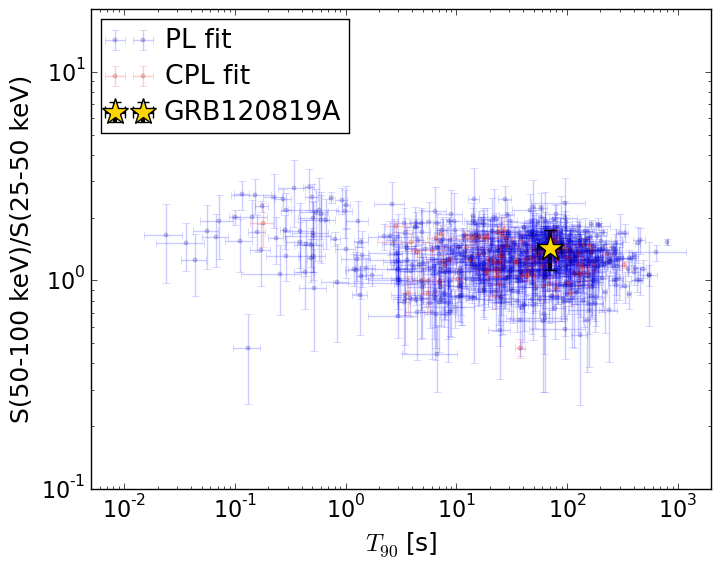
T90                                   = 71.02 sec.
Hardness ratio (energy fluence ratio) = 1.43591912515
S(15-50 keV) vs. S(50-150 keV) plot
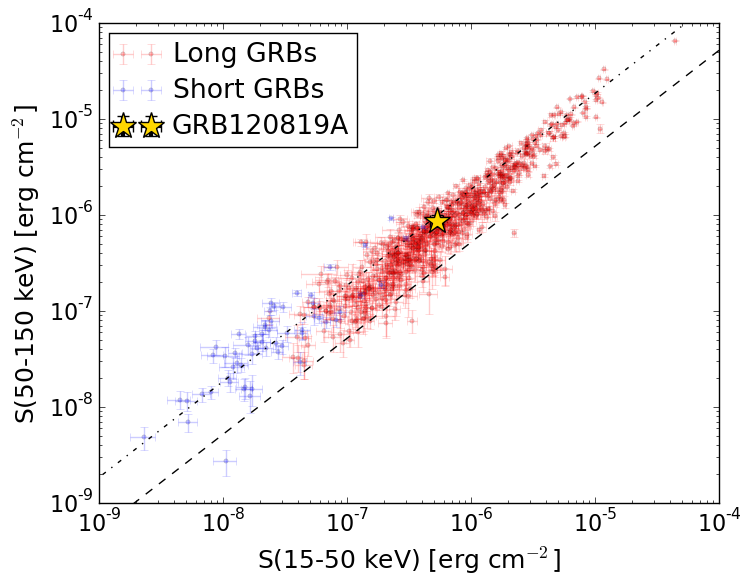
S(15-50 keV)  = 5.276582e-07
S(50-150 keV) = 8.757094e-07
The dash-dotted line and the dashed line traces the fluences calculated from the Band function with Epeak = 15 and 150 keV, respectively. Both lines assume a canonical values of alpha = -1 and beta = -2.5.
Mask shadow pattern
IMX = 3.229335019026143E-01, IMY = 6.522179006549594E-01
Spacecraft aspect plot
Bright source in the pre-burst/pre-slew/post-slew images
Pre-burst image of 15-350 keV band
Time interval of the image:
-239.000000 4.420000

# RAcent  DECcent POSerr Theta    Phi  PeakCts   SNR AngSep     Name
#  [deg]    [deg]    ['] [deg]  [deg]                   [']
244.9919 -15.6350    0.4  24.8  -73.2   9.8777  32.5    0.8	Sco X-1
254.3758  35.2345    5.8  57.6   -5.5   2.6508   2.0    7.6	Her X-1
255.9831 -37.8446    0.3  21.7 -137.0  10.0332  41.0    0.2	4U 1700-377
256.2726 -36.2811   36.4  20.4 -134.7   0.0747   0.3   11.6	GX 349+2
263.0478 -24.7931   11.7   8.3 -114.0   0.2276   1.0    3.6	GX 1+4
264.9683 -44.5840    0.0  24.8 -160.1   0.1218   0.5   12.6	4U 1735-44
268.3804  -1.5138    4.1  18.9    3.3   0.6556   2.8    3.7	SW J1753.5-0127
270.2865 -25.0413    2.4   4.8 -166.0   1.0366   4.7    2.3	GX 5-1
270.2052 -25.7159    7.9   5.5 -165.7   0.3212   1.5    5.5	GRS 1758-258
273.9080 -14.0526    3.7   7.0   37.5   0.7172   3.2    5.8	GX 17+2
275.8761 -30.2496    6.7  11.0  165.9   0.3857   1.7    7.5	H1820-303
284.9699 -25.0891    7.9  14.1  122.9   0.3344   1.5   10.7	HT1900.1-2455
288.8131  10.9489    1.3  36.0   41.7   3.9474   8.7    0.9	GRS 1915+105
263.1889 -33.9669    0.0  15.2 -145.6   0.2957   1.4   12.7	GX 354-0
Pre-slew background subtracted image of 15-350 keV band
Time interval of the image:
4.420000 82.700600

# RAcent  DECcent POSerr Theta    Phi  PeakCts   SNR AngSep     Name
#  [deg]    [deg]    ['] [deg]  [deg]                   [']
245.1329 -15.5553    5.9  24.7  -72.9  -0.2755  -2.0   10.2	Sco X-1
254.4616  35.4128    3.6  57.8   -5.3   1.9908   3.2    4.2	Her X-1
256.0193 -37.9116    2.5  21.7 -137.2   0.5192   4.6    4.3	4U 1700-377
256.4486 -36.4203    4.6  20.4 -135.2   0.2827   2.5    0.7	GX 349+2
263.1650 -24.6753    4.4   8.2 -113.7   0.2855   2.6    9.5	GX 1+4
264.9683 -44.5840    0.0  24.8 -160.1  -0.2232  -1.9   12.6	4U 1735-44
268.2442  -1.5683   43.8  18.8    2.8  -0.0285  -0.3   10.2	SW J1753.5-0127
270.4105 -25.0334   11.8   4.8 -167.4  -0.1089  -1.0    7.4	GX 5-1
270.4953 -25.8644    0.0   5.6 -168.5   0.0489   0.4   12.7	GRS 1758-258
273.9409 -14.2010    5.3   6.8   38.3  -0.2215  -2.2   10.6	GX 17+2
276.1006 -30.3707    5.5  11.2  165.3  -0.2180  -2.1    9.1	H1820-303
285.1839 -24.8468    4.6  14.2  121.8   0.2760   2.5    9.2	HT1900.1-2455
288.8812  10.8548    3.6  35.9   41.9   0.6059   3.3    7.3	GRS 1915+105
262.7931 -33.7233    7.3  15.1 -144.0  -0.1711  -1.6   11.8	GX 354-0
259.9685 -30.3088    2.6  13.9 -128.1   0.4902   4.5 ------	UNKNOWN
235.8799  -7.2988    1.2  36.0  -63.7   2.0269   9.6 ------	UNKNOWN
237.1587  23.6038    3.0  54.7  -28.0   1.7362   3.9 ------	UNKNOWN
Post-slew image of 15-350 keV band
Time interval of the image:
140.300620 317.700640

# RAcent  DECcent POSerr Theta    Phi  PeakCts   SNR AngSep     Name
#  [deg]    [deg]    ['] [deg]  [deg]                   [']
244.9802 -15.6356    0.3  12.2  121.3   7.0229  41.3    0.3	Sco X-1
254.4362  35.3569    2.2  46.1    8.4   1.8784   5.2    1.4	Her X-1
255.9744 -37.8582    0.6  35.5  139.6   6.2465  19.4    1.0	4U 1700-377
256.6068 -36.3633    4.4  34.7  137.3   0.8321   2.6    9.0	GX 349+2
262.9938 -24.6152    7.3  31.1  114.2   0.4785   1.6    7.9	GX 1+4
264.6891 -44.5252    5.5  44.8  138.2   1.3530   2.1    5.1	4U 1735-44
268.4622  -1.3461    4.7  33.0   68.5   0.8074   2.4    8.5	SW J1753.5-0127
270.2484 -24.9569    6.2  37.2  109.7   0.8310   1.9    7.6	GX 5-1
270.4801 -25.6320   11.4  37.7  110.5  -0.4780  -1.0   11.7	GRS 1758-258
274.0056 -14.0362  609.1  38.0   90.8  -0.0117  -0.0    0.0	GX 17+2
263.1493 -33.8896   19.2  36.6  127.8  -0.2388  -0.6    8.6	GX 354-0
272.0099 -27.5569    2.7  39.7  112.5   2.6250   4.3 ------	UNKNOWN
243.4426  50.5060    2.3  58.2   -7.0   4.6057   5.0 ------	UNKNOWN
190.4369 -50.5870    3.9  57.3 -160.1   2.9897   3.0 ------	UNKNOWN
195.8653   1.1322    3.1  40.8  -92.4   3.3326   3.7 ------	UNKNOWN