Analysis Summary
Notes:
- 1) No attempt has been made to eliminate the non-significant decimal places.
- 2) This batgrbproduct analysis is done using the HEASARC data.
- 3) This batgrbproduct analysis is using the flight position for the mask-weighting calculation.
======================================================================
BAT GRB EVENT DATA PROCESSING REPORT
Process Script Ver: batgrbproduct v2.46
Process Start Time: Mon Jan 13 01:10:52 EST 2014
Host Name: batevent1
Current Working Dir: /local/data/batevent/batevent_reproc/trigger532871
======================================================================
Trigger: 00532871 Segment: 000
BAT Trigger Time: 368670272.704 [s; MET]
Trigger Stop: 368670273.728 [s; MET]
UTC: 2012-09-07T00:24:23.082500 [includes UTCF correction]
Where From?: TDRSS position message
BAT
RA: 74.741267312283 Dec: -9.31372697920963 [deg; J2000]
Catalogged Source?: NO
Point Source?: YES
GRB Indicated?: YES [ by BAT flight software ]
Image S/N Ratio: 11.33
Image Trigger?: NO
Rate S/N Ratio: 15.4919333848297 [ if not an image trigger ]
Image S/N Ratio: 11.33
Analysis Position: [ source = BAT ]
RA: 74.741267312283 Dec: -9.31372697920963 [deg; J2000]
Refined Position: [ source = BAT pre-slew burst ]
RA: 74.7510327743971 Dec: -9.31834471955395 [deg; J2000]
{ 04h 59m 00.2s , -09d 19' 06.0" }
+/- 1.81054103040935 [arcmin] (estimated 90% radius based on SNR)
+/- 0.678600934064407 [arcmin] (formal 1-sigma fit error)
SNR: 13.0262889292652
Angular difference between the analysis and refined position is 0.641155 arcmin
Partial Coding Fraction: 0.2128906 [ including projection effects ]
Duration
T90: 6.08000004291534 +/- 0.784652758243599
Measured from: 0.120000004768372
to: 6.20000004768372 [s; relative to TRIGTIME]
T50: 2.65600007772446 +/- 1.5783535763625
Measured from: 0.727999985218048
to: 3.3840000629425 [s; relative to TRIGTIME]
Fluence
Peak Flux (peak 1 second)
Measured from: 0.107999980449677
to: 1.10799998044968 [s; relative to TRIGTIME]
Total Fluence
Measured from: -0.0239999890327454
to: 6.93599998950958 [s; relative to TRIGTIME]
Band 1 Band 2 Band 3 Band 4
15-25 25-50 50-100 100-350 keV
Total 0.253733 0.395081 0.235808 0.069745
0.032639 0.034745 0.031863 0.029996 [error]
Peak 0.079617 0.129969 0.102576 0.043512
0.013795 0.015064 0.013891 0.011783 [error]
[ fluence units of on-axis counts / fully illuminated detector ]
======================================================================
====== Table of the duration information =============================
Value tstart tstop
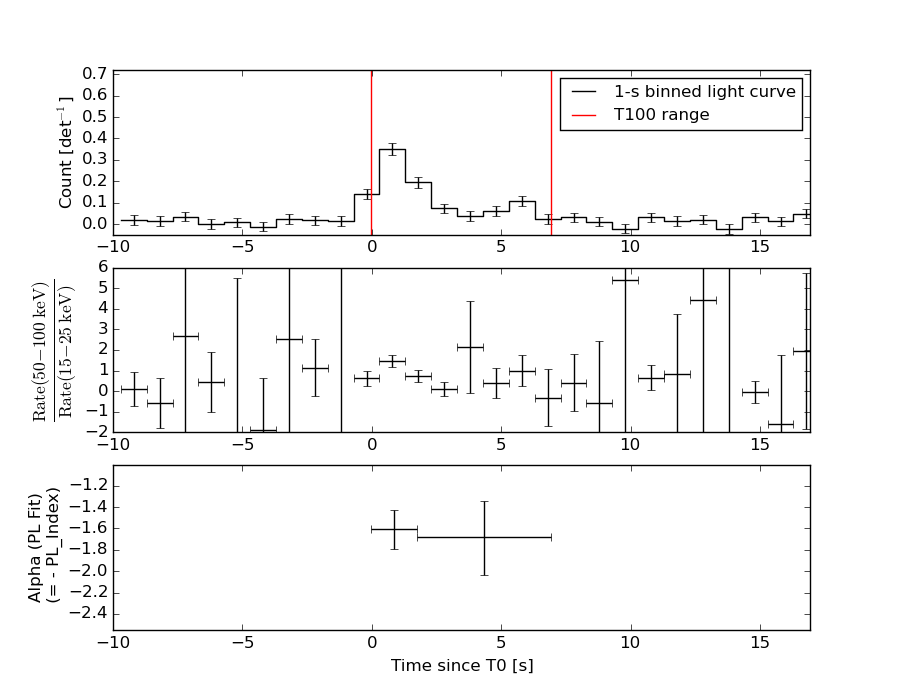
T100 6.960 -0.024 6.936
T90 6.080 0.120 6.200
T50 2.656 0.728 3.384
Peak 1.000 0.108 1.108
====== Spectral Analysis Summary =====================================
Model : spectral model: simple power-law (PL) and cutoff power-law (CPL)
Ph_index : photon index: E^{Ph_index}
Ph_90err : 90% error of the photon index
Epeak : Epeak in keV
Epeak_90err: 90% error of Epeak
Norm : normalization at 50 keV in both the PL model and CPL model
Nomr_90err : 90% error of the normalization
chi2 : Chi-Squared
dof : degree of freedo
=== Time-averaged spectral analysis ===
(Best model with acceptable fit: PL)
Model Ph_index Ph_90err_low Ph_90err_hi Epeak Epeak_90err_low Epeak_90err_hi Norm Nomr_90err_low Norm_90err_hi chi2 dof
PL -1.652 -0.186 0.182 - - - 9.09e-03 -1.06e-03 1.05e-03 70.190 57
CPL -0.798 -0.837 1.117 62.998 -15.558 393.682 2.68e-02 -2.68e-02 8.51e-02 67.170 56
=== 1-s peak spectral analysis ===
(Best model with acceptable fit: PL)
Model Ph_index Ph_90err_low Ph_90err_hi Epeak Epeak_90err_low Epeak_90err_hi Norm Nomr_90err_low Norm_90err_hi chi2 dof
PL -1.389 -0.216 0.216 - - - 2.36e-02 -2.98e-03 2.98e-03 61.130 57
CPL -1.301 -1.695 0.767 411.019 -411.019 -411.019 2.61e-02 -2.61e-02 3.47e-02 61.170 56
=== Fluence/Peak Flux Summary ===
Model Band1 Band2 Band3 Band4 Band5 Total
15-25 25-50 50-100 100-350 15-150 15-350 keV
Fluence PL 9.32e-08 1.56e-07 1.99e-07 5.06e-07 5.88e-07 9.54e-07 erg/cm2
90%_error_low -1.52e-08 -1.69e-08 -3.06e-08 -1.43e-07 -7.26e-08 -1.75e-07 erg/cm2
90%_error_hi 1.57e-08 1.68e-08 3.07e-08 1.76e-07 7.36e-08 2.01e-07 erg/cm2
Peak flux PL 8.71e-01 9.37e-01 7.16e-01 8.92e-01 2.86e+00 3.42e+00 ph/cm2/s
90%_error_low -1.92e-01 -1.33e-01 -1.10e-01 -2.53e-01 -3.71e-01 -4.37e-01 ph/cm2/s
90%_error_hi 2.04e-01 1.31e-01 1.08e-01 3.07e-01 3.72e-01 4.40e-01 ph/cm2/s
Fluence CPL 8.47e-08 1.73e-07 1.99e-07 1.43e-07 5.41e-07 5.99e-07 erg/cm2
90%_error_low -1.77e-08 -2.35e-08 -3.73e-08 -1.01e-07 -8.51e-08 -1.33e-07 erg/cm2
90%_error_hi 1.78e-08 2.52e-08 3.47e-08 3.45e-07 8.70e-08 3.46e-07 erg/cm2
Peak flux CPL 8.72e-01 9.37e-01 7.16e-01 8.91e-01 2.86e+00 3.41e+00 ph/cm2/s
90%_error_low -1.93e-01 -1.32e-01 -1.09e-01 -5.33e-01 -3.71e-01 -6.74e-01 ph/cm2/s
90%_error_hi 1.65e-01 1.50e-01 1.26e-01 1.70e-01 3.71e-01 4.33e-01 ph/cm2/s
======================================================================
Image
Pre-slew 15.0-350.0 keV image (Event data)
#   RAcent    DECcent   POSerr    Theta     Phi              Peak Cts       SNR   Name
   74.7510    -9.3183   0.0148    37.6510   -70.5494         0.9746455     13.026 TRIG_00532871

Foreground time interval of the image:
 -0.024   6.936 (delta_t =   6.960 [sec])
Background time interval of the image:
-239.704  -0.024 (delta_t = 239.680 [sec])
Light Curves
Note: The mask-weighted lightcurves have units of either count/det or counts/sec/det, where a det is 0.4 x 0.4 = 0.16 sq cm.
Full-time range; 1 s binning
Other quick-look light curves:
- 64 ms binning (zoomed)
- 16 ms binning (zoomed)
- 8 ms binning (zoomed)
- 2 ms binning (zoomed)
- SN=5 or 10 s binning (full-time range)
- Raw light curve
Spectra
- 64 ms binning (zoomed)
- 16 ms binning (zoomed)
- 8 ms binning (zoomed)
- 2 ms binning (zoomed)
- SN=5 or 10 s binning (full-time range)
- Raw light curve
Spectra
Notes:
- 1) The fitting includes the systematic errors.
- 2) When the burst includes telescope slew time periods, the fitting uses an average response file made from multiple 5-s response files through out the slew time plus single time preiod for the non-slew times, and weighted by the total counts in the corresponding time period using addrmf. An average response file is needed becuase a spectral fit using the pre-slew DRM will introduce some errors in both a spectral shape and a normalization if the PHA file contains a lot of the slew/post-slew time interval.
- 3) For fits to more complicated models (e.g. a power-law over a cutoff power-law), the BAT team has decided to require a chi-square improvement of more than 6 for each extra dof.
Time averaged spectrum fit using the average DRM
Power-law model
Time interval is from   -0.024 sec. to    6.936 sec.

Spectral model in power-law:
------------------------------------------------------------
Parameters  : value       lower 90%   higher 90%
Photon index: -1.65219     ( -0.186432   0.181809 )
Norm@50keV  : 9.08508E-03    ( -0.00106275   0.00104959 )
------------------------------------------------------------
#Fit statistic : Chi-Squared =          70.19 using 59 PHA bins.
# Reduced chi-squared =          1.231 for     57 degrees of freedom
# Null hypothesis probability =   1.126069e-01

Photon flux (15-150 keV)    in 6.96 sec: 1.18719 ( -0.12803  0.12811 ) ph/cm2/s
Energy fluence (15-150 keV)             : 5.88043e-07 ( -7.26137e-08  7.36229e-08 ) ergs/cm2
Cutoff power-law model
Time interval is from   -0.024 sec. to    6.936 sec.
Spectral model in the cutoff power-law:
------------------------------------------------------------
Parameters  : value       lower 90%   higher 90%
Photon index: -0.797536     ( -0.837134   1.11722 )
Epeak [keV] : 62.9985      ( -15.55 393.69 )
Norm@50keV  : 2.68387E-02    ( -0.0268494   0.0850842 )
------------------------------------------------------------
#Fit statistic : Chi-Squared =          67.17 using 59 PHA bins.
# Reduced chi-squared =          1.199 for     56 degrees of freedom
# Null hypothesis probability =   1.457819e-01

Photon flux (15-150 keV)    in 6.96 sec: 1.14958 ( -0.13469  0.13392 ) ph/cm2/s
Energy fluence (15-150 keV)             : 5.41451e-07 ( -8.51208e-08  8.69534e-08 ) ergs/cm2
1-s peak spectrum fit
Power-law model

Time interval is from    0.108 sec. to    1.108 sec.

Spectral model in power-law:
------------------------------------------------------------
Parameters  : value       lower 90%   higher 90%
Photon index: -1.38869     ( -0.215815   0.21602 )
Norm@50keV  : 2.35565E-02    ( -0.00298107   0.00297546 )
------------------------------------------------------------
#Fit statistic : Chi-Squared =          61.13 using 59 PHA bins.
# Reduced chi-squared =          1.073 for     57 degrees of freedom
# Null hypothesis probability =   3.298810e-01

Photon flux (15-150 keV)    in 1 sec: 2.86151 ( -0.37116  0.37202 ) ph/cm2/s
Energy fluence (15-150 keV)             : 2.28176e-07 ( -3.1564e-08  3.17621e-08 ) ergs/cm2
Cutoff power-law model
Time interval is from    0.108 sec. to    1.108 sec.
Spectral model in the cutoff power-law:
------------------------------------------------------------
Parameters  : value       lower 90%   higher 90%
Photon index: -1.38549     ( -1.68663   0.77452 )
Epeak [keV] : 9997.29      ( -9997.38 -9997.38 )
Norm@50keV  : 2.36444E-02    ( -0.0236444   0.0371112 )
------------------------------------------------------------
#Fit statistic : Chi-Squared =          61.13 using 59 PHA bins.
# Reduced chi-squared =          1.092 for     56 degrees of freedom
# Null hypothesis probability =   2.968244e-01

Photon flux (15-150 keV)    in 1 sec: 2.86162 ( -0.37143  0.37066 ) ph/cm2/s
Energy fluence (15-150 keV)             : 2.28202e-07 ( -3.3249e-08  2.94183e-08 ) ergs/cm2
Time-resolved spectra
Distribution
T90 vs. Hardness ratio plot
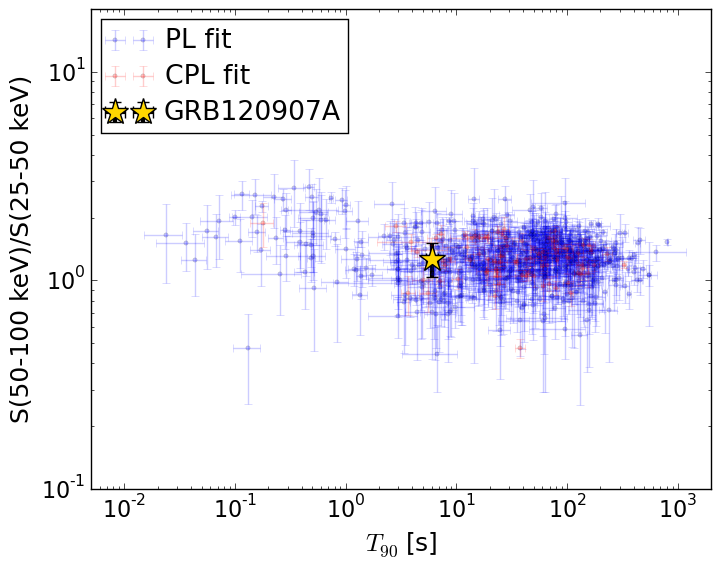
T90                                   = 6.08 sec.
Hardness ratio (energy fluence ratio) = 1.27265361381
S(15-50 keV) vs. S(50-150 keV) plot

S(15-50 keV)  = 2.4915299e-07
S(50-150 keV) = 3.388947e-07
The dash-dotted line and the dashed line traces the fluences calculated from the Band function with Epeak = 15 and 150 keV, respectively. Both lines assume a canonical values of alpha = -1 and beta = -2.5.
Mask shadow pattern
IMX = 2.569119331032302E-01, IMY = 7.274905239572595E-01
Spacecraft aspect plot
Bright source in the pre-burst/pre-slew/post-slew images
Pre-burst image of 15-350 keV band
Time interval of the image:
-239.704000 -0.024000

# RAcent  DECcent POSerr Theta    Phi  PeakCts   SNR AngSep     Name
#  [deg]    [deg]    ['] [deg]  [deg]                   [']
 10.1919 -10.1782    2.5  30.1   70.8   1.5198   4.6 ------	UNKNOWN
 26.9554 -14.2590    2.4  18.8   39.3   0.8959   4.7 ------	UNKNOWN
 26.7413  26.1649    2.9  27.7  160.1   0.8480   4.1 ------	UNKNOWN
 34.9967 -25.0582    2.5  26.1    9.8   0.8697   4.6 ------	UNKNOWN
 44.7235 -47.9740    3.2  49.1   -2.7   1.3718   3.6 ------	UNKNOWN
 44.4236 -43.5212    2.6  44.7   -3.3   1.4332   4.5 ------	UNKNOWN
 44.6915 -44.9998    3.4  46.2   -3.3   1.1751   3.4 ------	UNKNOWN
 60.6637 -24.9375    2.6  33.6  -35.5   1.0496   4.5 ------	UNKNOWN
 63.5253  54.4485    3.2  57.4 -160.0   3.7835   3.6 ------	UNKNOWN
 78.0400  30.4346    3.2  47.9 -129.1   2.9233   3.6 ------	UNKNOWN
 79.2359   4.6301    3.7  41.0  -93.1   2.7435   3.1 ------	UNKNOWN
Pre-slew background subtracted image of 15-350 keV band
Time interval of the image:
-0.024000 6.936000

# RAcent  DECcent POSerr Theta    Phi  PeakCts   SNR AngSep     Name
#  [deg]    [deg]    ['] [deg]  [deg]                   [']
 32.6308 -42.9180    2.3  44.1    9.0   0.2486   5.1 ------	UNKNOWN
 35.1525  57.7186    2.4  56.9 -179.1   0.7499   4.8 ------	UNKNOWN
 74.0538 -14.4557    1.8  38.5  -62.3   0.4222   6.3 ------	UNKNOWN
 74.7510  -9.3183    0.9  37.7  -70.5   0.9747  13.0 ------	UNKNOWN
Post-slew image of 15-350 keV band
Time interval of the image:
66.396590 962.386200

# RAcent  DECcent POSerr Theta    Phi  PeakCts   SNR AngSep     Name
#  [deg]    [deg]    ['] [deg]  [deg]                   [']
 83.6356  22.0131    0.2  32.5 -158.6  36.8640  57.5    0.2	Crab
 62.9917 -10.8144    2.5  11.6   87.5   2.4630   4.7 ------	UNKNOWN
123.0413 -38.2477    3.8  52.0  -42.2  10.0806   3.0 ------	UNKNOWN