Analysis Summary
Notes:
- 1) No attempt has been made to eliminate the non-significant decimal places.
- 2) This batgrbproduct analysis is done using the HEASARC data.
- 3) This batgrbproduct analysis is using the flight position for the mask-weighting calculation.
======================================================================
BAT GRB EVENT DATA PROCESSING REPORT
Process Script Ver: batgrbproduct v2.46
Process Start Time: Sun Nov 23 17:33:56 EST 2014
Host Name: bat1
Current Working Dir: /local/data/bat1/alien/Swift_3rdBATcatalog/event/batevent_reproc/trigger533060
======================================================================
Trigger: 00533060 Segment: 000
BAT Trigger Time: 368847732.864 [s; MET]
Trigger Stop: 368847734.272 [s; MET]
UTC: 2012-09-09T01:42:03.235040 [includes UTCF correction]
Where From?: TDRSS position message
BAT
RA: 275.684892653149 Dec: -59.4263133760398 [deg; J2000]
Catalogged Source?: NO
Point Source?: YES
GRB Indicated?: YES [ by BAT flight software ]
Image S/N Ratio: 7.77
Image Trigger?: NO
Rate S/N Ratio: 13 [ if not an image trigger ]
Image S/N Ratio: 7.77
Analysis Position: [ source = BAT ]
RA: 275.684892653149 Dec: -59.4263133760398 [deg; J2000]
Refined Position: [ source = BAT pre-slew burst ]
RA: 275.72523148817 Dec: -59.4389804814466 [deg; J2000]
{ 18h 22m 54.1s , -59d 26' 20.3" }
+/- 2.08641847400824 [arcmin] (estimated 90% radius based on SNR)
+/- 0.976648402226871 [arcmin] (formal 1-sigma fit error)
SNR: 10.6372811448241
Angular difference between the analysis and refined position is 1.446602 arcmin
Partial Coding Fraction: 0.4882812 [ including projection effects ]
Duration
T90: 220.595999956131 +/- 304.966835064435
Measured from: 253.227999985218
to: 473.823999941349 [s; relative to TRIGTIME]
T50: 114.503999948502 +/- 363.404444880196
Measured from: 297.243999958038
to: 411.74799990654 [s; relative to TRIGTIME]
Fluence
Peak Flux (peak 1 second)
Measured from: 0.899999976158142
to: 1.89999997615814 [s; relative to TRIGTIME]
Total Fluence
Measured from: -31.460000038147
to: 566.708000004292 [s; relative to TRIGTIME]
Band 1 Band 2 Band 3 Band 4
15-25 25-50 50-100 100-350 keV
Total 2.885854 3.884830 3.568242 1.009578
0.195425 0.200093 0.185861 0.190517 [error]
Peak 0.033339 0.076469 0.094177 0.023912
0.009553 0.010755 0.010425 0.010719 [error]
[ fluence units of on-axis counts / fully illuminated detector ]
======================================================================
====== Table of the duration information =============================
Value tstart tstop
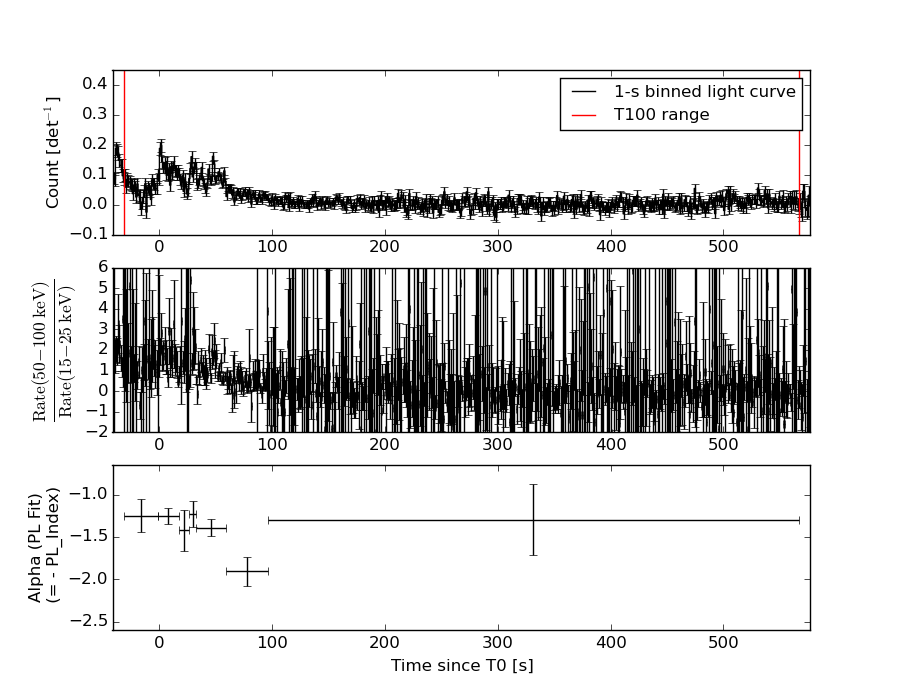
T100 598.168 -31.460 566.708
T90 220.596 253.228 473.824
T50 114.504 297.244 411.748
Peak 1.000 0.900 1.900
====== Spectral Analysis Summary =====================================
Model : spectral model: simple power-law (PL) and cutoff power-law (CPL)
Ph_index : photon index: E^{Ph_index}
Ph_90err : 90% error of the photon index
Epeak : Epeak in keV
Epeak_90err: 90% error of Epeak
Norm : normalization at 50 keV in both the PL model and CPL model
Nomr_90err : 90% error of the normalization
chi2 : Chi-Squared
dof : degree of freedo
=== Time-averaged spectral analysis ===
(Best model with acceptable fit: PL)
Model Ph_index Ph_90err_low Ph_90err_hi Epeak Epeak_90err_low Epeak_90err_hi Norm Nomr_90err_low Norm_90err_hi chi2 dof
PL -1.369 -0.100 0.101 - - - 1.29e-03 -7.00e-05 6.99e-05 48.110 57
CPL -1.284 -0.134 0.395 442.369 -442.369 -442.369 1.42e-03 -1.88e-04 7.49e-04 47.960 56
=== 1-s peak spectral analysis ===
(Best model with acceptable fit: PL)
Model Ph_index Ph_90err_low Ph_90err_hi Epeak Epeak_90err_low Epeak_90err_hi Norm Nomr_90err_low Norm_90err_hi chi2 dof
PL -1.015 -0.232 0.241 - - - 1.57e-02 -2.23e-03 2.22e-03 49.930 57
CPL 0.411 -1.184 1.679 97.758 -24.288 173.853 6.52e-02 -6.52e-02 2.35e-01 45.510 56
=== Fluence/Peak Flux Summary ===
Model Band1 Band2 Band3 Band4 Band5 Total
15-25 25-50 50-100 100-350 15-150 15-350 keV
Fluence PL 8.71e-07 1.73e-06 2.69e-06 9.13e-06 7.50e-06 1.44e-05 erg/cm2
90%_error_low -8.91e-08 -1.05e-07 -1.84e-07 -1.34e-06 -4.50e-07 -1.47e-06 erg/cm2
90%_error_hi 9.22e-08 1.05e-07 1.84e-07 1.50e-06 4.53e-07 1.60e-06 erg/cm2
Peak flux PL 4.07e-01 5.47e-01 5.41e-01 9.64e-01 1.81e+00 2.46e+00 ph/cm2/s
90%_error_low -1.10e-01 -9.68e-02 -8.13e-02 -2.74e-01 -2.61e-01 -3.64e-01 ph/cm2/s
90%_error_hi 1.21e-01 9.55e-02 8.06e-02 3.38e-01 2.62e-01 3.77e-01 ph/cm2/s
Fluence CPL 8.56e-07 1.75e-06 2.70e-06 8.01e-06 7.45e-06 1.33e-05 erg/cm2
90%_error_low -1.09e-07 -1.10e-07 -1.93e-07 -3.39e-06 -5.02e-07 -3.40e-06 erg/cm2
90%_error_hi 9.46e-08 1.19e-07 2.00e-07 3.21e-06 4.24e-07 1.57e-06 erg/cm2
Peak flux CPL 2.72e-01 5.73e-01 6.24e-01 3.39e-01 1.70e+00 1.81e+00 ph/cm2/s
90%_error_low -1.37e-01 -1.16e-01 -1.07e-01 -1.85e-01 -2.82e-01 -3.52e-01 ph/cm2/s
90%_error_hi 1.58e-01 1.13e-01 1.11e-01 4.41e-01 2.81e-01 5.01e-01 ph/cm2/s
======================================================================
Image
Pre-slew 15.0-350.0 keV image (Event data)
#   RAcent    DECcent   POSerr    Theta     Phi              Peak Cts       SNR   Name
  275.7252   -59.4390   0.0181    40.4914     4.1902         2.1358034     10.637 TRIG_00533060

Foreground time interval of the image:
-31.460  23.037 (delta_t =  54.497 [sec])
Background time interval of the image:
-60.864 -31.460 (delta_t =  29.404 [sec])
Light Curves
Note: The mask-weighted lightcurves have units of either count/det or counts/sec/det, where a det is 0.4 x 0.4 = 0.16 sq cm.
Full-time range; 1 s binning
Other quick-look light curves:
- 64 ms binning (zoomed)
- 16 ms binning (zoomed)
- 8 ms binning (zoomed)
- 2 ms binning (zoomed)
- SN=5 or 10 s binning (full-time range)
- Raw light curve
Spectra
- 64 ms binning (zoomed)
- 16 ms binning (zoomed)
- 8 ms binning (zoomed)
- 2 ms binning (zoomed)
- SN=5 or 10 s binning (full-time range)
- Raw light curve
Spectra
Notes:
- 1) The fitting includes the systematic errors.
- 2) When the burst includes telescope slew time periods, the fitting uses an average response file made from multiple 5-s response files through out the slew time plus single time preiod for the non-slew times, and weighted by the total counts in the corresponding time period using addrmf. An average response file is needed becuase a spectral fit using the pre-slew DRM will introduce some errors in both a spectral shape and a normalization if the PHA file contains a lot of the slew/post-slew time interval.
- 3) For fits to more complicated models (e.g. a power-law over a cutoff power-law), the BAT team has decided to require a chi-square improvement of more than 6 for each extra dof.
Time averaged spectrum fit using the average DRM
Power-law model

Time interval is from  -31.460 sec. to  566.708 sec.

Spectral model in power-law:
------------------------------------------------------------
Parameters  : value       lower 90%   higher 90%
Photon index: -1.36879     ( -0.100446   0.10073 )
Norm@50keV  : 1.28883E-03    ( -6.99931e-05   6.9938e-05 )
------------------------------------------------------------
#Fit statistic : Chi-Squared =          48.11 using 59 PHA bins.
# Reduced chi-squared =         0.8441 for     57 degrees of freedom
# Null hypothesis probability =   7.929164e-01

Photon flux (15-150 keV)    in 598.2 sec: 0.155882 ( -0.00881  0.008837 ) ph/cm2/s
Energy fluence (15-150 keV)             : 7.49975e-06 ( -4.50284e-07  4.52797e-07 ) ergs/cm2
Cutoff power-law model
Time interval is from  -31.460 sec. to  566.708 sec.
Spectral model in the cutoff power-law:
------------------------------------------------------------
Parameters  : value       lower 90%   higher 90%
Photon index: -1.28366     ( -0.134065   0.39524 )
Epeak [keV] : 442.369      ( -443.112 -443.112 )
Norm@50keV  : 1.41645E-03    ( -0.000188239   0.000749459 )
------------------------------------------------------------
#Fit statistic : Chi-Squared =          47.96 using 59 PHA bins.
# Reduced chi-squared =         0.8564 for     56 degrees of freedom
# Null hypothesis probability =   7.689805e-01

Photon flux (15-150 keV)    in 598.2 sec: 0.155117 ( -0.009402  0.009196 ) ph/cm2/s
Energy fluence (15-150 keV)             : 7.44968e-06 ( -5.02058e-07  4.24153e-07 ) ergs/cm2
1-s peak spectrum fit
Power-law model
Time interval is from    0.900 sec. to    1.900 sec.

Spectral model in power-law:
------------------------------------------------------------
Parameters  : value       lower 90%   higher 90%
Photon index: -1.01501     ( -0.232382   0.241091 )
Norm@50keV  : 1.56945E-02    ( -0.00222654   0.00221698 )
------------------------------------------------------------
#Fit statistic : Chi-Squared =          49.93 using 59 PHA bins.
# Reduced chi-squared =         0.8760 for     57 degrees of freedom
# Null hypothesis probability =   7.350502e-01

Photon flux (15-150 keV)    in 1 sec: 1.80843 ( -0.26107  0.26223 ) ph/cm2/s
Energy fluence (15-150 keV)             : 1.68834e-07 ( -2.51925e-08  2.53753e-08 ) ergs/cm2
Cutoff power-law model
Time interval is from    0.900 sec. to    1.900 sec.
Spectral model in the cutoff power-law:
------------------------------------------------------------
Parameters  : value       lower 90%   higher 90%
Photon index: 0.411103     ( -1.18398   1.67863 )
Epeak [keV] : 97.7577      ( -24.2854 173.856 )
Norm@50keV  : 6.52071E-02    ( -0.0652133   0.235029 )
------------------------------------------------------------
#Fit statistic : Chi-Squared =          45.51 using 59 PHA bins.
# Reduced chi-squared =         0.8126 for     56 degrees of freedom
# Null hypothesis probability =   8.406271e-01

Photon flux (15-150 keV)    in 1 sec: 1.69589 ( -0.28221  0.28059 ) ph/cm2/s
Energy fluence (15-150 keV)             : 1.38966e-08 ( 0  0 ) ergs/cm2
Time-resolved spectra
Distribution
T90 vs. Hardness ratio plot
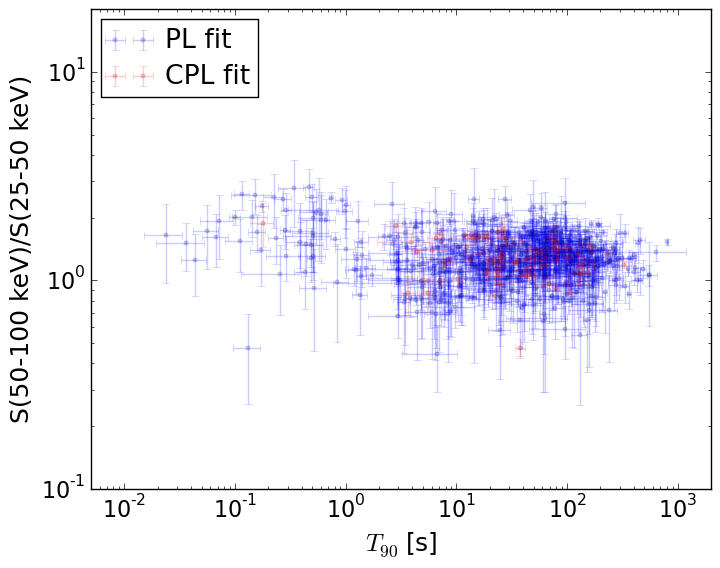
T90                                   = N/A sec.
Hardness ratio (energy fluence ratio) = N/A
S(15-50 keV) vs. S(50-150 keV) plot
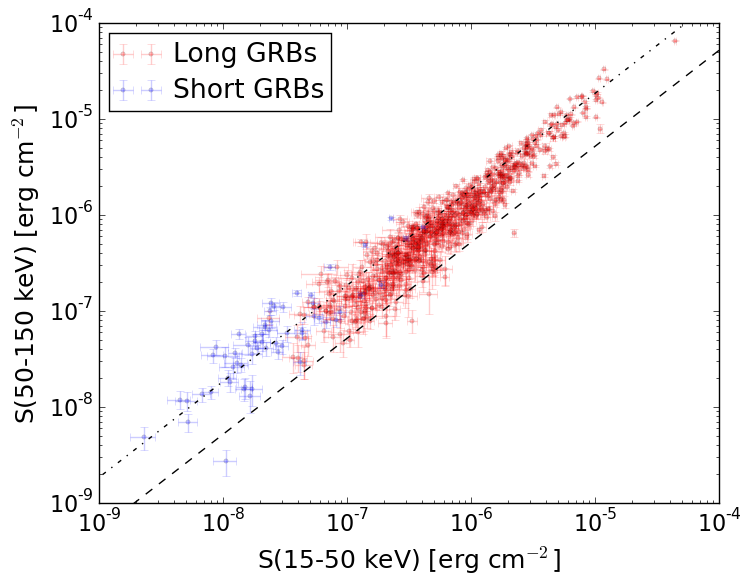
S(15-50 keV)  = N/A
S(50-150 keV) = N/A
The dash-dotted line and the dashed line traces the fluences calculated from the Band function with Epeak = 15 and 150 keV, respectively. Both lines assume a canonical values of alpha = -1 and beta = -2.5.
Mask shadow pattern

IMX = 8.515402123272447E-01, IMY = -6.238669160080063E-02
Spacecraft aspect plot
Bright source in the pre-burst/pre-slew/post-slew images
Pre-burst image of 15-350 keV band
Time interval of the image:
-60.864000 -31.460000

# RAcent  DECcent POSerr Theta    Phi  PeakCts   SNR AngSep     Name
#  [deg]    [deg]    ['] [deg]  [deg]                   [']
170.0549 -60.5389 2456.5  40.8  -71.3  -0.0006  -0.0    9.2	Cen X-3
186.9783 -62.7919   26.9  40.7  -58.5   0.0513   0.4    8.9	GX 301-2
264.7704 -44.4074    5.0  56.8    1.1   0.6370   2.3    2.8	4U 1735-44
275.7364 -59.4338    0.6  40.5    4.2   1.3449  17.7 ------	UNKNOWN
101.7010 -29.1276    2.9  55.1 -145.1   1.0798   3.9 ------	UNKNOWN
Pre-slew background subtracted image of 15-350 keV band
Time interval of the image:
-31.460000 23.036600

# RAcent  DECcent POSerr Theta    Phi  PeakCts   SNR AngSep     Name
#  [deg]    [deg]    ['] [deg]  [deg]                   [']
170.2582 -60.5920   16.9  40.8  -71.1   0.2754   0.7    2.5	Cen X-3
186.6956 -62.6996    6.5  40.7  -58.7   0.6117   1.8    4.4	GX 301-2
264.6946 -44.4251   10.2  56.8    1.0  -0.8679  -1.1    2.6	4U 1735-44
275.7300 -59.4379    1.1  40.5    4.2   2.1896  10.9 ------	UNKNOWN
209.9058 -58.2303    2.7  46.6  -43.2   1.5507   4.3 ------	UNKNOWN
139.2037 -53.8083    2.9  41.3  -98.5   2.1410   3.9 ------	UNKNOWN
123.0414 -46.3574    2.4  44.3 -116.8   2.8270   4.8 ------	UNKNOWN
Post-slew image of 15-350 keV band
Time interval of the image:
82.636600 135.636600

# RAcent  DECcent POSerr Theta    Phi  PeakCts   SNR AngSep     Name
#  [deg]    [deg]    ['] [deg]  [deg]                   [']
170.5460 -60.7321    0.0  46.7 -126.5   0.3331   0.9    9.4	Cen X-3
186.5940 -62.8420    9.9  39.7 -121.3  -0.2379  -1.2    4.6	GX 301-2
245.0246 -15.6568    2.3  49.2  -27.4   1.0542   5.0    2.8	Sco X-1
256.0839 -37.7542    2.7  25.0  -25.8   0.3621   4.2    7.1	4U 1700-377
256.4337 -36.3695    4.7  26.2  -23.9   0.2141   2.4    3.2	GX 349+2
263.1372 -24.6192    9.1  35.9   -6.7  -0.1480  -1.3   10.3	GX 1+4
264.9131 -44.5477    6.4  16.2  -15.4   0.1564   1.8    9.3	4U 1735-44
270.4423 -25.1987    6.2  34.4    4.6  -0.2241  -1.9   11.2	GX 5-1
270.4680 -25.8669    4.7  33.7    4.6   0.2851   2.4   11.6	GRS 1758-258
274.0776 -14.1613    5.4  45.3   10.8   0.3878   2.2    8.6	GX 17+2
275.8827 -30.2830    3.2  29.1   13.4   0.3816   3.5    5.5	H1820-303
285.2140 -25.0264   10.2  35.0   28.2   0.1475   1.1   11.6	HT1900.1-2455
262.8491 -33.7190    4.8  27.1  -10.9   0.2256   2.4    9.8	GX 354-0
271.3724 -21.2759    2.6  38.3    6.5   0.5635   4.4 ------	UNKNOWN
275.7560 -59.4912    1.3   0.1  168.8   0.7153   8.9 ------	UNKNOWN