Analysis Summary
Notes:
- 1) No attempt has been made to eliminate the non-significant decimal places.
- 2) This batgrbproduct analysis is done using the HEASARC data.
- 3) This batgrbproduct analysis is using the flight position for the mask-weighting calculation.
======================================================================
BAT GRB EVENT DATA PROCESSING REPORT
Process Script Ver: batgrbproduct v2.46
Process Start Time: Mon Jan 13 00:41:35 EST 2014
Host Name: batevent1
Current Working Dir: /local/data/batevent/batevent_reproc/trigger533613
======================================================================
Trigger: 00533613 Segment: 000
BAT Trigger Time: 369273367.744 [s; MET]
Trigger Stop: 369273368.768 [s; MET]
UTC: 2012-09-13T23:55:58.097160 [includes UTCF correction]
Where From?: TDRSS position message
BAT
RA: 213.644443505442 Dec: -14.5347563916444 [deg; J2000]
Catalogged Source?: NO
Point Source?: YES
GRB Indicated?: YES [ by BAT flight software ]
Image S/N Ratio: 7.76
Image Trigger?: NO
Rate S/N Ratio: 13.7840487520902 [ if not an image trigger ]
Image S/N Ratio: 7.76
Analysis Position: [ source = BAT ]
RA: 213.644443505442 Dec: -14.5347563916444 [deg; J2000]
Refined Position: [ source = BAT pre-slew burst ]
RA: 213.659109013413 Dec: -14.5078334233632 [deg; J2000]
{ 14h 14m 38.2s , -14d 30' 28.2" }
+/- 0.614021418439663 [arcmin] (estimated 90% radius based on SNR)
+/- 0.177654555649107 [arcmin] (formal 1-sigma fit error)
SNR: 61.0538915062658
Angular difference between the analysis and refined position is 1.826211 arcmin
Partial Coding Fraction: 0.59375 [ including projection effects ]
Duration
T90: 122.587999939919 +/- 4.45621407847282
Measured from: -31.0680000185966
to: 91.5199999213219 [s; relative to TRIGTIME]
T50: 54.1799999475479 +/- 1.88285735130181
Measured from: 1.91999995708466
to: 56.0999999046326 [s; relative to TRIGTIME]
Fluence
Peak Flux (peak 1 second)
Measured from: 38.4639999866486
to: 39.4639999866486 [s; relative to TRIGTIME]
Total Fluence
Measured from: -50.6040000319481
to: 111.856000006199 [s; relative to TRIGTIME]
Band 1 Band 2 Band 3 Band 4
15-25 25-50 50-100 100-350 keV
Total 5.340722 6.777228 4.816118 1.268550
0.104762 0.102558 0.089841 0.078618 [error]
Peak 0.090817 0.139920 0.130400 0.052834
0.009143 0.009830 0.008958 0.007154 [error]
[ fluence units of on-axis counts / fully illuminated detector ]
======================================================================
====== Table of the duration information =============================
Value tstart tstop
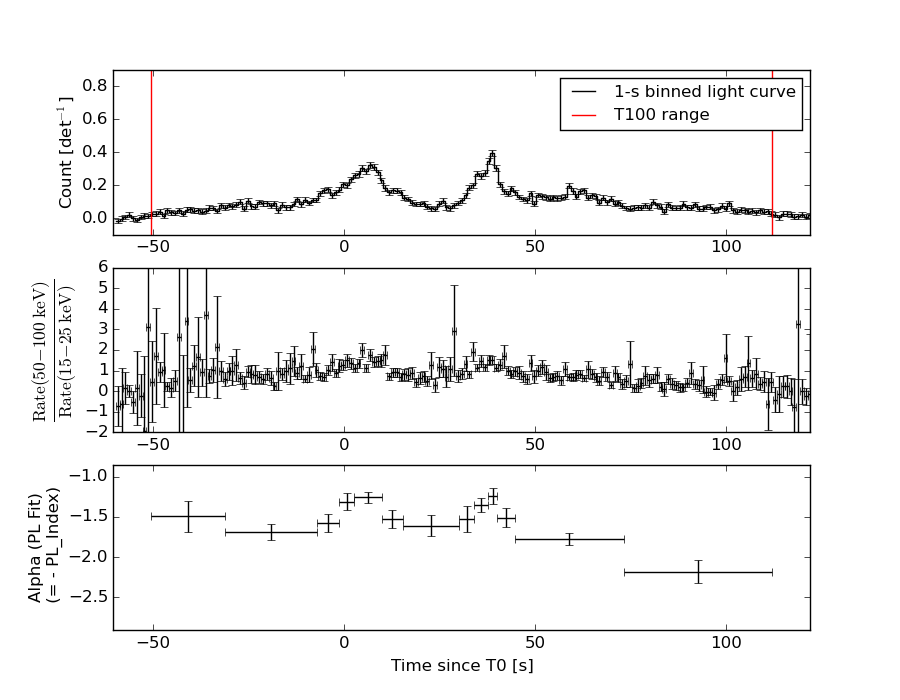
T100 162.460 -50.604 111.856
T90 122.588 -31.068 91.520
T50 54.180 1.920 56.100
Peak 1.000 38.464 39.464
====== Spectral Analysis Summary =====================================
Model : spectral model: simple power-law (PL) and cutoff power-law (CPL)
Ph_index : photon index: E^{Ph_index}
Ph_90err : 90% error of the photon index
Epeak : Epeak in keV
Epeak_90err: 90% error of Epeak
Norm : normalization at 50 keV in both the PL model and CPL model
Nomr_90err : 90% error of the normalization
chi2 : Chi-Squared
dof : degree of freedo
=== Time-averaged spectral analysis ===
(Best model with acceptable fit: PL)
Model Ph_index Ph_90err_low Ph_90err_hi Epeak Epeak_90err_low Epeak_90err_hi Norm Nomr_90err_low Norm_90err_hi chi2 dof
PL -1.634 -0.043 0.043 - - - 7.33e-03 -1.56e-04 1.56e-04 43.570 57
CPL -1.541 -0.117 0.172 271.178 N/A N/A 8.08e-03 N/A N/A 42.660 56
=== 1-s peak spectral analysis ===
(Best model with acceptable fit: PL)
Model Ph_index Ph_90err_low Ph_90err_hi Epeak Epeak_90err_low Epeak_90err_hi Norm Nomr_90err_low Norm_90err_hi chi2 dof
PL -1.263 -0.134 0.134 - - - 2.70e-02 -1.96e-03 1.96e-03 53.470 57
CPL -1.265 -0.128 0.141 9999.360 -9999.360 -9999.360 2.71e-02 -1.91e-03 1.35e-02 53.490 56
=== Fluence/Peak Flux Summary ===
Model Band1 Band2 Band3 Band4 Band5 Total
15-25 25-50 50-100 100-350 15-150 15-350 keV
Fluence PL 1.72e-06 2.92e-06 3.76e-06 9.78e-06 1.11e-05 1.82e-05 erg/cm2
90%_error_low -7.67e-08 -7.37e-08 -1.01e-07 -6.01e-07 -2.43e-07 -6.47e-07 erg/cm2
90%_error_hi 7.83e-08 7.36e-08 1.00e-07 6.29e-07 2.43e-07 6.68e-07 erg/cm2
Peak flux PL 8.86e-01 1.03e+00 8.56e-01 1.20e+00 3.20e+00 3.97e+00 ph/cm2/s
90%_error_low -1.25e-01 -8.86e-02 -7.44e-02 -2.13e-01 -2.41e-01 -3.01e-01 ph/cm2/s
90%_error_hi 1.31e-01 8.75e-02 7.36e-02 2.41e-01 2.42e-01 3.04e-01 ph/cm2/s
Fluence CPL 1.68e-06 2.93e-06 3.79e-06 8.62e-06 1.10e-05 1.70e-05 erg/cm2
90%_error_low -1.03e-07 -7.70e-08 -1.10e-07 -1.70e-06 -2.81e-07 -1.73e-06 erg/cm2
90%_error_hi 9.78e-08 7.74e-08 1.11e-07 1.31e-06 2.75e-07 1.40e-06 erg/cm2
Peak flux CPL 8.93e-01 1.02e+00 8.52e-01 1.32e+00 3.21e+00 4.01e+00 ph/cm2/s
90%_error_low N/A -6.08e-02 -7.59e-02 -5.38e-01 -2.68e-01 -5.67e-01 ph/cm2/s
90%_error_hi N/A 9.49e-02 8.95e-02 4.03e-03 2.51e-01 2.54e-01 ph/cm2/s
======================================================================
Image
Pre-slew 15.0-350.0 keV image (Event data)
#   RAcent    DECcent   POSerr    Theta     Phi              Peak Cts       SNR   Name
  213.6591   -14.5078   0.0031    26.9068   -59.9712        19.4526468     61.054 TRIG_00533613

Foreground time interval of the image:
-50.604 111.856 (delta_t = 162.460 [sec])
Background time interval of the image:
-239.744 -50.604 (delta_t = 189.140 [sec])
Light Curves
Note: The mask-weighted lightcurves have units of either count/det or counts/sec/det, where a det is 0.4 x 0.4 = 0.16 sq cm.
Full-time range; 1 s binning
Other quick-look light curves:
- 64 ms binning (zoomed)
- 16 ms binning (zoomed)
- 8 ms binning (zoomed)
- 2 ms binning (zoomed)
- SN=5 or 10 s binning (full-time range)
- Raw light curve
Spectra
- 64 ms binning (zoomed)
- 16 ms binning (zoomed)
- 8 ms binning (zoomed)
- 2 ms binning (zoomed)
- SN=5 or 10 s binning (full-time range)
- Raw light curve
Spectra
Notes:
- 1) The fitting includes the systematic errors.
- 2) When the burst includes telescope slew time periods, the fitting uses an average response file made from multiple 5-s response files through out the slew time plus single time preiod for the non-slew times, and weighted by the total counts in the corresponding time period using addrmf. An average response file is needed becuase a spectral fit using the pre-slew DRM will introduce some errors in both a spectral shape and a normalization if the PHA file contains a lot of the slew/post-slew time interval.
- 3) For fits to more complicated models (e.g. a power-law over a cutoff power-law), the BAT team has decided to require a chi-square improvement of more than 6 for each extra dof.
Time averaged spectrum fit using the average DRM
Power-law model

Time interval is from  -50.604 sec. to  111.856 sec.

Spectral model in power-law:
------------------------------------------------------------
Parameters  : value       lower 90%   higher 90%
Photon index: -1.63367     ( -0.042834   0.0427961 )
Norm@50keV  : 7.33018E-03    ( -0.000156066   0.00015606 )
------------------------------------------------------------
#Fit statistic : Chi-Squared =          43.57 using 59 PHA bins.
# Reduced chi-squared =         0.7644 for     57 degrees of freedom
# Null hypothesis probability =   9.047776e-01

Photon flux (15-150 keV)    in 162.5 sec: 0.952086 ( -0.023769  0.02388 ) ph/cm2/s
Energy fluence (15-150 keV)             : 1.10985e-05 ( -2.43136e-07  2.43362e-07 ) ergs/cm2
Cutoff power-law model
Time interval is from  -50.604 sec. to  111.856 sec.
Spectral model in the cutoff power-law:
------------------------------------------------------------
Parameters  : value       lower 90%   higher 90%
Photon index: -1.54062     ( -0.116618   0.171682 )
Epeak [keV] : 271.178      (   )
Norm@50keV  : 8.07799E-03    (     )
------------------------------------------------------------
#Fit statistic : Chi-Squared =          42.66 using 59 PHA bins.
# Reduced chi-squared =         0.7619 for     56 degrees of freedom
# Null hypothesis probability =   9.053171e-01

Photon flux (15-150 keV)    in 162.5 sec: 0.943837 ( -0.027624  0.026386 ) ph/cm2/s
Energy fluence (15-150 keV)             : 1.1019e-05 ( -2.81029e-07  2.74597e-07 ) ergs/cm2
1-s peak spectrum fit
Power-law model
Time interval is from   38.464 sec. to   39.464 sec.

Spectral model in power-law:
------------------------------------------------------------
Parameters  : value       lower 90%   higher 90%
Photon index: -1.26315     ( -0.133736   0.134221 )
Norm@50keV  : 2.70086E-02    ( -0.00196186   0.00196159 )
------------------------------------------------------------
#Fit statistic : Chi-Squared =          53.47 using 59 PHA bins.
# Reduced chi-squared =         0.9382 for     57 degrees of freedom
# Null hypothesis probability =   6.081153e-01

Photon flux (15-150 keV)    in 1 sec: 3.20136 ( -0.24114  0.24175 ) ph/cm2/s
Energy fluence (15-150 keV)             : 2.69408e-07 ( -2.18255e-08  2.19588e-08 ) ergs/cm2
Cutoff power-law model

Time interval is from   38.464 sec. to   39.464 sec.
Spectral model in the cutoff power-law:
------------------------------------------------------------
Parameters  : value       lower 90%   higher 90%
Photon index: -1.26522     ( -0.130608   0.139332 )
Epeak [keV] : 9999.36      ( -9999.36 -9999.36 )
Norm@50keV  : 2.70694E-02    ( -0.00194744   0.0134247 )
------------------------------------------------------------
#Fit statistic : Chi-Squared =          53.49 using 59 PHA bins.
# Reduced chi-squared =         0.9553 for     56 degrees of freedom
# Null hypothesis probability =   5.702891e-01

Photon flux (15-150 keV)    in 1 sec: 3.20915 ( -0.26765  0.2512 ) ph/cm2/s
Energy fluence (15-150 keV)             : 2.6996e-07 ( -2.41045e-08  2.29944e-08 ) ergs/cm2
Time-resolved spectra
Distribution
T90 vs. Hardness ratio plot
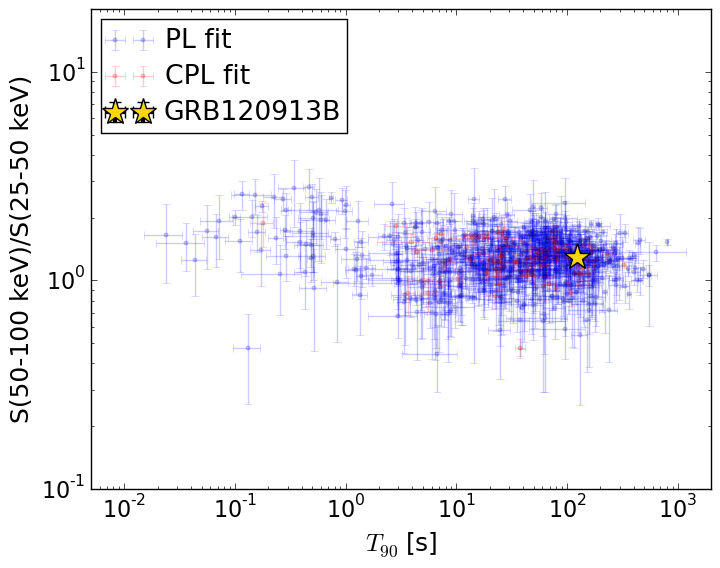
T90                                   = 122.588 sec.
Hardness ratio (energy fluence ratio) = 1.28910956585
S(15-50 keV) vs. S(50-150 keV) plot
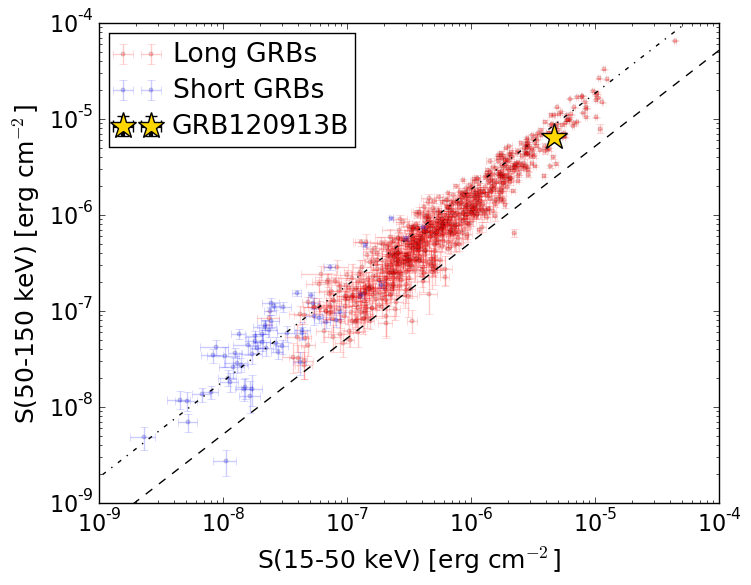
S(15-50 keV)  = 4.64507e-06
S(50-150 keV) = 6.453444e-06
The dash-dotted line and the dashed line traces the fluences calculated from the Band function with Epeak = 15 and 150 keV, respectively. Both lines assume a canonical values of alpha = -1 and beta = -2.5.
Mask shadow pattern
IMX = 2.539596755551063E-01, IMY = 4.393614653322437E-01
Spacecraft aspect plot
Bright source in the pre-burst/pre-slew/post-slew images
Pre-burst image of 15-350 keV band
Time interval of the image:
-239.744000 -50.604000

# RAcent  DECcent POSerr Theta    Phi  PeakCts   SNR AngSep     Name
#  [deg]    [deg]    ['] [deg]  [deg]                   [']
170.5173 -60.4893    5.0  48.9 -153.3   1.1238   2.3   10.0	Cen X-3
186.6726 -62.7718    0.7  41.9 -158.7   5.6367  16.8    0.4	GX 301-2
244.9845 -15.6324    0.3  20.0   20.4   6.7362  35.6    0.6	Sco X-1
255.9840 -37.7009    8.5  17.7  100.7  -0.2809  -1.4    8.6	4U 1700-377
256.3816 -36.3701    2.0  17.9   96.3   1.2342   5.8    4.1	GX 349+2
263.1551 -24.8769    8.8  26.1   69.0   0.3269   1.3   11.2	GX 1+4
264.7072 -44.3456    4.6  25.5  114.8   0.6047   2.5    6.4	4U 1735-44
268.2353  -1.4407    2.7  44.7   42.1   2.3901   4.3    8.0	SW J1753.5-0127
270.2284 -25.1024    7.8  31.8   74.9   0.5045   1.5    3.3	GX 5-1
270.4043 -25.6033   12.6  31.8   75.9   0.3169   0.9   10.0	GRS 1758-258
274.0225 -14.0308  235.8  40.4   61.6   0.0332   0.0    1.0	GX 17+2
275.8870 -30.2481    7.9  34.8   86.9   0.5731   1.5    7.4	H1820-303
263.0758 -33.7299    6.2  23.5   89.3   0.4587   1.9    7.6	GX 354-0
272.7092 -26.4848    2.7  33.4   78.9   1.5706   4.3 ------	UNKNOWN
Pre-slew background subtracted image of 15-350 keV band
Time interval of the image:
-50.604000 111.856000

# RAcent  DECcent POSerr Theta    Phi  PeakCts   SNR AngSep     Name
#  [deg]    [deg]    ['] [deg]  [deg]                   [']
170.4058 -60.5028   81.9  49.0 -153.4  -0.0847  -0.1    7.7	Cen X-3
186.5468 -62.9443    6.2  42.0 -159.0   0.7412   1.9   10.9	GX 301-2
245.0446 -15.7187    2.8  19.9   20.7  -1.0049  -4.2    6.0	Sco X-1
255.9016 -37.7786    6.3  17.7  101.0  -0.5013  -1.8    5.6	4U 1700-377
256.3657 -36.3229    5.7  17.9   96.1  -0.5484  -2.0    6.9	GX 349+2
263.1843 -24.8330    5.9  26.1   69.0  -0.6569  -2.0   10.9	GX 1+4
264.7338 -44.3797    7.4  25.6  114.9  -0.5143  -1.6    4.2	4U 1735-44
268.4540  -1.5672    5.3  44.8   42.4   1.6558   2.2    8.6	SW J1753.5-0127
270.2435 -24.9533   13.8  31.9   74.7  -0.4067  -0.8    7.9	GX 5-1
270.3035 -25.6132    9.8  31.7   75.9  -0.5753  -1.2    7.8	GRS 1758-258
273.8844 -14.1600    0.0  40.2   61.6   0.4670   0.6   10.2	GX 17+2
275.9149 -30.4951   15.7  34.8   87.3   0.3878   0.7    7.7	H1820-303
263.0272 -33.6927    4.5  23.4   89.2  -0.8845  -2.5    8.7	GX 354-0
290.0339 -59.7032    2.8  44.3  134.2   3.2806   4.1 ------	UNKNOWN
242.2550  23.2135    3.0  57.0   -1.3   4.7001   3.9 ------	UNKNOWN
213.6591 -14.5078    0.2  26.9  -60.0  19.4524  61.1 ------	UNKNOWN
155.8841 -65.6634    2.3  55.4 -160.0   4.4936   5.1 ------	UNKNOWN
161.8895 -63.8938    3.0  53.0 -157.6   2.6950   3.8 ------	UNKNOWN
Post-slew image of 15-350 keV band
Time interval of the image: