Analysis Summary
Notes:
- 1) No attempt has been made to eliminate the non-significant decimal places.
- 2) This batgrbproduct analysis is done using the HEASARC data.
- 3) This batgrbproduct analysis is using the flight position for the mask-weighting calculation.
======================================================================
BAT GRB EVENT DATA PROCESSING REPORT
Process Script Ver: batgrbproduct v2.46
Process Start Time: Mon Jan 13 00:32:36 EST 2014
Host Name: batevent1
Current Working Dir: /local/data/batevent/batevent_reproc/trigger534394
======================================================================
Trigger: 00534394 Segment: 000
BAT Trigger Time: 370045838.336 [s; MET]
Trigger Stop: 370045842.432 [s; MET]
UTC: 2012-09-22T22:30:28.656560 [includes UTCF correction]
Where From?: TDRSS position message
BAT
RA: 234.755696507915 Dec: -20.1770777233188 [deg; J2000]
Catalogged Source?: NO
Point Source?: YES
GRB Indicated?: YES [ by BAT flight software ]
Image S/N Ratio: 7.36
Image Trigger?: NO
Rate S/N Ratio: 7.54983443527075 [ if not an image trigger ]
Image S/N Ratio: 7.36
Analysis Position: [ source = BAT ]
RA: 234.755696507915 Dec: -20.1770777233188 [deg; J2000]
Refined Position: [ source = BAT pre-slew burst ]
RA: 234.75907394634 Dec: -20.1819017240909 [deg; J2000]
{ 15h 39m 02.2s , -20d 10' 54.8" }
+/- 1.20957029224793 [arcmin] (estimated 90% radius based on SNR)
+/- 0.33454593546001 [arcmin] (formal 1-sigma fit error)
SNR: 23.1778919852115
Angular difference between the analysis and refined position is 0.346344 arcmin
Partial Coding Fraction: 0.3398438 [ including projection effects ]
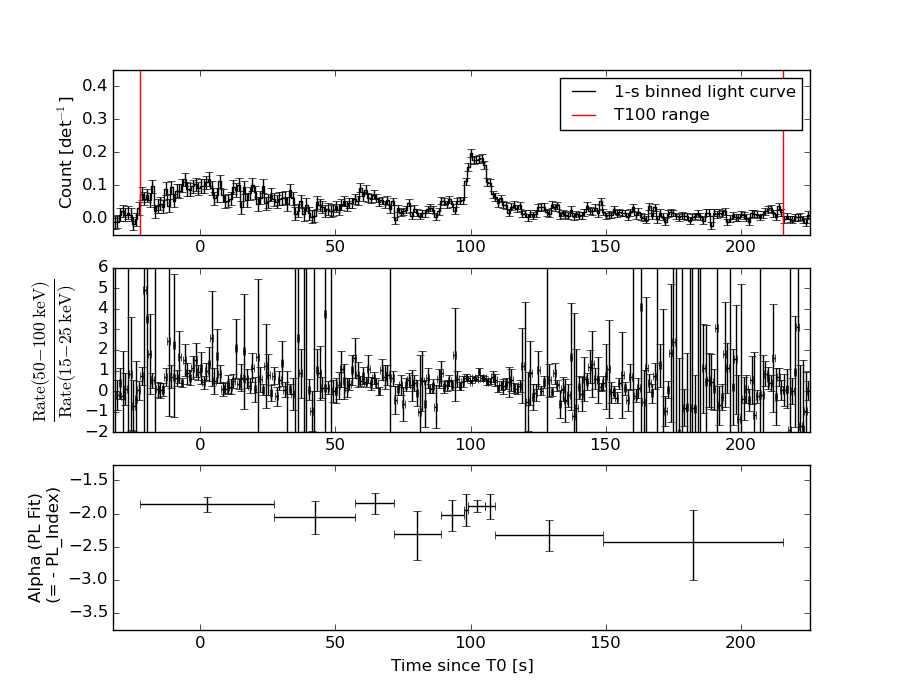
Duration
T90: 168.223999977112 +/- 29.2386949482096
Measured from: -14.4240000247955
to: 153.799999952316 [s; relative to TRIGTIME]
T50: 94.7039999365807 +/- 4.32286242624889
Measured from: 7.61599999666214
to: 102.319999933243 [s; relative to TRIGTIME]
Fluence
Peak Flux (peak 1 second)
Measured from: 99.2119999527931
to: 100.211999952793 [s; relative to TRIGTIME]
Total Fluence
Measured from: -22.5800000429153
to: 215.727999985218 [s; relative to TRIGTIME]
Band 1 Band 2 Band 3 Band 4
15-25 25-50 50-100 100-350 keV
Total 3.521307 3.982178 2.018350 0.389878
0.125922 0.121078 0.103817 0.089877 [error]
Peak 0.081989 0.078987 0.042982 0.013267
0.007103 0.006851 0.005818 0.004670 [error]
[ fluence units of on-axis counts / fully illuminated detector ]
======================================================================
====== Table of the duration information =============================
Value tstart tstop
T100 238.308 -22.580 215.728
T90 168.224 -14.424 153.800
T50 94.704 7.616 102.320
Peak 1.000 99.212 100.212
====== Spectral Analysis Summary =====================================
Model : spectral model: simple power-law (PL) and cutoff power-law (CPL)
Ph_index : photon index: E^{Ph_index}
Ph_90err : 90% error of the photon index
Epeak : Epeak in keV
Epeak_90err: 90% error of Epeak
Norm : normalization at 50 keV in both the PL model and CPL model
Nomr_90err : 90% error of the normalization
chi2 : Chi-Squared
dof : degree of freedo
=== Time-averaged spectral analysis ===
(Best model with acceptable fit: PL)
Model Ph_index Ph_90err_low Ph_90err_hi Epeak Epeak_90err_low Epeak_90err_hi Norm Nomr_90err_low Norm_90err_hi chi2 dof
PL -2.000 -0.080 0.079 - - - 2.51e-03 -1.14e-04 1.13e-04 58.290 57
CPL -1.580 -0.328 0.358 46.095 -13.633 14.983 4.19e-03 -1.35e-03 2.26e-03 53.410 56
=== 1-s peak spectral analysis ===
(Best model with acceptable fit: PL)
Model Ph_index Ph_90err_low Ph_90err_hi Epeak Epeak_90err_low Epeak_90err_hi Norm Nomr_90err_low Norm_90err_hi chi2 dof
PL -1.951 -0.195 0.186 - - - 1.15e-02 -1.42e-03 1.38e-03 47.690 57
CPL -1.903 N/A N/A 87.543 N/A N/A 1.23e-02 N/A N/A 47.670 56
=== Fluence/Peak Flux Summary ===
Model Band1 Band2 Band3 Band4 Band5 Total
15-25 25-50 50-100 100-350 15-150 15-350 keV
Fluence PL 1.23e-06 1.66e-06 1.66e-06 3.01e-06 5.52e-06 7.56e-06 erg/cm2
90%_error_low -8.22e-08 -6.78e-08 -1.04e-07 -3.79e-07 -2.39e-07 -4.74e-07 erg/cm2
90%_error_hi 8.41e-08 6.77e-08 1.05e-07 4.15e-07 2.40e-07 4.99e-07 erg/cm2
Peak flux PL 7.32e-01 5.65e-01 2.92e-01 2.18e-01 1.69e+00 1.81e+00 ph/cm2/s
90%_error_low -1.06e-01 -5.45e-02 -4.75e-02 -6.22e-02 -1.64e-01 -1.76e-01 ph/cm2/s
90%_error_hi 1.09e-01 5.45e-02 4.80e-02 7.62e-02 1.64e-01 1.76e-01 ph/cm2/s
Fluence CPL 1.15e-06 1.73e-06 1.66e-06 1.58e-06 5.31e-06 6.12e-06 erg/cm2
90%_error_low -1.00e-07 -8.33e-08 -1.11e-07 -5.87e-07 -2.91e-07 -6.70e-07 erg/cm2
90%_error_hi 1.02e-07 8.45e-08 1.11e-07 9.99e-07 2.91e-07 1.04e-06 erg/cm2
Peak flux CPL 7.28e-01 5.68e-01 2.92e-01 2.02e-01 1.68e+00 1.79e+00 ph/cm2/s
90%_error_low -1.18e-01 -5.67e-02 -4.17e-02 -1.26e-01 -1.71e-01 -2.28e-01 ph/cm2/s
90%_error_hi 1.16e-01 6.89e-02 4.86e-02 7.85e-02 1.67e-01 1.86e-01 ph/cm2/s
======================================================================
Image
Pre-slew 15.0-350.0 keV image (Event data)
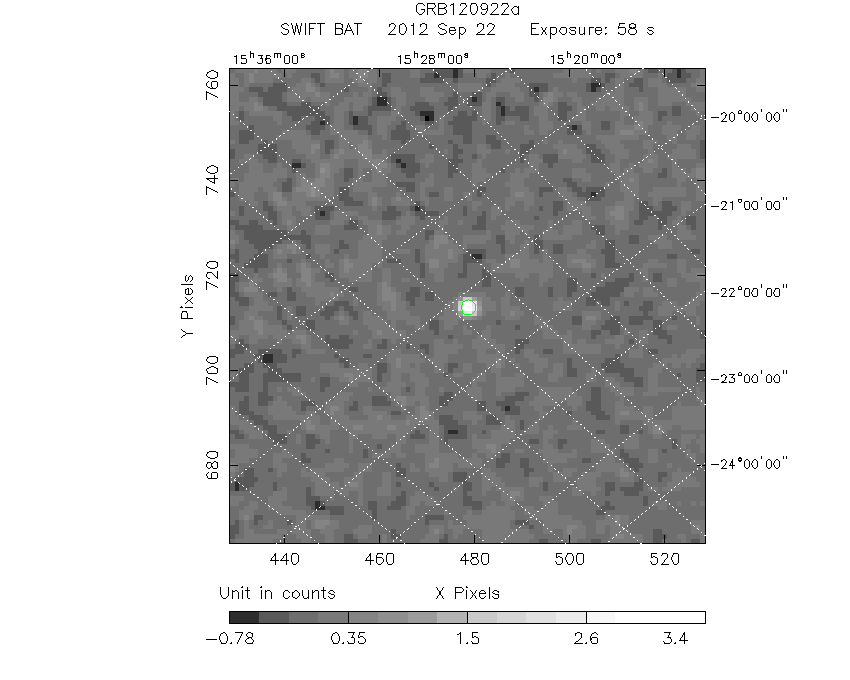
#   RAcent    DECcent   POSerr    Theta     Phi              Peak Cts       SNR   Name
  234.7591   -20.1819   0.0083    44.3644   -30.5427         4.0994776     23.178 TRIG_00534394

Foreground time interval of the image:
-22.580  35.565 (delta_t =  58.145 [sec])
Background time interval of the image:
-239.336 -22.580 (delta_t = 216.756 [sec])
Light Curves
Note: The mask-weighted lightcurves have units of either count/det or counts/sec/det, where a det is 0.4 x 0.4 = 0.16 sq cm.
Full-time range; 1 s binning
Other quick-look light curves:
- 64 ms binning (zoomed)
- 16 ms binning (zoomed)
- 8 ms binning (zoomed)
- 2 ms binning (zoomed)
- SN=5 or 10 s binning (full-time range)
- Raw light curve
Spectra
- 64 ms binning (zoomed)
- 16 ms binning (zoomed)
- 8 ms binning (zoomed)
- 2 ms binning (zoomed)
- SN=5 or 10 s binning (full-time range)
- Raw light curve
Spectra
Notes:
- 1) The fitting includes the systematic errors.
- 2) When the burst includes telescope slew time periods, the fitting uses an average response file made from multiple 5-s response files through out the slew time plus single time preiod for the non-slew times, and weighted by the total counts in the corresponding time period using addrmf. An average response file is needed becuase a spectral fit using the pre-slew DRM will introduce some errors in both a spectral shape and a normalization if the PHA file contains a lot of the slew/post-slew time interval.
- 3) For fits to more complicated models (e.g. a power-law over a cutoff power-law), the BAT team has decided to require a chi-square improvement of more than 6 for each extra dof.
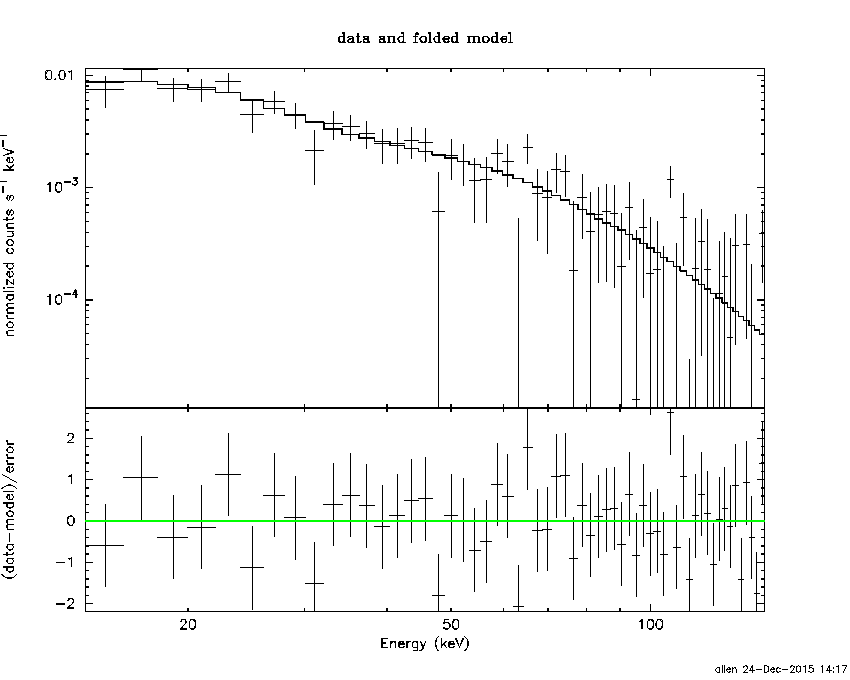
Time averaged spectrum fit using the average DRM
Power-law model
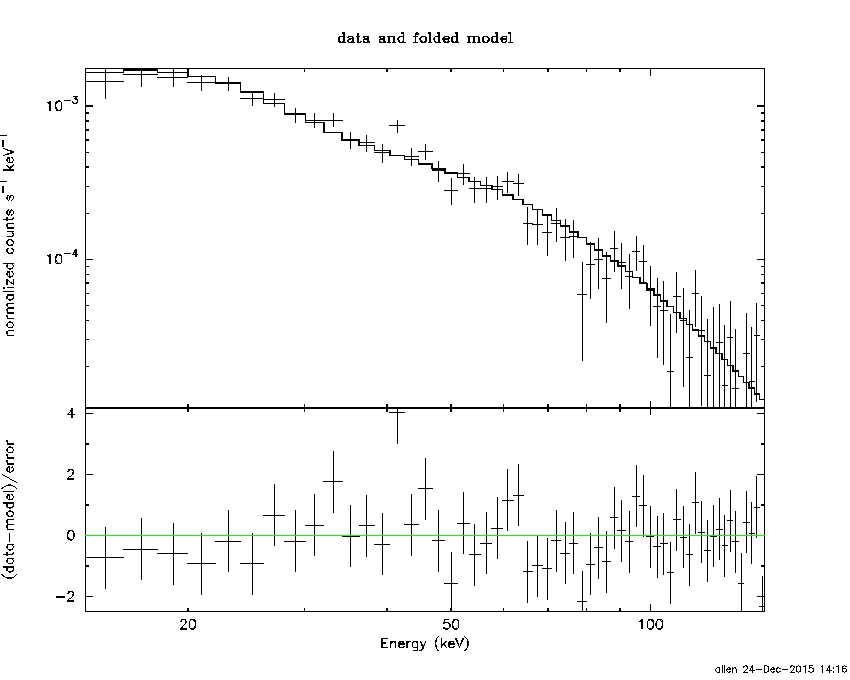
Time interval is from  -22.580 sec. to  215.728 sec.

Spectral model in power-law:
------------------------------------------------------------
Parameters  : value       lower 90%   higher 90%
Photon index: -1.99952     ( -0.0801652   0.078984 )
Norm@50keV  : 2.51367E-03    ( -0.000113995   0.000113216 )
------------------------------------------------------------
#Fit statistic : Chi-Squared =          58.29 using 59 PHA bins.
# Reduced chi-squared =          1.023 for     57 degrees of freedom
# Null hypothesis probability =   4.277966e-01

Photon flux (15-150 keV)    in 238.3 sec: 0.376996 ( -0.016259  0.016314 ) ph/cm2/s
Energy fluence (15-150 keV)             : 5.52477e-06 ( -2.39418e-07  2.40426e-07 ) ergs/cm2
Cutoff power-law model
Time interval is from  -22.580 sec. to  215.728 sec.
Spectral model in the cutoff power-law:
------------------------------------------------------------
Parameters  : value       lower 90%   higher 90%
Photon index: -1.57979     ( -0.327656   0.357874 )
Epeak [keV] : 46.0949      ( -13.6324 14.9828 )
Norm@50keV  : 4.19107E-03    ( -0.00135209   0.00226045 )
------------------------------------------------------------
#Fit statistic : Chi-Squared =          53.41 using 59 PHA bins.
# Reduced chi-squared =         0.9537 for     56 degrees of freedom
# Null hypothesis probability =   5.735962e-01

Photon flux (15-150 keV)    in 238.3 sec: 0.366262 ( -0.018131  0.018193 ) ph/cm2/s
Energy fluence (15-150 keV)             : 5.30804e-06 ( -2.90576e-07  2.90881e-07 ) ergs/cm2
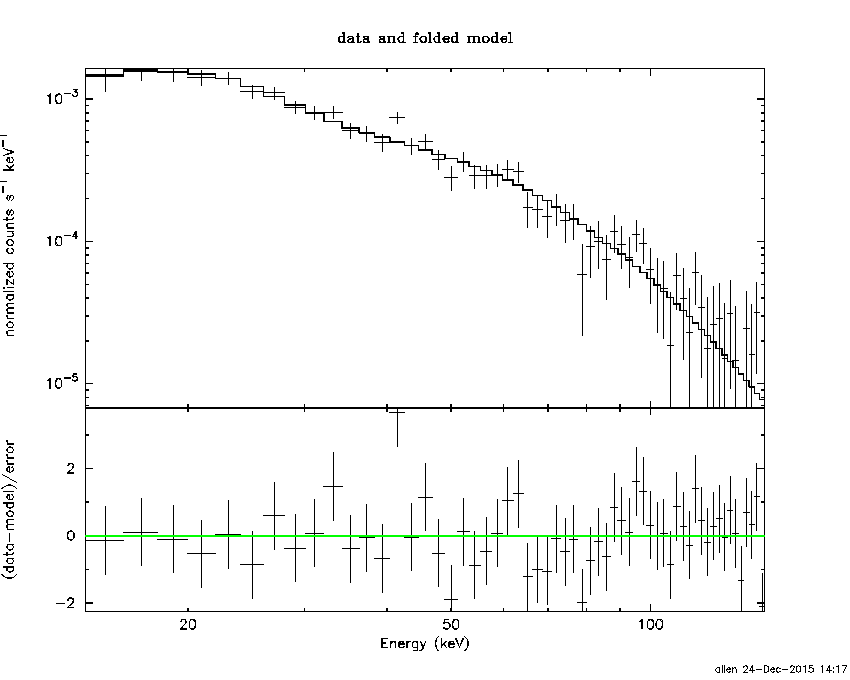
1-s peak spectrum fit
Power-law model
Time interval is from   99.212 sec. to  100.212 sec.

Spectral model in power-law:
------------------------------------------------------------
Parameters  : value       lower 90%   higher 90%
Photon index: -1.95087     ( -0.19526   0.18624 )
Norm@50keV  : 1.15087E-02    ( -0.0014167   0.00138167 )
------------------------------------------------------------
#Fit statistic : Chi-Squared =          47.69 using 59 PHA bins.
# Reduced chi-squared =         0.8366 for     57 degrees of freedom
# Null hypothesis probability =   8.055118e-01

Photon flux (15-150 keV)    in 1 sec: 1.68856 ( -0.16398  0.16408 ) ph/cm2/s
Energy fluence (15-150 keV)             : 1.05933e-07 ( -1.23687e-08  1.26111e-08 ) ergs/cm2
Cutoff power-law model
Time interval is from   99.212 sec. to  100.212 sec.
Spectral model in the cutoff power-law:
------------------------------------------------------------
Parameters  : value       lower 90%   higher 90%
Photon index: -1.90266     (       )
Epeak [keV] : 87.5429      (   )
Norm@50keV  : 1.22538E-02    (     )
------------------------------------------------------------
#Fit statistic : Chi-Squared =          47.67 using 59 PHA bins.
# Reduced chi-squared =         0.8513 for     56 degrees of freedom
# Null hypothesis probability =   7.781653e-01

Photon flux (15-150 keV)    in 1 sec: 1.68488 ( -0.17085  0.16699 ) ph/cm2/s
Energy fluence (15-150 keV)             : 0 ( 0  0 ) ergs/cm2
Time-resolved spectra
Distribution
T90 vs. Hardness ratio plot
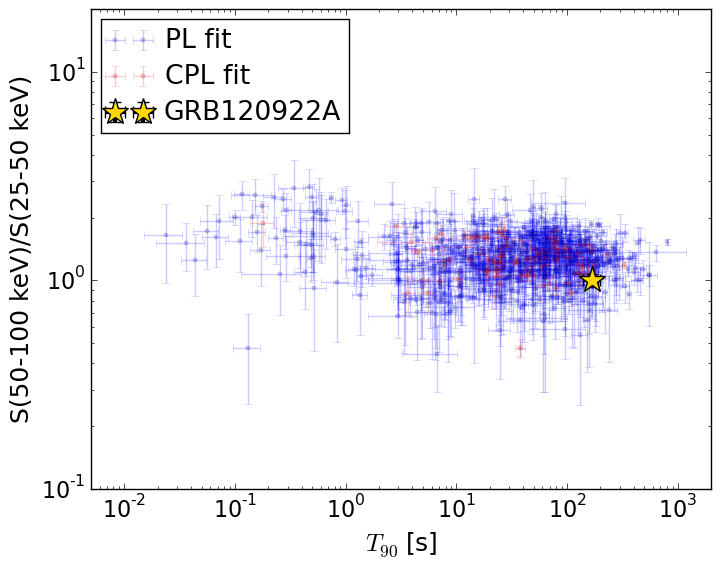
T90                                   = 168.224 sec.
Hardness ratio (energy fluence ratio) = 1.00036804193
S(15-50 keV) vs. S(50-150 keV) plot
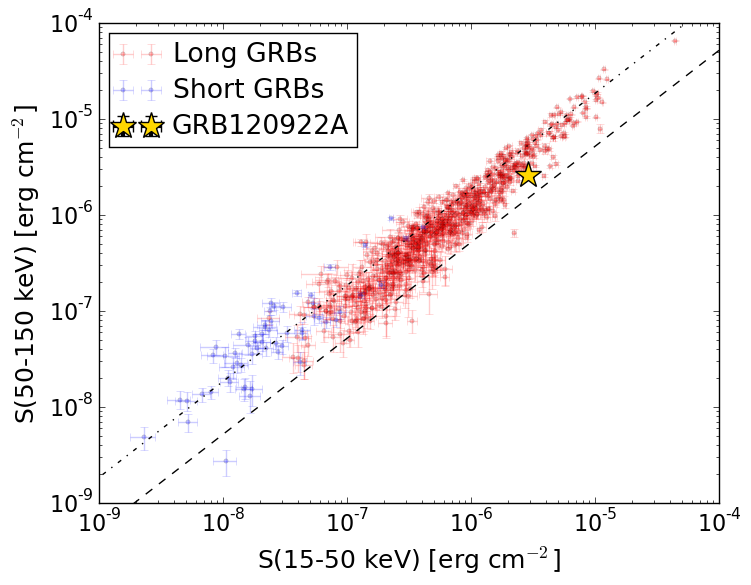
S(15-50 keV)  = 2.888074e-06
S(50-150 keV) = 2.6367375e-06
The dash-dotted line and the dashed line traces the fluences calculated from the Band function with Epeak = 15 and 150 keV, respectively. Both lines assume a canonical values of alpha = -1 and beta = -2.5.
Mask shadow pattern
IMX = 8.423515396214318E-01, IMY = 4.970291649291343E-01
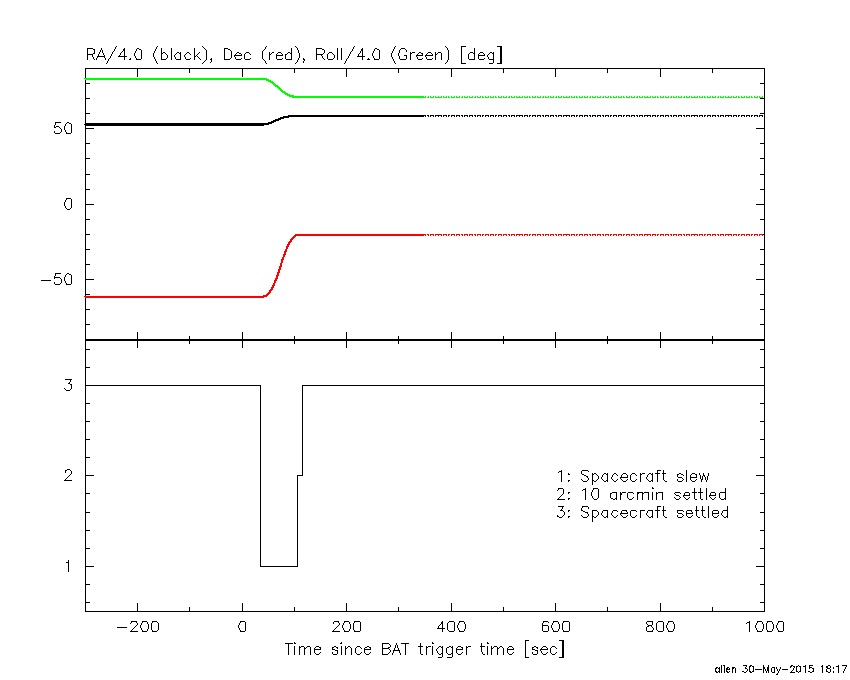
Spacecraft aspect plot
Bright source in the pre-burst/pre-slew/post-slew images
Pre-burst image of 15-350 keV band
Time interval of the image:
-239.336000 -22.580000

# RAcent  DECcent POSerr Theta    Phi  PeakCts   SNR AngSep     Name
#  [deg]    [deg]    ['] [deg]  [deg]                   [']
135.5358 -40.5402   15.2  48.7 -164.1   0.3392   0.8    0.9	Vela X-1
170.5763 -60.7672   16.6  19.4 -169.0   0.1373   0.7   11.5	Cen X-3
186.6539 -62.7759    1.7  11.5 -170.4   1.3695   6.9    0.3	GX 301-2
244.9804 -15.6402    1.0  51.7  -19.9   5.4881  11.3    0.1	Sco X-1
255.9937 -37.8488    2.3  36.2    7.4   1.1995   5.0    0.4	4U 1700-377
256.5639 -36.4710   31.6  37.6    6.7   0.0935   0.4    6.8	GX 349+2
263.0162 -24.6939    7.3  50.5    4.7   0.7259   1.6    3.1	GX 1+4
264.7575 -44.3801    4.7  35.1   23.3   0.6931   2.5    4.2	4U 1735-44
270.2488 -25.0574    3.9  53.4   12.2   2.3980   3.0    2.3	GX 5-1
270.2548 -25.8229    7.6  52.8   12.7  -1.1991  -1.5    5.4	GRS 1758-258
275.8022 -30.4816    0.0  51.5   21.1   1.7236   2.2    9.4	H1820-303
262.9816 -33.9265    4.3  42.6   11.3   0.9233   2.7    5.5	GX 354-0
103.8828 -71.4042    2.3  38.1  146.7   1.8058   5.0 ------	UNKNOWN
266.2964 -26.4045    1.1  50.5    9.2   5.6606  10.4 ------	UNKNOWN
218.5754 -14.6424    3.4  47.1  -53.2   3.2361   3.5 ------	UNKNOWN
Pre-slew background subtracted image of 15-350 keV band
Time interval of the image:
-22.580000 35.564610

# RAcent  DECcent POSerr Theta    Phi  PeakCts   SNR AngSep     Name
#  [deg]    [deg]    ['] [deg]  [deg]                   [']
135.5587 -40.5497    8.8  48.7 -164.1  -0.2666  -1.3    1.4	Vela X-1
170.3433 -60.6115 1093.5  19.5 -168.7  -0.0009  -0.0    1.1	Cen X-3
186.6515 -62.7750    3.8  11.5 -170.4  -0.2755  -3.1    0.3	GX 301-2
244.8060 -15.6474    6.1  51.6  -20.1   0.4612   1.9   10.0	Sco X-1
256.1893 -37.7705    9.5  36.3    7.5   0.1529   1.2   10.6	4U 1700-377
256.3738 -36.3795   51.0  37.5    6.4  -0.0301  -0.2    4.0	GX 349+2
263.0090 -24.7456   80.7  50.4    4.8   0.0352   0.1    0.0	GX 1+4
264.9596 -44.3560    0.0  35.2   23.4  -0.2346  -1.7   10.9	4U 1735-44
270.3371 -25.1608    6.4  53.4   12.3  -0.7253  -1.8    5.7	GX 5-1
270.3450 -25.7273    4.5  52.9   12.7   1.0141   2.6    2.5	GRS 1758-258
276.0042 -30.5175    5.2  51.5   21.3  -0.8649  -2.2    9.9	H1820-303
262.9072 -33.6860    6.3  42.7   11.0   0.3203   1.8    9.8	GX 354-0
252.0617 -25.6978    2.2  45.0   -6.5   0.8165   5.1 ------	UNKNOWN
252.7851 -17.4521    2.7  52.7  -10.3   1.0982   4.3 ------	UNKNOWN
234.7591 -20.1819    0.5  44.4  -30.5   4.0997  23.2 ------	UNKNOWN
Post-slew image of 15-350 keV band
Time interval of the image:
105.164590 962.748300

# RAcent  DECcent POSerr Theta    Phi  PeakCts   SNR AngSep     Name
#  [deg]    [deg]    ['] [deg]  [deg]                   [']
186.6400 -62.8297   12.4  53.6 -168.6   2.7366   0.9    3.6	GX 301-2
244.9742 -15.6341    0.2  10.7   53.2  34.7007  47.9    0.5	Sco X-1
256.0257 -37.9845    4.7  25.6  125.1   2.2050   2.5    8.6	4U 1700-377
256.3540 -36.5625    6.0  25.0  122.1   1.6342   1.9    9.2	GX 349+2
262.9502 -24.7396    5.5  26.4   91.7   2.3656   2.1    3.2	GX 1+4
264.5521 -44.3351    0.0  34.6  127.7  -1.0211  -0.7   10.7	4U 1735-44
268.4553  -1.6093    6.9  37.8   51.4   2.6870   1.7   10.8	SW J1753.5-0127
270.1802 -25.1381    3.7  33.0   91.9   4.8152   3.1    6.7	GX 5-1
270.2404 -25.7118    5.0  33.1   92.9   3.5714   2.3    3.8	GRS 1758-258
273.9675 -13.9557   85.0  37.9   73.4   0.3134   0.1    5.3	GX 17+2
275.9500 -30.3581  182.1  38.4  100.3   0.1438   0.1    1.4	H1820-303
262.9827 -33.7869    4.4  28.5  110.9   3.0762   2.7    2.9	GX 354-0
266.3024 -26.3978    0.6  29.6   94.7  23.8812  18.7 ------	UNKNOWN
263.5710   9.3560    3.1  40.9   33.0   5.1955   3.7 ------	UNKNOWN
248.4798 -47.3792    2.2  29.4  147.4   4.8210   5.2 ------	UNKNOWN
233.5683 -67.8550    2.5  47.7  167.1   8.2119   4.6 ------	UNKNOWN
243.2489 -15.8930    3.1   9.1   50.1   2.5727   3.8 ------	UNKNOWN
242.0683  21.4776    3.6  42.2   -3.4   3.9280   3.2 ------	UNKNOWN