Analysis Summary
Notes:
- 1) No attempt has been made to eliminate the non-significant decimal places.
- 2) This batgrbproduct analysis is done using the HEASARC data.
- 3) This batgrbproduct analysis is using the flight position for the mask-weighting calculation.
======================================================================
                  BAT GRB EVENT DATA PROCESSING REPORT
    Process Script Ver: batgrbproduct v2.46
    Process Start Time: Mon Jan 13 00:28:32 EST 2014
             Host Name: batevent1
   Current Working Dir: /local/data/batevent/batevent_reproc/trigger534402
======================================================================

  Trigger: 00534402      Segment: 000

  BAT Trigger Time: 370070175.936   [s; MET]
      Trigger Stop: 370070202.816   [s; MET]
               UTC: 2012-09-23T05:16:06.255520    [includes UTCF correction]
       Where From?: TDRSS position message

  BAT
    RA: 303.795001229187   Dec: 6.23473100874495  [deg; J2000]

     Catalogged Source?: NO
     Point Source?:      YES
     GRB Indicated?:     YES    [ by BAT flight software ]
     Image S/N Ratio:    8.88
     Image Trigger?:     NO
     Rate S/N Ratio:     10.6770782520313  [ if not an image trigger ]
     Image S/N Ratio:    8.88

  Analysis Position:   [ source = BAT ]
    RA: 303.795001229187   Dec: 6.23473100874495  [deg; J2000]

  Refined Position:   [ source = BAT pre-slew burst ]
    RA: 303.784471659038   Dec: 6.25568355596925  [deg; J2000]
        { 20h 15m 08.3s , +06d 15' 20.5" }
         +/- 1.99640762233175 [arcmin] (estimated 90% radius based on SNR)
         +/- 1.01712934720483 [arcmin] (formal 1-sigma fit error)
    SNR: 11.3289829654631

  Angular difference between the analysis and refined position is 1.405293 arcmin

  Partial Coding Fraction: 0.796875    [ including projection effects ]

  Duration
     T90: 26.0759999752045 +/- 6.82356414870415
        Measured from: -1.26399999856949
                   to: 24.811999976635     [s; relative to TRIGTIME]
     T50: 14.727999985218 +/- 4.80197289713814
        Measured from: 7.46799999475479
                   to: 22.1959999799728     [s; relative to TRIGTIME]


  Fluence
     Peak Flux  (peak 1 second)
        Measured from: 24.6679999828339
                   to: 25.6679999828339     [s; relative to TRIGTIME]
     Total Fluence
        Measured from: -2.92799997329712
                   to: 26.6439999938011     [s; relative to TRIGTIME]

             Band 1     Band 2     Band 3     Band 4
              15-25      25-50     50-100    100-350     keV
 Total     0.235300   0.316039   0.129352   0.006494
           0.034848   0.033905   0.028282   0.023494 [error]
 Peak      0.017814   0.042273   0.014246  -0.003961
           0.006540   0.006454   0.005226   0.004448 [error]

     [ fluence units of on-axis counts / fully illuminated detector ]

======================================================================


====== Table of the duration information =============================

        Value   tstart    tstop
T100   29.572   -2.928   26.644
T90    26.076   -1.264   24.812
T50    14.728    7.468   22.196
Peak    1.000   24.668   25.668


====== Spectral Analysis Summary =====================================

Model      : spectral model: simple power-law (PL) and cutoff power-law (CPL)
Ph_index   : photon index: E^{Ph_index}
Ph_90err   : 90% error of the photon index
Epeak      : Epeak in keV
Epeak_90err: 90% error of Epeak
Norm       : normalization at 50 keV in both the PL model and CPL model
Nomr_90err : 90% error of the normalization
chi2       : Chi-Squared
dof        : degree of freedo

=== Time-averaged spectral analysis ===
(Best model with acceptable fit: PL)

Model Ph_index Ph_90err_low Ph_90err_hi  Epeak  Epeak_90err_low  Epeak_90err_hi  Norm       Nomr_90err_low    Norm_90err_hi    chi2    dof
PL      -1.801    -0.235      0.226       -           -               -         1.43e-03     -2.25e-04          2.21e-04      50.830   57
CPL      0.302    -1.382      1.972       44.491      -6.965        13.816      2.38e-02     -2.38e-02          3.15e-01      43.350   56


=== 1-s peak spectral analysis ===
(Best model with acceptable fit: PL)

Model Ph_index Ph_90err_low Ph_90err_hi  Epeak  Epeak_90err_low  Epeak_90err_hi  Norm       Nomr_90err_low    Norm_90err_hi    chi2    dof
PL      -1.830     -0.405     0.372       -           -               -         4.50e-03     -1.23e-03          1.20e-03      59.930   57
CPL      1.013     -2.370     7.545       42.383      -8.832        24.079      2.09e-01     -2.09e-01          5.38e+03      55.380   56


=== Fluence/Peak Flux Summary ===

              Model    Band1     Band2     Band3     Band4     Band5     Total
                       15-25     25-50    50-100    100-350    15-150    15-350    keV
Fluence         PL   7.16e-08  1.10e-07  1.26e-07  2.77e-07  3.89e-07  5.84e-07   erg/cm2
      90%_error_low -1.36e-08 -1.48e-08 -2.59e-08 -9.84e-08 -6.14e-08 -1.29e-07   erg/cm2
      90%_error_hi   1.41e-08  1.48e-08  2.64e-08  1.29e-07  6.29e-08  1.54e-07   erg/cm2
Peak flux       PL   2.54e-01  2.11e-01  1.19e-01  9.86e-02  6.27e-01  6.82e-01   ph/cm2/s
      90%_error_low -8.01e-02 -4.90e-02 -4.02e-02 -5.15e-02 -1.46e-01 -1.61e-01   ph/cm2/s
      90%_error_hi   8.52e-02  4.90e-02  4.13e-02  7.66e-02  1.46e-01  1.62e-01   ph/cm2/s

Fluence        CPL   5.99e-08  1.38e-07  1.08e-07  1.85e-08  3.22e-07  3.24e-07   erg/cm2
      90%_error_low -1.66e-08 -2.30e-08 -3.70e-08 -1.57e-08 -5.70e-08 -5.89e-08   erg/cm2
      90%_error_hi   1.66e-08  2.37e-08  3.58e-08  7.10e-08  6.85e-08  9.21e-08   erg/cm2
Peak flux      CPL   1.88e-01  2.89e-01  9.59e-02  3.39e-03  5.76e-01  5.77e-01   ph/cm2/s
      90%_error_low -1.88e-01 -8.30e-02 -9.59e-02 -3.39e-03 -1.58e-01 -1.58e-01   ph/cm2/s
      90%_error_hi   1.06e-01  9.19e-02  6.33e-02  5.30e-02  1.54e-01  1.55e-01   ph/cm2/s

======================================================================
Image
Pre-slew 15.0-350.0 keV image (Event data)
#   RAcent    DECcent   POSerr    Theta     Phi              Peak Cts       SNR   Name
  303.7845     6.2557   0.0170    16.9639    64.2521         0.7372550     11.329 TRIG_00534402

Foreground time interval of the image:
 -2.928  26.644 (delta_t =  29.572 [sec])
Background time interval of the image:
-239.936  -2.928 (delta_t = 237.008 [sec])
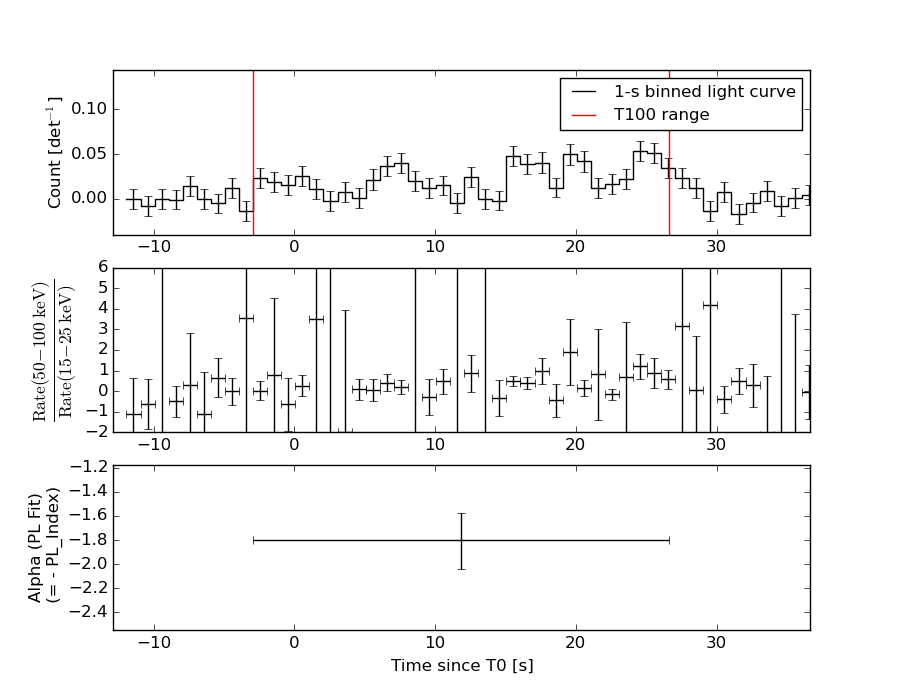
Light Curves
Note: The mask-weighted lightcurves have units of either count/det or counts/sec/det, where a det is 0.4 x 0.4 = 0.16 sq cm.
Full-time range; 1 s binning
Other quick-look light curves:
- 64 ms binning (zoomed)
- 16 ms binning (zoomed)
- 8 ms binning (zoomed)
- 2 ms binning (zoomed)
- SN=5 or 10 s binning (full-time range)
- Raw light curve
Spectra
- 64 ms binning (zoomed)
- 16 ms binning (zoomed)
- 8 ms binning (zoomed)
- 2 ms binning (zoomed)
- SN=5 or 10 s binning (full-time range)
- Raw light curve
Spectra
Notes:
- 1) The fitting includes the systematic errors.
- 2) When the burst includes telescope slew time periods, the fitting uses an average response file made from multiple 5-s response files through out the slew time plus single time preiod for the non-slew times, and weighted by the total counts in the corresponding time period using addrmf. An average response file is needed becuase a spectral fit using the pre-slew DRM will introduce some errors in both a spectral shape and a normalization if the PHA file contains a lot of the slew/post-slew time interval.
- 3) For fits to more complicated models (e.g. a power-law over a cutoff power-law), the BAT team has decided to require a chi-square improvement of more than 6 for each extra dof.
Time averaged spectrum fit using the average DRM
Power-law model
Time interval is from   -2.928 sec. to   26.644 sec.

Spectral model in power-law:
------------------------------------------------------------
Parameters  : value       lower 90%   higher 90%
Photon index: -1.80088     ( -0.235511   0.225863 )
Norm@50keV  : 1.42934E-03    ( -0.000224775   0.000220845 )
------------------------------------------------------------
#Fit statistic : Chi-Squared =          50.83 using 59 PHA bins.
# Reduced chi-squared =         0.8917 for     57 degrees of freedom
# Null hypothesis probability =   7.045050e-01

Photon flux (15-150 keV)    in 29.57 sec: 0.197037 ( -0.02673  0.026739 ) ph/cm2/s
Energy fluence (15-150 keV)             : 3.89162e-07 ( -6.14281e-08  6.28516e-08 ) ergs/cm2
Cutoff power-law model
Time interval is from   -2.928 sec. to   26.644 sec.
Spectral model in the cutoff power-law:
------------------------------------------------------------
Parameters  : value       lower 90%   higher 90%
Photon index: 0.301977     ( -1.40912   1.94477 )
Epeak [keV] : 44.4906      ( -6.85035 13.9307 )
Norm@50keV  : 2.37842E-02    ( -0.0252959   0.313297 )
------------------------------------------------------------
#Fit statistic : Chi-Squared =          43.35 using 59 PHA bins.
# Reduced chi-squared =         0.7741 for     56 degrees of freedom
# Null hypothesis probability =   8.915898e-01

Photon flux (15-150 keV)    in 29.57 sec: 0.183946 ( -0.027473  0.02774 ) ph/cm2/s
Energy fluence (15-150 keV)             : 3.21509e-07 ( -5.69808e-08  6.85152e-08 ) ergs/cm2
1-s peak spectrum fit
Power-law model
Time interval is from   24.668 sec. to   25.668 sec.

Spectral model in power-law:
------------------------------------------------------------
Parameters  : value       lower 90%   higher 90%
Photon index: -1.82965     ( -0.404622   0.372584 )
Norm@50keV  : 4.49935E-03    ( -0.00123374   0.00120097 )
------------------------------------------------------------
#Fit statistic : Chi-Squared =          59.93 using 59 PHA bins.
# Reduced chi-squared =          1.051 for     57 degrees of freedom
# Null hypothesis probability =   3.700707e-01

Photon flux (15-150 keV)    in 1 sec: 0.627311 ( -0.146012  0.146091 ) ph/cm2/s
Energy fluence (15-150 keV)             : 4.13895e-08 ( -1.11078e-08  1.15512e-08 ) ergs/cm2
Cutoff power-law model
Time interval is from   24.668 sec. to   25.668 sec.
Spectral model in the cutoff power-law:
------------------------------------------------------------
Parameters  : value       lower 90%   higher 90%
Photon index: 1.01272     ( -2.41034   7.50433 )
Epeak [keV] : 42.3833      ( -8.67873 24.2319 )
Norm@50keV  : 0.209075    ( -0.279306   5377.22 )
------------------------------------------------------------
#Fit statistic : Chi-Squared =          55.38 using 59 PHA bins.
# Reduced chi-squared =         0.9889 for     56 degrees of freedom
# Null hypothesis probability =   4.982419e-01

Photon flux (15-150 keV)    in 1 sec: 0.576134 ( -0.157908  0.154308 ) ph/cm2/s
Energy fluence (15-150 keV)             : 3.27175e-08 ( -9.47515e-09  1.27447e-08 ) ergs/cm2
Time-resolved spectra
Distribution
T90 vs. Hardness ratio plot

T90                                   = 26.076 sec.
Hardness ratio (energy fluence ratio) = 1.14812659029
S(15-50 keV) vs. S(50-150 keV) plot
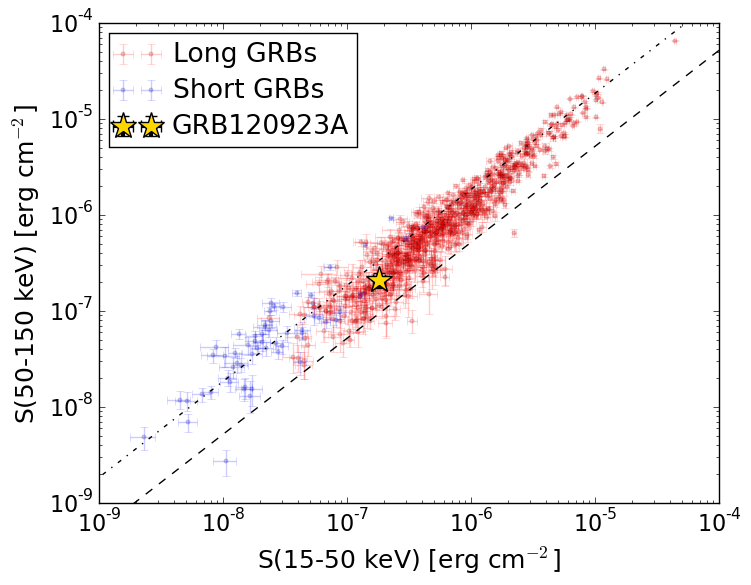
S(15-50 keV)  = 1.8123969e-07
S(50-150 keV) = 2.0793105e-07
The dash-dotted line and the dashed line traces the fluences calculated from the Band function with Epeak = 15 and 150 keV, respectively. Both lines assume a canonical values of alpha = -1 and beta = -2.5.
Mask shadow pattern

IMX = 1.325140760758239E-01, IMY = -2.747554641792647E-01
Spacecraft aspect plot
Bright source in the pre-burst/pre-slew/post-slew images
Pre-burst image of 15-350 keV band
Time interval of the image:
-239.936000 -2.928000

# RAcent  DECcent POSerr Theta    Phi  PeakCts   SNR AngSep     Name
#  [deg]    [deg]    ['] [deg]  [deg]                   [']
254.4979  35.3618    2.8  46.5  -43.9   2.4758   4.1    2.3	Her X-1
256.0226 -37.7462   14.4  48.2 -152.0  -0.4050  -0.8    6.1	4U 1700-377
256.2935 -36.4488    5.6  47.2 -151.0   0.9459   2.0    7.0	GX 349+2
263.1250 -24.6891    4.7  34.8 -144.3   0.6594   2.4    7.2	GX 1+4
264.5886 -44.5024    4.4  49.6 -164.3   1.3744   2.6    7.3	4U 1735-44
268.3355  -1.5134    4.6  19.5 -102.1   0.5250   2.5    4.1	SW J1753.5-0127
270.2118 -25.0174    4.2  30.7 -153.6   0.6436   2.7    5.4	GX 5-1
270.2386 -25.6295    4.4  31.2 -154.3   0.6079   2.6    7.6	GRS 1758-258
274.0703 -14.0821    2.7  20.0 -143.7   0.9080   4.2    4.6	GX 17+2
275.7777 -30.3739    3.3  33.0 -166.7   0.8248   3.5    7.6	H1820-303
285.1019 -24.7762   10.3  25.5  179.7   0.2463   1.1    9.4	HT1900.1-2455
288.8066  10.9537    1.1  10.4   -0.2   2.0776  10.5    0.7	GRS 1915+105
299.5460  35.1972    3.5  36.3   10.5   0.9766   3.3    2.2	Cyg X-1
307.9949  41.1358    0.0  44.5   15.9   0.8288   1.8   12.2	Cyg X-3
263.0349 -33.7709    3.6  41.5 -154.2   1.0530   3.2    4.5	GX 354-0
282.0183 -46.1384    3.2  47.0  179.6   1.4437   3.6 ------	UNKNOWN
287.7809  54.5159    2.5  53.9   -5.9   2.8008   4.7 ------	UNKNOWN
271.5017 -22.7087    2.8  28.2 -152.7   0.9527   4.2 ------	UNKNOWN
266.2939 -26.4101    0.4  34.0 -150.0   6.5958  27.0 ------	UNKNOWN
251.6966 -49.3046    3.7  58.7 -159.2   4.2287   3.1 ------	UNKNOWN
Pre-slew background subtracted image of 15-350 keV band
Time interval of the image:
-2.928000 26.644000

# RAcent  DECcent POSerr Theta    Phi  PeakCts   SNR AngSep     Name
#  [deg]    [deg]    ['] [deg]  [deg]                   [']
254.3593  35.4269    8.3  46.7  -44.0  -0.2430  -1.4    7.0	Her X-1
255.9866 -37.8442  430.8  48.3 -152.1   0.0039   0.0    0.0	4U 1700-377
256.5682 -36.5074    5.6  47.0 -151.2   0.2745   2.1    8.2	GX 349+2
263.1503 -24.7983    5.0  34.8 -144.4  -0.1830  -2.3    8.3	GX 1+4
264.7124 -44.5326    5.2  49.6 -164.4  -0.2820  -2.2    5.1	4U 1735-44
268.3791  -1.5134  149.3  19.5 -102.1   0.0052   0.1    3.7	SW J1753.5-0127
270.4401 -25.0133   19.4  30.6 -153.9  -0.0423  -0.6    9.4	GX 5-1
270.1405 -25.8592    0.0  31.4 -154.4   0.0714   1.0   11.2	GRS 1758-258
274.1427 -14.1567    6.8  20.0 -144.0  -0.0988  -1.7   10.7	GX 17+2
275.7776 -30.4118    7.9  33.0 -166.7  -0.1095  -1.5    8.1	H1820-303
285.1759 -25.0017    4.7  25.7  179.5  -0.1633  -2.4    9.0	HT1900.1-2455
288.9584  11.0295    5.8  10.5    0.6  -0.1171  -2.0   10.7	GRS 1915+105
299.5729  35.1877    5.9  36.3   10.5  -0.1597  -1.9    1.2	Cyg X-1
307.9414  40.8394    0.0  44.2   16.1   0.3331   2.7   10.2	Cyg X-3
262.8684 -33.6473    0.0  41.5 -153.9  -0.1022  -1.0   12.8	GX 354-0
303.7845   6.2557    1.0  17.0   64.3   0.7372  11.3 ------	UNKNOWN
294.7120  48.3987    2.2  48.2    0.3   0.6784   5.3 ------	UNKNOWN
Post-slew image of 15-350 keV band
Time interval of the image:
123.764600 962.151200

# RAcent  DECcent POSerr Theta    Phi  PeakCts   SNR AngSep     Name
#  [deg]    [deg]    ['] [deg]  [deg]                   [']
268.2209  -1.5623    0.0  36.3 -104.8   0.2824   0.2   11.0	SW J1753.5-0127
270.2846 -25.0366    3.2  45.2 -138.8   4.0004   3.6    2.6	GX 5-1
270.3777 -25.8544    4.2  45.6 -139.7   3.1474   2.7    7.8	GRS 1758-258
273.8617 -13.9765    5.0  35.9 -128.0   1.7333   2.3    9.1	GX 17+2
275.8564 -30.3367    3.6  45.3 -149.0   3.1744   3.2    4.0	H1820-303
284.9707 -25.0565    6.2  36.3 -154.0   1.0584   1.8    8.9	HT1900.1-2455
288.8147  10.9447    0.7  15.5  -74.9   8.3744  15.4    1.0	GRS 1915+105
299.5497  35.2501    2.9  29.3  -10.7   1.9429   4.0    3.5	Cyg X-1
308.0855  41.0000    2.8  35.0    2.1   2.5636   4.1    3.1	Cyg X-3
326.0670  38.3284    6.2  37.9   25.4   1.5903   1.9    4.9	Cyg X-2
327.2425  59.1355    3.0  55.9   10.7  12.1142   3.9 ------	UNKNOWN
310.3740 -47.2830    2.7  53.8  170.9   9.1986   4.3 ------	UNKNOWN
302.8926  41.3852    3.8  35.2   -4.7   1.8059   3.1 ------	UNKNOWN
287.0521 -49.2671    3.3  57.4 -170.7   9.5922   4.2 ------	UNKNOWN
286.7370 -49.1512    4.8  57.4 -170.4   7.4526   3.3 ------	UNKNOWN
285.7515  17.3955    3.5  20.8  -59.7   1.5391   3.3 ------	UNKNOWN
277.2184  57.7078    3.3  55.5  -20.5   5.9800   3.6 ------	UNKNOWN
266.7089  57.4373    3.0  58.8  -25.9  12.5107   3.9 ------	UNKNOWN
266.2805 -26.3902    1.1  48.8 -137.2  20.6701  10.3 ------	UNKNOWN