Analysis Summary
Notes:
- 1) No attempt has been made to eliminate the non-significant decimal places.
- 2) This batgrbproduct analysis is done using the HEASARC data.
- 3) This batgrbproduct analysis is using the flight position for the mask-weighting calculation.
======================================================================
                  BAT GRB EVENT DATA PROCESSING REPORT
    Process Script Ver: batgrbproduct v2.46
    Process Start Time: Mon Jan 13 00:22:58 EST 2014
             Host Name: batevent1
   Current Working Dir: /local/data/batevent/batevent_reproc/trigger534815
======================================================================

  Trigger: 00534815      Segment: 000

  BAT Trigger Time: 370478456   [s; MET]
      Trigger Stop: 370478520   [s; MET]
               UTC: 2012-09-27T22:40:46.302240    [includes UTCF correction]
       Where From?: TDRSS position message

  BAT
    RA: 136.600410032008   Dec: 0.417375483965046  [deg; J2000]

     Catalogged Source?: NO
     Point Source?:      YES
     GRB Indicated?:     YES    [ by BAT flight software ]
     Image S/N Ratio:    18.92
     Image Trigger?:     YES
     Rate S/N Ratio:     0  [ if not an image trigger ]
     Image S/N Ratio:    18.92

  Analysis Position:   [ source = BAT ]
    RA: 136.600410032008   Dec: 0.417375483965046  [deg; J2000]

  Refined Position:   [ source = BAT pre-slew burst ]
    RA: 136.605400000271   Dec: 0.42054929044966  [deg; J2000]
        { 09h 06m 25.3s , +00d 25' 14.0" }
         +/- 0.854975904725367 [arcmin] (estimated 90% radius based on SNR)
         +/- 0.278703160592133 [arcmin] (formal 1-sigma fit error)
    SNR: 38.0475879275154

  Angular difference between the analysis and refined position is 0.354820 arcmin

  Partial Coding Fraction: 0.6484375    [ including projection effects ]

  Duration
     T90: 35.0559999346733 +/- 15.615164566255
        Measured from: -14.772000014782
                   to: 20.2839999198914     [s; relative to TRIGTIME]
     T50: 15.4879999160767 +/- 1.53094089532442
        Measured from: -4.08399999141693
                   to: 11.4039999246597     [s; relative to TRIGTIME]


  Fluence
     Peak Flux  (peak 1 second)
        Measured from: -3.92799997329712
                   to: -2.92799997329712     [s; relative to TRIGTIME]
     Total Fluence
        Measured from: -37.9399999976158
                   to: 31.1280000209808     [s; relative to TRIGTIME]

             Band 1     Band 2     Band 3     Band 4
              15-25      25-50     50-100    100-350     keV
 Total     1.029282   1.610909   1.074575   0.183142
           0.056089   0.058607   0.051540   0.044187 [error]
 Peak      0.049847   0.068039   0.058303   0.017861
           0.007356   0.008061   0.007056   0.005675 [error]

     [ fluence units of on-axis counts / fully illuminated detector ]

======================================================================


====== Table of the duration information =============================

        Value   tstart    tstop
T100   69.068  -37.940   31.128
T90    35.056  -14.772   20.284
T50    15.488   -4.084   11.404
Peak    1.000   -3.928   -2.928


====== Spectral Analysis Summary =====================================

Model      : spectral model: simple power-law (PL) and cutoff power-law (CPL)
Ph_index   : photon index: E^{Ph_index}
Ph_90err   : 90% error of the photon index
Epeak      : Epeak in keV
Epeak_90err: 90% error of Epeak
Norm       : normalization at 50 keV in both the PL model and CPL model
Nomr_90err : 90% error of the normalization
chi2       : Chi-Squared
dof        : degree of freedo

=== Time-averaged spectral analysis ===
(Best model with acceptable fit: CPL)

Model Ph_index Ph_90err_low Ph_90err_hi  Epeak  Epeak_90err_low  Epeak_90err_hi  Norm       Nomr_90err_low    Norm_90err_hi    chi2    dof
PL      -1.626    -0.077      0.077       -           -               -         3.86e-03     -1.79e-04          1.78e-04      76.490   57
CPL     -0.662    -0.355      0.387       67.767      -7.625        13.009      1.20e-02     -4.01e-03          6.76e-03      51.670   56


=== 1-s peak spectral analysis ===
(Best model with acceptable fit: PL)

Model Ph_index Ph_90err_low Ph_90err_hi  Epeak  Epeak_90err_low  Epeak_90err_hi  Norm       Nomr_90err_low    Norm_90err_hi    chi2    dof
PL      -1.511     -0.202     0.199       -           -               -         1.24e-02     -1.57e-03          1.56e-03      57.390   57
CPL     -0.871     -0.722     0.923       87.986     -27.950       -87.986      2.65e-02     -1.48e-02          5.03e-02      55.390   56


=== Fluence/Peak Flux Summary ===

              Model    Band1     Band2     Band3     Band4     Band5     Total
                       15-25     25-50    50-100    100-350    15-150    15-350    keV
Fluence         PL   3.83e-07  6.52e-07  8.44e-07  2.21e-06  2.48e-06  4.09e-06   erg/cm2
      90%_error_low -2.87e-08 -3.07e-08 -5.01e-08 -2.64e-07 -1.21e-07 -3.07e-07   erg/cm2
      90%_error_hi   2.93e-08  3.07e-08  5.01e-08  2.86e-07  1.22e-07  3.24e-07   erg/cm2
Peak flux       PL   5.18e-01  5.18e-01  3.63e-01  4.04e-01  1.56e+00  1.80e+00   ph/cm2/s
      90%_error_low -1.02e-01 -6.77e-02 -5.62e-02 -1.12e-01 -1.95e-01 -2.23e-01   ph/cm2/s
      90%_error_hi   1.08e-01  6.71e-02  5.56e-02  1.34e-01  1.95e-01  2.24e-01   ph/cm2/s

Fluence        CPL   3.26e-07  7.14e-07  8.79e-07  6.63e-07  2.31e-06  2.58e-06   erg/cm2
      90%_error_low -3.43e-08 -3.87e-08 -5.73e-08 -2.09e-07 -1.35e-07 -2.45e-07   erg/cm2
      90%_error_hi   3.49e-08  3.93e-08  5.74e-08  3.14e-07  1.36e-07  3.31e-07   erg/cm2
Peak flux      CPL   4.65e-01  5.53e-01  3.85e-01  2.08e-01  1.53e+00  1.61e+00   ph/cm2/s
      90%_error_low -1.20e-01 -8.09e-02 -6.37e-02 -1.16e-01 -1.98e-01 -2.36e-01   ph/cm2/s
      90%_error_hi   1.24e-01  8.45e-02  6.56e-02  2.45e-01  1.98e-01  3.05e-01   ph/cm2/s

======================================================================
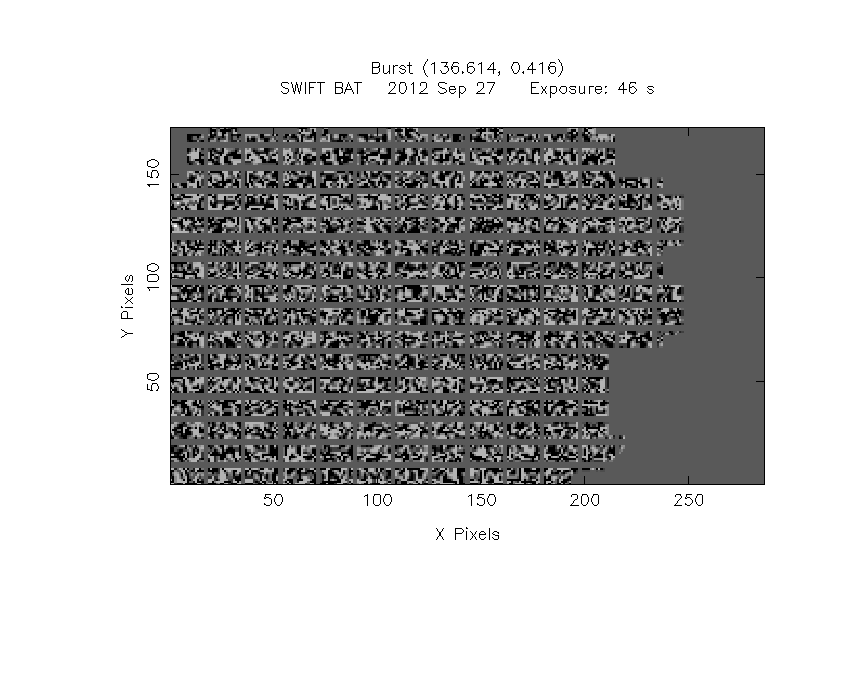
Image
Pre-slew 15.0-350.0 keV image (Event data)
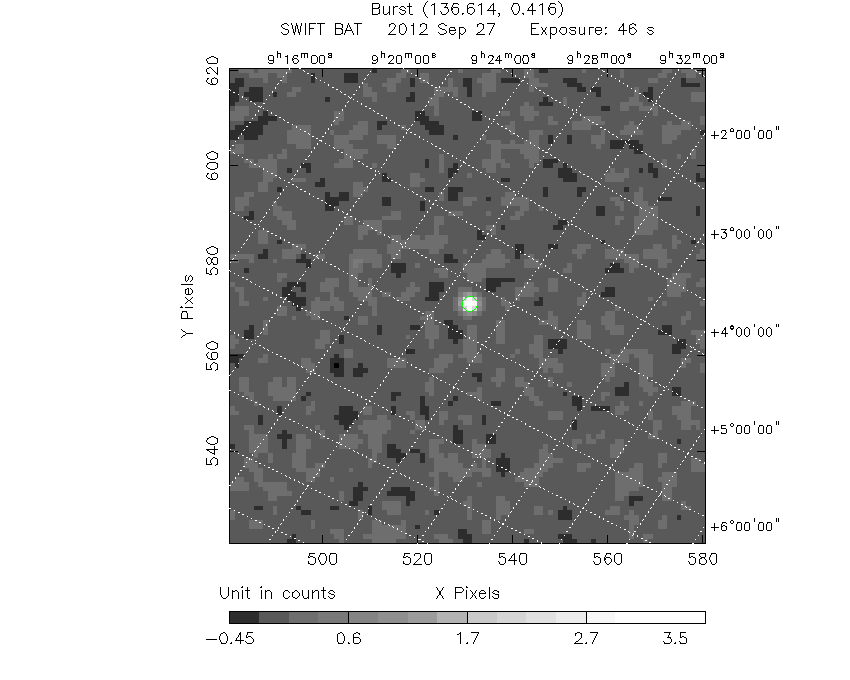
#   RAcent    DECcent   POSerr    Theta     Phi              Peak Cts       SNR   Name
  136.6054     0.4205   0.0051    37.1929   -15.1370         3.8823339     38.048 TRIG_00534815

Foreground time interval of the image:
-14.499  31.128 (delta_t =  45.627 [sec])
Background time interval of the image:
Light Curves
Note: The mask-weighted lightcurves have units of either count/det or counts/sec/det, where a det is 0.4 x 0.4 = 0.16 sq cm.
Full-time range; 1 s binning
Other quick-look light curves:
- 64 ms binning (zoomed)
- 16 ms binning (zoomed)
- 8 ms binning (zoomed)
- 2 ms binning (zoomed)
- SN=5 or 10 s binning (full-time range)
- Raw light curve
Spectra
- 64 ms binning (zoomed)
- 16 ms binning (zoomed)
- 8 ms binning (zoomed)
- 2 ms binning (zoomed)
- SN=5 or 10 s binning (full-time range)
- Raw light curve
Spectra
Notes:
- 1) The fitting includes the systematic errors.
- 2) When the burst includes telescope slew time periods, the fitting uses an average response file made from multiple 5-s response files through out the slew time plus single time preiod for the non-slew times, and weighted by the total counts in the corresponding time period using addrmf. An average response file is needed becuase a spectral fit using the pre-slew DRM will introduce some errors in both a spectral shape and a normalization if the PHA file contains a lot of the slew/post-slew time interval.
- 3) For fits to more complicated models (e.g. a power-law over a cutoff power-law), the BAT team has decided to require a chi-square improvement of more than 6 for each extra dof.
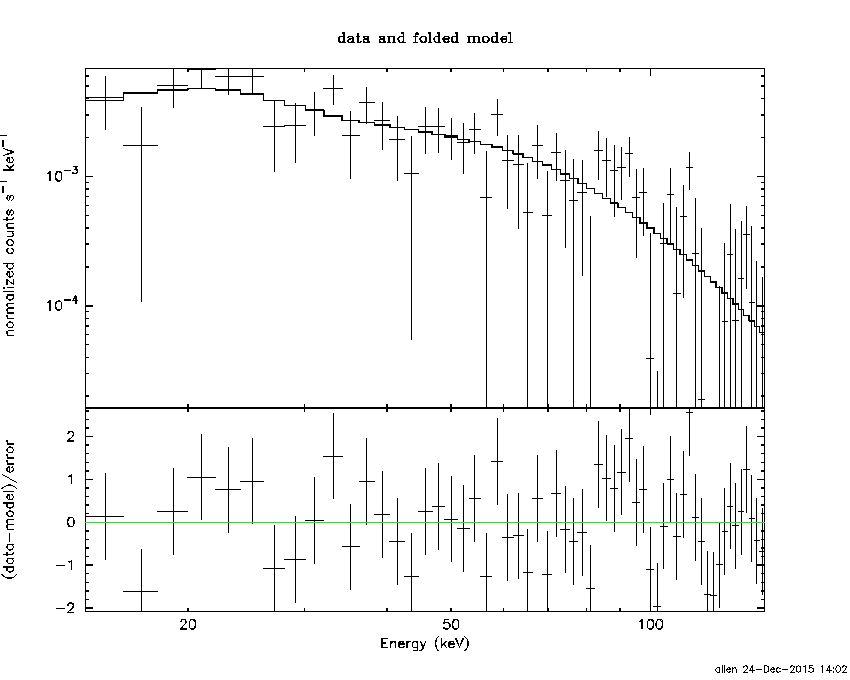
Time averaged spectrum fit using the average DRM
Power-law model
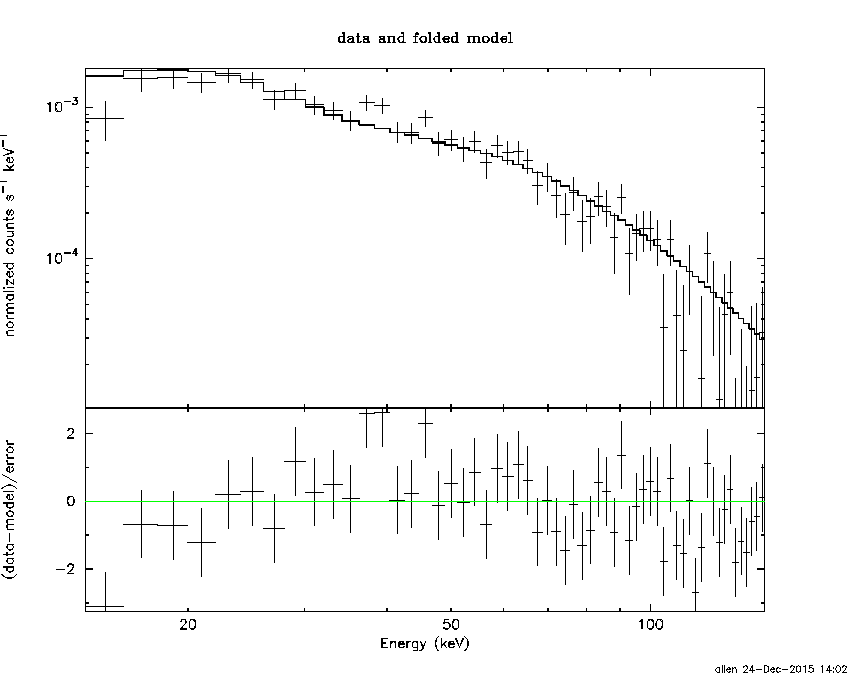
Time interval is from  -37.940 sec. to   31.128 sec.

Spectral model in power-law:
------------------------------------------------------------
Parameters  : value       lower 90%   higher 90%
Photon index: -1.62622     ( -0.0770476   0.0766534 )
Norm@50keV  : 3.85658E-03    ( -0.000178607   0.00017824 )
------------------------------------------------------------
#Fit statistic : Chi-Squared =          76.49 using 59 PHA bins.
# Reduced chi-squared =          1.342 for     57 degrees of freedom
# Null hypothesis probability =   4.349157e-02

Photon flux (15-150 keV)    in 69.07 sec: 0.499717 ( -0.023414  0.023452 ) ph/cm2/s
Energy fluence (15-150 keV)             : 2.48393e-06 ( -1.21443e-07  1.2186e-07 ) ergs/cm2
Cutoff power-law model
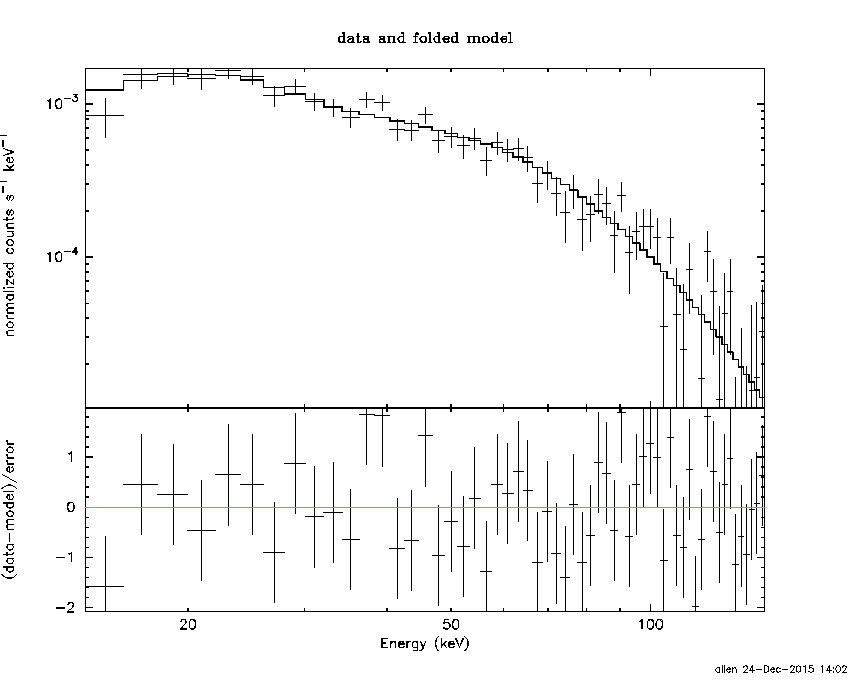
Time interval is from  -37.940 sec. to   31.128 sec.
Spectral model in the cutoff power-law:
------------------------------------------------------------
Parameters  : value       lower 90%   higher 90%
Photon index: -0.661748     ( -0.354634   0.387191 )
Epeak [keV] : 67.7674      ( -7.62494 13.0091 )
Norm@50keV  : 1.19789E-02    ( -0.0040099   0.00676268 )
------------------------------------------------------------
#Fit statistic : Chi-Squared =          51.67 using 59 PHA bins.
# Reduced chi-squared =         0.9228 for     56 degrees of freedom
# Null hypothesis probability =   6.391921e-01

Photon flux (15-150 keV)    in 69.07 sec: 0.476991 ( -0.024683  0.024714 ) ph/cm2/s
Energy fluence (15-150 keV)             : 2.31334e-06 ( -1.34781e-07  1.35663e-07 ) ergs/cm2
1-s peak spectrum fit
Power-law model
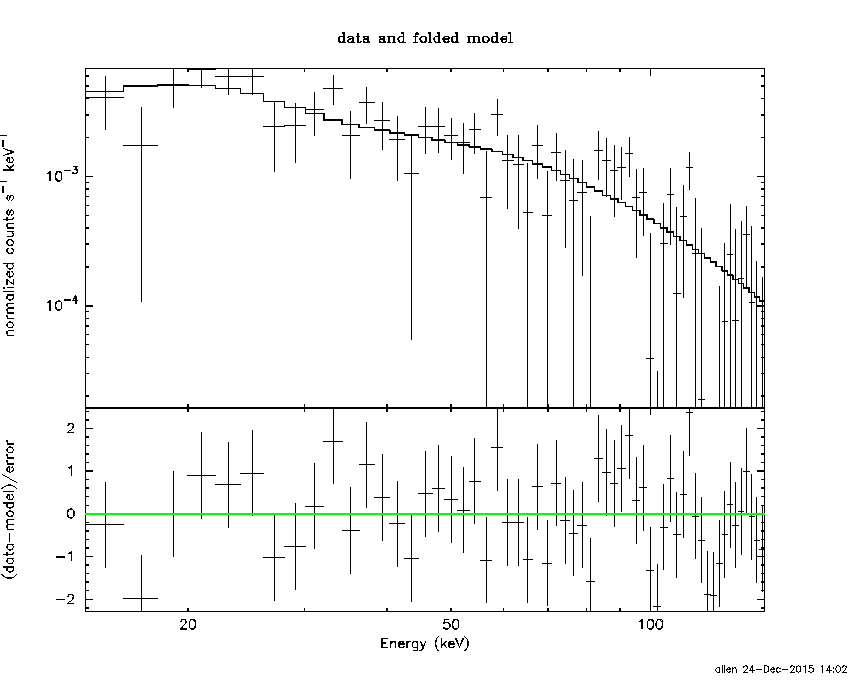
Time interval is from   -3.928 sec. to   -2.928 sec.

Spectral model in power-law:
------------------------------------------------------------
Parameters  : value       lower 90%   higher 90%
Photon index: -1.51086     ( -0.202054   0.199455 )
Norm@50keV  : 1.24445E-02    ( -0.00156773   0.001559 )
------------------------------------------------------------
#Fit statistic : Chi-Squared =          57.39 using 59 PHA bins.
# Reduced chi-squared =          1.007 for     57 degrees of freedom
# Null hypothesis probability =   4.605089e-01

Photon flux (15-150 keV)    in 1 sec: 1.55818 ( -0.19463  0.1949 ) ph/cm2/s
Energy fluence (15-150 keV)             : 1.17864e-07 ( -1.59884e-08  1.6116e-08 ) ergs/cm2
Cutoff power-law model
Time interval is from   -3.928 sec. to   -2.928 sec.
Spectral model in the cutoff power-law:
------------------------------------------------------------
Parameters  : value       lower 90%   higher 90%
Photon index: -0.871171     ( -0.722217   0.923274 )
Epeak [keV] : 87.9859      ( -27.9504 -87.9859 )
Norm@50keV  : 2.64691E-02    ( -0.0147882   0.0503448 )
------------------------------------------------------------
#Fit statistic : Chi-Squared =          55.39 using 59 PHA bins.
# Reduced chi-squared =         0.9891 for     56 degrees of freedom
# Null hypothesis probability =   4.979105e-01

Photon flux (15-150 keV)    in 1 sec: 1.52944 ( -0.19829  0.19824 ) ph/cm2/s
Energy fluence (15-150 keV)             : 1.13564e-07 ( -1.70278e-08  1.70531e-08 ) ergs/cm2
Time-resolved spectra
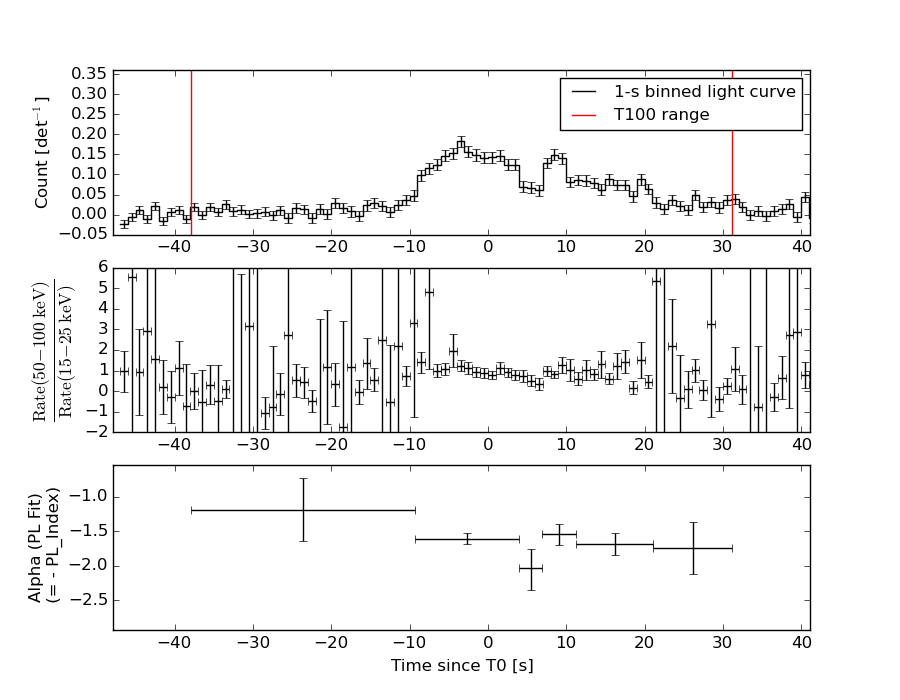
Distribution
T90 vs. Hardness ratio plot
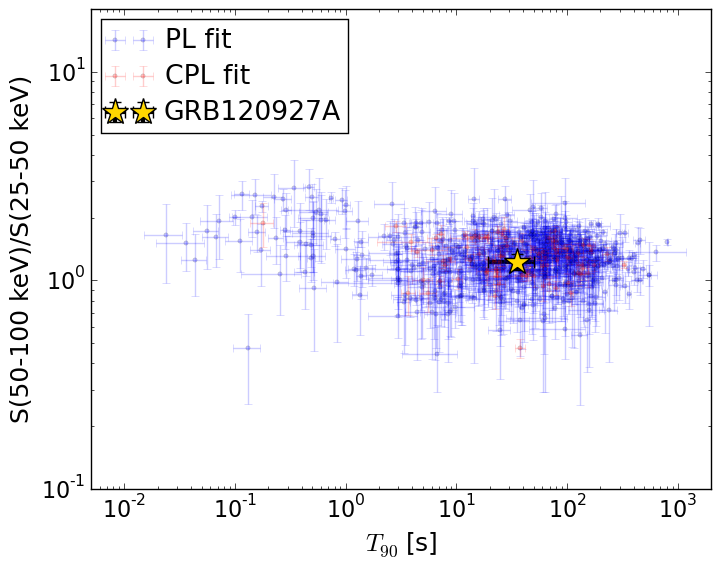
T90                                   = 35.056 sec.
Hardness ratio (energy fluence ratio) = 1.23100562214
S(15-50 keV) vs. S(50-150 keV) plot
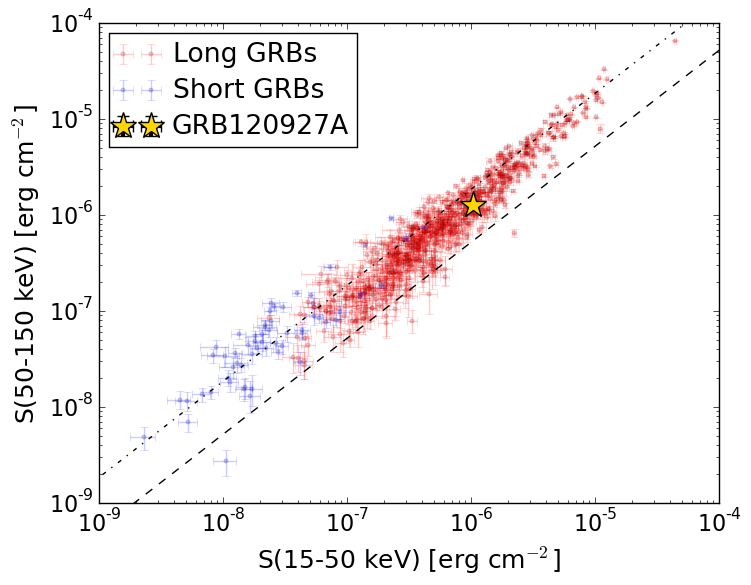
S(15-50 keV)  = 1.0406347e-06
S(50-150 keV) = 1.2727236e-06
The dash-dotted line and the dashed line traces the fluences calculated from the Band function with Epeak = 15 and 150 keV, respectively. Both lines assume a canonical values of alpha = -1 and beta = -2.5.
Mask shadow pattern
IMX = 7.325162244674046E-01, IMY = 1.981561911897791E-01
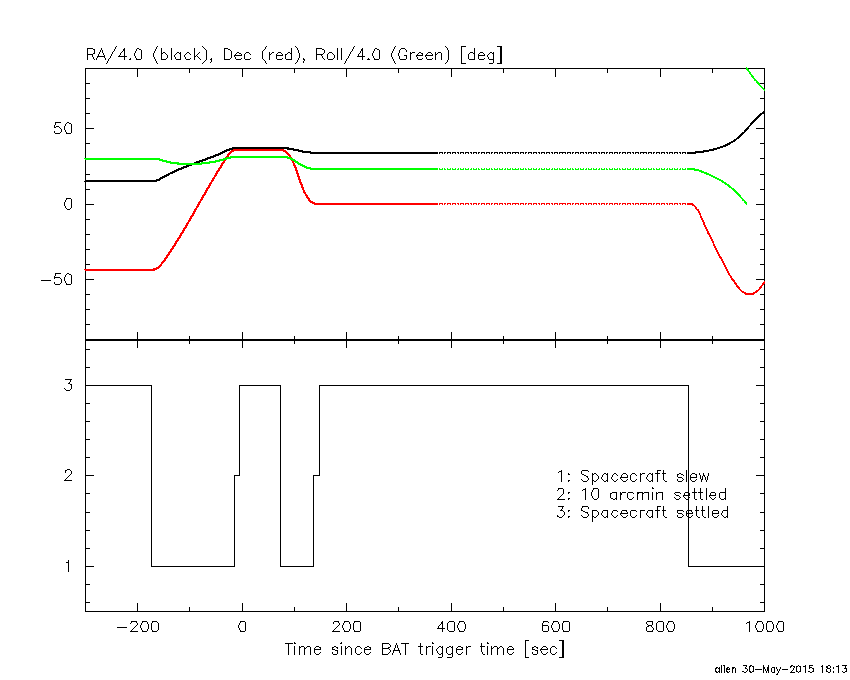
Spacecraft aspect plot
Bright source in the pre-burst/pre-slew/post-slew images
Pre-burst image of 15-350 keV band
Time interval of the image:
Pre-slew background subtracted image of 15-350 keV band
Time interval of the image:
-14.499410 31.128000

# RAcent  DECcent POSerr Theta    Phi  PeakCts   SNR AngSep     Name
#  [deg]    [deg]    ['] [deg]  [deg]                   [']
205.6495  84.5698    3.0  51.3  150.3   1.5814   3.8 ------	UNKNOWN
136.6054   0.4206    0.3  37.2  -15.1   3.8823  38.0 ------	UNKNOWN
145.2156  -8.5903    2.5  44.6  -30.5   0.6696   4.5 ------	UNKNOWN
227.4198  43.4959    4.2  58.7 -159.2   1.5452   2.7 ------	UNKNOWN
211.8957  32.6505    2.8  51.4 -141.5   1.2990   4.1 ------	UNKNOWN
217.4554  33.9338    3.4  55.2 -145.2   1.6225   3.4 ------	UNKNOWN
180.7010   7.3408    2.1  40.8  -88.9   1.7363   5.4 ------	UNKNOWN
Post-slew image of 15-350 keV band
Time interval of the image:
137.500590 853.900610

# RAcent  DECcent POSerr Theta    Phi  PeakCts   SNR AngSep     Name
#  [deg]    [deg]    ['] [deg]  [deg]                   [']
135.5264 -40.5553    0.9  41.0   -1.7   8.2851  12.4    0.1	Vela X-1
115.9451  46.3878    3.1  49.4  158.3   4.9928   3.7 ------	UNKNOWN
150.4837 -34.2642    2.6  37.0  -22.2   2.1220   4.5 ------	UNKNOWN
178.6375  35.3742    3.2  52.4 -139.4   8.3455   3.6 ------	UNKNOWN
178.8201  28.6954    2.1  49.2 -131.9  11.1927   5.4 ------	UNKNOWN