Analysis Summary
Notes:
- 1) No attempt has been made to eliminate the non-significant decimal places.
- 2) This batgrbproduct analysis is done using the HEASARC data.
- 3) This batgrbproduct analysis is using the flight position for the mask-weighting calculation.
======================================================================
                  BAT GRB EVENT DATA PROCESSING REPORT
    Process Script Ver: batgrbproduct v2.46
    Process Start Time: Mon Jan 13 00:01:32 EST 2014
             Host Name: batevent1
   Current Working Dir: /local/data/batevent/batevent_reproc/trigger535960
======================================================================

  Trigger: 00535960      Segment: 000

  BAT Trigger Time: 371938326.208   [s; MET]
      Trigger Stop: 371938326.72   [s; MET]
               UTC: 2012-10-14T20:11:56.448420    [includes UTCF correction]
       Where From?: TDRSS position message

  BAT
    RA: 166.630696384298   Dec: -29.1090441328934  [deg; J2000]

     Catalogged Source?: NO
     Point Source?:      YES
     GRB Indicated?:     YES    [ by BAT flight software ]
     Image S/N Ratio:    11.69
     Image Trigger?:     NO
     Rate S/N Ratio:     22.956480566498  [ if not an image trigger ]
     Image S/N Ratio:    11.69

  Analysis Position:   [ source = BAT ]
    RA: 166.630696384298   Dec: -29.1090441328934  [deg; J2000]

  Refined Position:   [ source = BAT pre-slew burst ]
    RA: 166.650291651359   Dec: -29.1086598526773  [deg; J2000]
        { 11h 06m 36.1s , -29d 06' 31.2" }
         +/- 1.59548380864483 [arcmin] (estimated 90% radius based on SNR)
         +/- 0.672821436330319 [arcmin] (formal 1-sigma fit error)
    SNR: 15.6052989384844

  Angular difference between the analysis and refined position is 1.027478 arcmin

  Partial Coding Fraction: 0.7265625    [ including projection effects ]

  Duration
     T90: 80 +/- 22.6274169979695
        Measured from: -15.2080000042915
                   to: 64.7919999957085     [s; relative to TRIGTIME]
     T50: 32 +/- 16
        Measured from: 16.7919999957085
                   to: 48.7919999957085     [s; relative to TRIGTIME]


  Fluence
     Peak Flux  (peak 1 second)
        Measured from: 56.2919999957085
                   to: 57.2919999957085     [s; relative to TRIGTIME]
     Total Fluence
        Measured from: -15.2080000042915
                   to: 64.7919999957085     [s; relative to TRIGTIME]

             Band 1     Band 2     Band 3     Band 4
              15-25      25-50     50-100    100-350     keV
 Total     0.633158   0.700432   0.415270   0.041049
           0.056578   0.057809   0.049917   0.041685 [error]
 Peak      0.032264   0.020570   0.000546   0.002167
           0.006777   0.006779   0.005679   0.004678 [error]

     [ fluence units of on-axis counts / fully illuminated detector ]

======================================================================


====== Table of the duration information =============================

        Value   tstart    tstop
T100   80.000  -15.208   64.792
T90    80.000  -15.208   64.792
T50    32.000   16.792   48.792
Peak    1.000   56.292   57.292


====== Spectral Analysis Summary =====================================

Model      : spectral model: simple power-law (PL) and cutoff power-law (CPL)
Ph_index   : photon index: E^{Ph_index}
Ph_90err   : 90% error of the photon index
Epeak      : Epeak in keV
Epeak_90err: 90% error of Epeak
Norm       : normalization at 50 keV in both the PL model and CPL model
Nomr_90err : 90% error of the normalization
chi2       : Chi-Squared
dof        : degree of freedo

=== Time-averaged spectral analysis ===
(Best model with acceptable fit: PL)

Model Ph_index Ph_90err_low Ph_90err_hi  Epeak  Epeak_90err_low  Epeak_90err_hi  Norm       Nomr_90err_low    Norm_90err_hi    chi2    dof
PL      -1.873    -0.177      0.171       -           -               -         1.45e-03     -1.57e-04          1.54e-04      60.350   57
CPL     -1.875    -0.667      0.219     9999.360      N/A           N/A         1.45e-03        N/A               N/A         60.350   56


=== 1-s peak spectral analysis ===
(Best model with acceptable fit: N/A)

Model Ph_index Ph_90err_low Ph_90err_hi  Epeak  Epeak_90err_low  Epeak_90err_hi  Norm       Nomr_90err_low    Norm_90err_hi    chi2    dof
PL      -3.084     -1.067     0.737       -           -               -         1.84e-03     -1.22e-03          1.51e-03      48.840   57
CPL     -1.146      N/A       N/A          11.996      N/A           N/A         4.85e-02        N/A               N/A         48.040   56


=== Fluence/Peak Flux Summary ===

              Model    Band1     Band2     Band3     Band4     Band5     Total
                       15-25     25-50    50-100    100-350    15-150    15-350    keV
Fluence         PL   2.11e-07  3.09e-07  3.37e-07  6.89e-07  1.07e-06  1.55e-06   erg/cm2
      90%_error_low -2.91e-08 -2.80e-08 -4.97e-08 -1.88e-07 -1.13e-07 -2.41e-07   erg/cm2
      90%_error_hi   3.00e-08  2.80e-08  5.00e-08  2.30e-07  1.15e-07  2.73e-07   erg/cm2
Peak flux       PL   3.55e-01  1.43e-01  3.37e-02  9.65e-03  5.38e-01  5.42e-01   ph/cm2/s
      90%_error_low -1.15e-01 -6.75e-02 -3.37e-02 -9.65e-03 -1.66e-01 -1.69e-01   ph/cm2/s
      90%_error_hi   1.15e-01  6.39e-02  3.96e-02  2.77e-02  1.68e-01  1.72e-01   ph/cm2/s

Fluence        CPL   2.12e-07  3.08e-07  3.37e-07  6.88e-07  1.07e-06  1.55e-06   erg/cm2
      90%_error_low -3.41e-08 -2.71e-08    N/A       N/A    -1.77e-07 -4.80e-07   erg/cm2
      90%_error_hi   3.09e-08  3.61e-08    N/A       N/A     8.69e-08  1.34e-07   erg/cm2
Peak flux      CPL   3.58e-01  1.44e-01  3.56e-02  8.88e-03  5.40e-01  5.41e-01   ph/cm2/s
      90%_error_low -1.16e-01 -7.01e-02 -3.56e-02     N/A   -1.68e-01 -1.66e-01   ph/cm2/s
      90%_error_hi   1.12e-01  6.43e-02  3.86e-02     N/A    1.66e-01  1.75e-01   ph/cm2/s

======================================================================
Image
Pre-slew 15.0-350.0 keV image (Event data)
#   RAcent    DECcent   POSerr    Theta     Phi              Peak Cts       SNR   Name
  166.6503   -29.1087   0.0123    32.6615   -25.5862         1.9693963     15.605 TRIG_00535960

Foreground time interval of the image:
-15.208  64.792 (delta_t =  80.000 [sec])
Background time interval of the image:
-239.208 -15.208 (delta_t = 224.000 [sec])
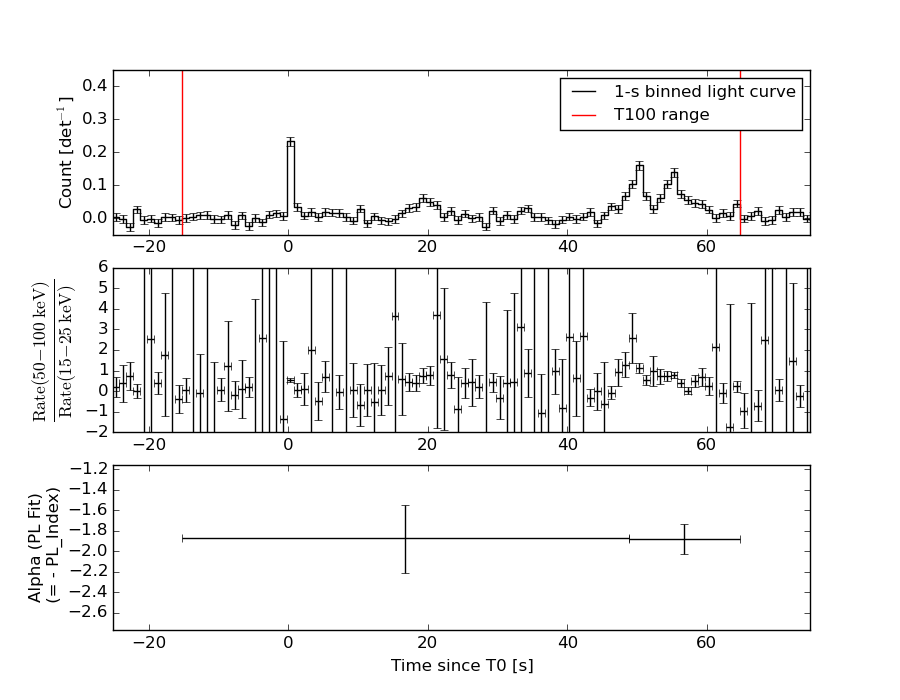
Light Curves
Note: The mask-weighted lightcurves have units of either count/det or counts/sec/det, where a det is 0.4 x 0.4 = 0.16 sq cm.
Full-time range; 1 s binning
Other quick-look light curves:
- 64 ms binning (zoomed)
- 16 ms binning (zoomed)
- 8 ms binning (zoomed)
- 2 ms binning (zoomed)
- SN=5 or 10 s binning (full-time range)
- Raw light curve
Spectra
- 64 ms binning (zoomed)
- 16 ms binning (zoomed)
- 8 ms binning (zoomed)
- 2 ms binning (zoomed)
- SN=5 or 10 s binning (full-time range)
- Raw light curve
Spectra
Notes:
- 1) The fitting includes the systematic errors.
- 2) When the burst includes telescope slew time periods, the fitting uses an average response file made from multiple 5-s response files through out the slew time plus single time preiod for the non-slew times, and weighted by the total counts in the corresponding time period using addrmf. An average response file is needed becuase a spectral fit using the pre-slew DRM will introduce some errors in both a spectral shape and a normalization if the PHA file contains a lot of the slew/post-slew time interval.
- 3) For fits to more complicated models (e.g. a power-law over a cutoff power-law), the BAT team has decided to require a chi-square improvement of more than 6 for each extra dof.
Time averaged spectrum fit using the average DRM
Power-law model
Time interval is from  -15.208 sec. to   64.792 sec.

Spectral model in power-law:
------------------------------------------------------------
Parameters  : value       lower 90%   higher 90%
Photon index: -1.87324     ( -0.176782   0.170569 )
Norm@50keV  : 1.45097E-03    ( -0.000156937   0.000153687 )
------------------------------------------------------------
#Fit statistic : Chi-Squared =          60.35 using 59 PHA bins.
# Reduced chi-squared =          1.059 for     57 degrees of freedom
# Null hypothesis probability =   3.555931e-01

Photon flux (15-150 keV)    in 80 sec: 0.205916 ( -0.018956  0.018977 ) ph/cm2/s
Energy fluence (15-150 keV)             : 1.06728e-06 ( -1.13408e-07  1.15135e-07 ) ergs/cm2
Cutoff power-law model

Time interval is from  -15.208 sec. to   64.792 sec.
Spectral model in the cutoff power-law:
------------------------------------------------------------
Parameters  : value       lower 90%   higher 90%
Photon index: -1.8748     ( -0.66741   0.218076 )
Epeak [keV] : 9999.36      (   )
Norm@50keV  : 1.45008E-03    (     )
------------------------------------------------------------
#Fit statistic : Chi-Squared =          60.35 using 59 PHA bins.
# Reduced chi-squared =          1.078 for     56 degrees of freedom
# Null hypothesis probability =   3.213793e-01

Photon flux (15-150 keV)    in 80 sec: 0.206146 ( -0.019366  0.018963 ) ph/cm2/s
Energy fluence (15-150 keV)             : 1.07186e-06 ( -1.76746e-07  8.694e-08 ) ergs/cm2
1-s peak spectrum fit
Power-law model

Time interval is from   56.292 sec. to   57.292 sec.

Spectral model in power-law:
------------------------------------------------------------
Parameters  : value       lower 90%   higher 90%
Photon index: -3.08398     ( -1.06665   0.736815 )
Norm@50keV  : 1.83896E-03    ( -0.00121822   0.00150606 )
------------------------------------------------------------
#Fit statistic : Chi-Squared =          48.84 using 59 PHA bins.
# Reduced chi-squared =         0.8569 for     57 degrees of freedom
# Null hypothesis probability =   7.705869e-01

Photon flux (15-150 keV)    in 1 sec: 0.538061 ( -0.166368  0.167676 ) ph/cm2/s
Energy fluence (15-150 keV)             : 2.30012e-08 ( -8.93619e-09  1.05432e-08 ) ergs/cm2
Cutoff power-law model
Time interval is from   56.292 sec. to   57.292 sec.
Spectral model in the cutoff power-law:
------------------------------------------------------------
Parameters  : value       lower 90%   higher 90%
Photon index: -1.14556     (       )
Epeak [keV] : 11.9958      (   )
Norm@50keV  : 4.84756E-02    (     )
------------------------------------------------------------
#Fit statistic : Chi-Squared =          48.04 using 59 PHA bins.
# Reduced chi-squared =         0.8579 for     56 degrees of freedom
# Null hypothesis probability =   7.664053e-01

Photon flux (15-150 keV)    in 1 sec: 0.540252 ( -0.167665  0.165829 ) ph/cm2/s
Energy fluence (15-150 keV)             : 0 ( 0  0 ) ergs/cm2
Time-resolved spectra
Distribution
T90 vs. Hardness ratio plot

T90                                   = 80.0 sec.
Hardness ratio (energy fluence ratio) = 1.09186767782
S(15-50 keV) vs. S(50-150 keV) plot
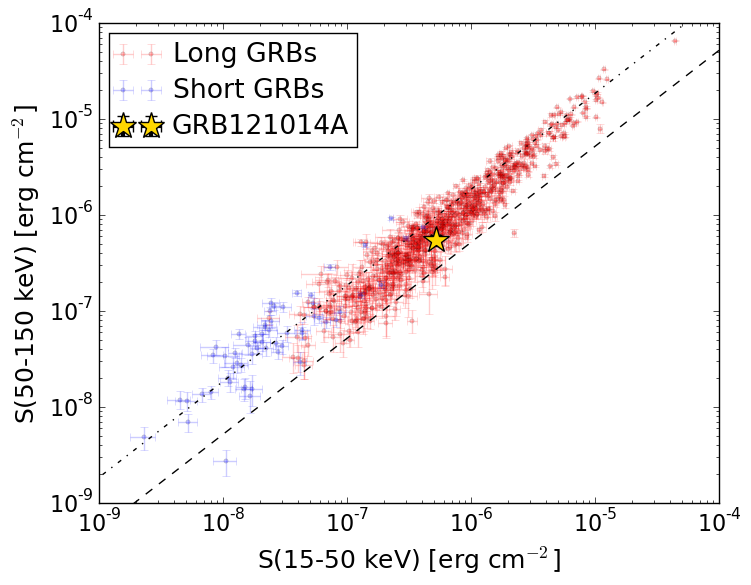
S(15-50 keV)  = 5.191908e-07
S(50-150 keV) = 5.480934e-07
The dash-dotted line and the dashed line traces the fluences calculated from the Band function with Epeak = 15 and 150 keV, respectively. Both lines assume a canonical values of alpha = -1 and beta = -2.5.
Mask shadow pattern
IMX = 5.781785104130348E-01, IMY = 2.768453301559334E-01
Spacecraft aspect plot
Bright source in the pre-burst/pre-slew/post-slew images
Pre-burst image of 15-350 keV band
Time interval of the image:
-239.208000 -15.208000

# RAcent  DECcent POSerr Theta    Phi  PeakCts   SNR AngSep     Name
#  [deg]    [deg]    ['] [deg]  [deg]                   [']
135.5255 -40.5553    0.8  43.3   17.1   4.7404  14.2    0.1	Vela X-1
123.5147  32.8737    2.8  42.0  142.9   1.7610   4.1 ------	UNKNOWN
158.4024  33.8467    2.5  34.2 -170.8   0.9993   4.6 ------	UNKNOWN
174.1599 -53.0036    2.3  56.5  -16.8   3.2558   5.0 ------	UNKNOWN
192.5811   8.4050    2.9  41.6 -103.2   3.9943   3.9 ------	UNKNOWN
Pre-slew background subtracted image of 15-350 keV band
Time interval of the image:
-15.208000 64.792000

# RAcent  DECcent POSerr Theta    Phi  PeakCts   SNR AngSep     Name
#  [deg]    [deg]    ['] [deg]  [deg]                   [']
135.5114 -40.5577    2.3  43.3   17.1  -1.0818  -5.1    0.8	Vela X-1
123.4322  36.8297    2.7  44.9  146.8   1.2082   4.3 ------	UNKNOWN
164.2670  27.1290    2.6  29.5 -157.5   0.5089   4.4 ------	UNKNOWN
166.6503 -29.1087    0.7  32.7  -25.6   1.9697  15.6 ------	UNKNOWN
Post-slew image of 15-350 keV band
Time interval of the image: