Analysis Summary
Notes:
- 1) No attempt has been made to eliminate the non-significant decimal places.
- 2) This batgrbproduct analysis is done using the HEASARC data.
- 3) This batgrbproduct analysis is using the flight position for the mask-weighting calculation.
======================================================================
                  BAT GRB EVENT DATA PROCESSING REPORT
    Process Script Ver: batgrbproduct v2.46
    Process Start Time: Sun Jan 12 23:56:17 EST 2014
             Host Name: batevent1
   Current Working Dir: /local/data/batevent/batevent_reproc/trigger536172
======================================================================

  Trigger: 00536172      Segment: 000

  BAT Trigger Time: 372194617.856   [s; MET]
      Trigger Stop: 372194618.368   [s; MET]
               UTC: 2012-10-17T19:23:28.085580    [includes UTCF correction]
       Where From?: TDRSS position message

  BAT
    RA: 288.815930530699   Dec: -1.59559934208673  [deg; J2000]

     Catalogged Source?: NO
     Point Source?:      YES
     GRB Indicated?:     YES    [ by BAT flight software ]
     Image S/N Ratio:    7.89
     Image Trigger?:     NO
     Rate S/N Ratio:     12.8840987267251  [ if not an image trigger ]
     Image S/N Ratio:    7.89

  Analysis Position:   [ source = BAT ]
    RA: 288.815930530699   Dec: -1.59559934208673  [deg; J2000]

  Refined Position:   [ source = BAT pre-slew burst ]
    RA: 288.819906327307   Dec: -1.5935344513545  [deg; J2000]
        { 19h 15m 16.8s , -01d 35' 36.7" }
         +/- 1.619639122542 [arcmin] (estimated 90% radius based on SNR)
         +/- 0.588331936767721 [arcmin] (formal 1-sigma fit error)
    SNR: 15.2738822802405

  Angular difference between the analysis and refined position is 0.268720 arcmin

  Partial Coding Fraction: 0.3515625    [ including projection effects ]

  Duration
     T90: 4.60799998044968 +/- 0.584071938052188
        Measured from: -2.30400002002716
                   to: 2.30399996042252     [s; relative to TRIGTIME]
     T50: 1.88399994373322 +/- 0.778562751619928
        Measured from: -0.452000021934509
                   to: 1.43199992179871     [s; relative to TRIGTIME]


  Fluence
     Peak Flux  (peak 1 second)
        Measured from: -0.308000028133392
                   to: 0.691999971866608     [s; relative to TRIGTIME]
     Total Fluence
        Measured from: -2.716000020504
                   to: 2.56400001049042     [s; relative to TRIGTIME]

             Band 1     Band 2     Band 3     Band 4
              15-25      25-50     50-100    100-350     keV
 Total     0.319030   0.437202   0.266023   0.001824
           0.033333   0.035824   0.030926   0.033236 [error]
 Peak      0.100761   0.138871   0.116742  -0.004119
           0.015308   0.016861   0.014267   0.014554 [error]

     [ fluence units of on-axis counts / fully illuminated detector ]

======================================================================


====== Table of the duration information =============================

        Value   tstart    tstop
T100    5.280   -2.716    2.564
T90     4.608   -2.304    2.304
T50     1.884   -0.452    1.432
Peak    1.000   -0.308    0.692


====== Spectral Analysis Summary =====================================

Model      : spectral model: simple power-law (PL) and cutoff power-law (CPL)
Ph_index   : photon index: E^{Ph_index}
Ph_90err   : 90% error of the photon index
Epeak      : Epeak in keV
Epeak_90err: 90% error of Epeak
Norm       : normalization at 50 keV in both the PL model and CPL model
Nomr_90err : 90% error of the normalization
chi2       : Chi-Squared
dof        : degree of freedo

=== Time-averaged spectral analysis ===
(Best model with acceptable fit: PL)

Model Ph_index Ph_90err_low Ph_90err_hi  Epeak  Epeak_90err_low  Epeak_90err_hi  Norm       Nomr_90err_low    Norm_90err_hi    chi2    dof
PL      -1.746    -0.174      0.169       -           -               -         1.35e-02     -1.45e-03          1.43e-03      43.570   57
CPL     -1.289    -0.578      0.815       69.912     -19.636       -69.912      2.40e-02        N/A               N/A         42.300   56


=== 1-s peak spectral analysis ===
(Best model with acceptable fit: PL)

Model Ph_index Ph_90err_low Ph_90err_hi  Epeak  Epeak_90err_low  Epeak_90err_hi  Norm       Nomr_90err_low    Norm_90err_hi    chi2    dof
PL      -1.660     -0.218     0.210       -           -               -         2.50e-02     -3.43e-03          3.38e-03      46.920   57
CPL     -0.687     -0.892     1.097       64.539     -15.099       142.938      8.09e-02     -8.09e-02          2.15e-01      43.410   56


=== Fluence/Peak Flux Summary ===

              Model    Band1     Band2     Band3     Band4     Band5     Total
                       15-25     25-50    50-100    100-350    15-150    15-350    keV
Fluence         PL   1.14e-07  1.81e-07  2.16e-07  5.00e-07  6.56e-07  1.01e-06   erg/cm2
      90%_error_low -1.66e-08 -1.73e-08 -3.12e-08 -1.34e-07 -7.27e-08 -1.66e-07   erg/cm2
      90%_error_hi   1.71e-08  1.73e-08  3.13e-08  1.63e-07  7.38e-08  1.90e-07   erg/cm2
Peak flux       PL   1.20e+00  1.10e+00  6.95e-01  6.74e-01  3.27e+00  3.67e+00   ph/cm2/s
      90%_error_low -2.32e-01 -1.42e-01 -1.21e-01 -2.05e-01 -4.18e-01 -4.68e-01   ph/cm2/s
      90%_error_hi   2.43e-01  1.42e-01  1.20e-01  2.52e-01  4.18e-01  4.70e-01   ph/cm2/s

Fluence        CPL   1.09e-07  1.91e-07  2.16e-07  2.36e-07  6.27e-07  7.51e-07   erg/cm2
      90%_error_low -1.90e-08 -2.28e-08 -3.39e-08 -1.53e-07 -8.33e-08 -1.77e-07   erg/cm2
      90%_error_hi   1.91e-08  2.39e-08  3.34e-08  3.09e-07  8.49e-08  3.31e-07   erg/cm2
Peak flux      CPL   1.03e+00  1.21e+00  7.39e-01  2.56e-01  3.16e+00  3.24e+00   ph/cm2/s
      90%_error_low -2.78e-01 -1.78e-01 -1.37e-01 -1.54e-01 -4.30e-01 -4.67e-01   ph/cm2/s
      90%_error_hi   2.87e-01  1.86e-01  1.40e-01  3.71e-01  4.30e-01  5.26e-01   ph/cm2/s

======================================================================
Image
Pre-slew 15.0-350.0 keV image (Event data)
#   RAcent    DECcent   POSerr    Theta     Phi              Peak Cts       SNR   Name
  288.8199    -1.5935   0.0126    35.9570    37.1032         1.1937008     15.274 TRIG_00536172

Foreground time interval of the image:
 -2.716   2.564 (delta_t =   5.280 [sec])
Background time interval of the image:
-187.755  -2.716 (delta_t = 185.039 [sec])
Light Curves
Note: The mask-weighted lightcurves have units of either count/det or counts/sec/det, where a det is 0.4 x 0.4 = 0.16 sq cm.
Full-time range; 1 s binning
Other quick-look light curves:
- 64 ms binning (zoomed)
- 16 ms binning (zoomed)
- 8 ms binning (zoomed)
- 2 ms binning (zoomed)
- SN=5 or 10 s binning (full-time range)
- Raw light curve
Spectra
- 64 ms binning (zoomed)
- 16 ms binning (zoomed)
- 8 ms binning (zoomed)
- 2 ms binning (zoomed)
- SN=5 or 10 s binning (full-time range)
- Raw light curve
Spectra
Notes:
- 1) The fitting includes the systematic errors.
- 2) When the burst includes telescope slew time periods, the fitting uses an average response file made from multiple 5-s response files through out the slew time plus single time preiod for the non-slew times, and weighted by the total counts in the corresponding time period using addrmf. An average response file is needed becuase a spectral fit using the pre-slew DRM will introduce some errors in both a spectral shape and a normalization if the PHA file contains a lot of the slew/post-slew time interval.
- 3) For fits to more complicated models (e.g. a power-law over a cutoff power-law), the BAT team has decided to require a chi-square improvement of more than 6 for each extra dof.
Time averaged spectrum fit using the average DRM
Power-law model
Time interval is from   -2.716 sec. to    2.564 sec.

Spectral model in power-law:
------------------------------------------------------------
Parameters  : value       lower 90%   higher 90%
Photon index: -1.74616     ( -0.174387   0.169493 )
Norm@50keV  : 1.34538E-02    ( -0.00144954   0.00142769 )
------------------------------------------------------------
#Fit statistic : Chi-Squared =          43.57 using 59 PHA bins.
# Reduced chi-squared =         0.7644 for     57 degrees of freedom
# Null hypothesis probability =   9.047036e-01

Photon flux (15-150 keV)    in 5.28 sec: 1.81671 ( -0.17484  0.17496 ) ph/cm2/s
Energy fluence (15-150 keV)             : 6.55728e-07 ( -7.27484e-08  7.37526e-08 ) ergs/cm2
Cutoff power-law model
Time interval is from   -2.716 sec. to    2.564 sec.
Spectral model in the cutoff power-law:
------------------------------------------------------------
Parameters  : value       lower 90%   higher 90%
Photon index: -1.28865     ( -0.578177   0.814573 )
Epeak [keV] : 69.9122      ( -19.6357 -69.9124 )
Norm@50keV  : 2.40079E-02    (     )
------------------------------------------------------------
#Fit statistic : Chi-Squared =          42.30 using 59 PHA bins.
# Reduced chi-squared =         0.7553 for     56 degrees of freedom
# Null hypothesis probability =   9.121553e-01

Photon flux (15-150 keV)    in 5.28 sec: 1.78262 ( -0.18244  0.18217 ) ph/cm2/s
Energy fluence (15-150 keV)             : 6.26968e-07 ( -8.32999e-08  8.49235e-08 ) ergs/cm2
1-s peak spectrum fit
Power-law model
Time interval is from   -0.308 sec. to    0.692 sec.

Spectral model in power-law:
------------------------------------------------------------
Parameters  : value       lower 90%   higher 90%
Photon index: -1.65991     ( -0.217744   0.210452 )
Norm@50keV  : 2.49970E-02    ( -0.00342977   0.00338243 )
------------------------------------------------------------
#Fit statistic : Chi-Squared =          46.92 using 59 PHA bins.
# Reduced chi-squared =         0.8231 for     57 degrees of freedom
# Null hypothesis probability =   8.272306e-01

Photon flux (15-150 keV)    in 1 sec: 3.27487 ( -0.41752  0.4179 ) ph/cm2/s
Energy fluence (15-150 keV)             : 2.3229e-07 ( -3.34288e-08  3.38867e-08 ) ergs/cm2
Cutoff power-law model
Time interval is from   -0.308 sec. to    0.692 sec.
Spectral model in the cutoff power-law:
------------------------------------------------------------
Parameters  : value       lower 90%   higher 90%
Photon index: -0.687246     ( -0.892177   1.09718 )
Epeak [keV] : 64.5386      ( -15.0997 142.938 )
Norm@50keV  : 8.08901E-02    ( -0.0808895   0.214798 )
------------------------------------------------------------
#Fit statistic : Chi-Squared =          43.41 using 59 PHA bins.
# Reduced chi-squared =         0.7752 for     56 degrees of freedom
# Null hypothesis probability =   8.902932e-01

Photon flux (15-150 keV)    in 1 sec: 3.16485 ( -0.43038  0.43028 ) ph/cm2/s
Energy fluence (15-150 keV)             : 2.17836e-07 ( -3.45666e-08  3.59864e-08 ) ergs/cm2
Time-resolved spectra

Distribution
T90 vs. Hardness ratio plot
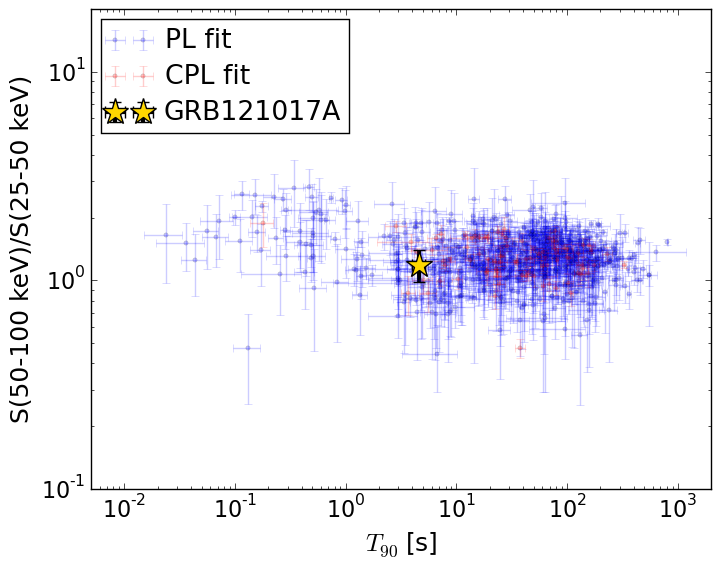
T90                                   = 4.608 sec.
Hardness ratio (energy fluence ratio) = 1.19242170639
S(15-50 keV) vs. S(50-150 keV) plot
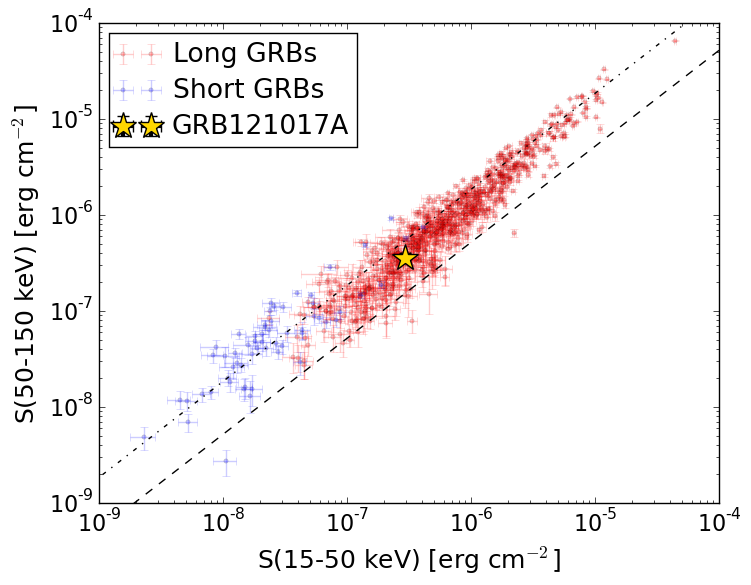
S(15-50 keV)  = 2.951843e-07
S(50-150 keV) = 3.605391e-07
The dash-dotted line and the dashed line traces the fluences calculated from the Band function with Epeak = 15 and 150 keV, respectively. Both lines assume a canonical values of alpha = -1 and beta = -2.5.
Mask shadow pattern
IMX = 5.785397549756811E-01, IMY = -4.375974786548340E-01
Spacecraft aspect plot
Bright source in the pre-burst/pre-slew/post-slew images
Pre-burst image of 15-350 keV band
Time interval of the image:
-187.755400 -2.716000

# RAcent  DECcent POSerr Theta    Phi  PeakCts   SNR AngSep     Name
#  [deg]    [deg]    ['] [deg]  [deg]                   [']
186.5332 -62.6913    4.2  58.7 -153.3  -8.9124  -2.8    5.8	GX 301-2
245.0045 -15.6312    1.2  23.7  -62.4   6.3623   9.8    1.5	Sco X-1
255.8507 -37.6715    7.6  11.1 -141.3   0.7274   1.5   12.2	4U 1700-377
256.2850 -36.2489    0.0  10.0 -136.4  -0.3725  -0.8   12.7	GX 349+2
262.9889 -24.8942    5.7   5.6  -30.0   0.9277   2.0    9.0	GX 1+4
264.6857 -44.5947    6.6  14.6  177.4   0.8385   1.7    9.0	4U 1735-44
268.3875  -1.3037    5.4  28.8    0.7  -1.1776  -2.2    9.0	SW J1753.5-0127
270.3628 -24.9866    4.7   6.6   36.3   1.0778   2.4    7.0	GX 5-1
270.3583 -25.8716    3.0   5.9   41.7   1.7385   3.9    8.3	GRS 1758-258
273.9649 -13.8853    7.7  17.9   22.4   0.7475   1.5    9.4	GX 17+2
275.9257 -30.3679  377.4   8.9   89.9   0.0156   0.0    0.1	H1820-303
285.1500 -24.9733   10.5  18.0   73.5   0.6376   1.1    7.0	HT1900.1-2455
288.8338  10.9472   15.6  46.7   27.1   1.0027   0.7    2.1	GRS 1915+105
262.9007 -33.9771    7.5   4.6 -156.1   0.7329   1.5    9.6	GX 354-0
306.9751 -14.7399    3.7  40.9   72.4   6.6480   3.1 ------	UNKNOWN
295.8001   3.5394    2.7  44.3   40.9   5.9252   4.3 ------	UNKNOWN
301.3533 -24.8278    2.9  32.0   84.4   3.6803   4.0 ------	UNKNOWN
243.1094 -78.1606    2.9  49.2 -179.1   4.3664   4.0 ------	UNKNOWN
265.8762   5.2902    4.1  35.3   -4.6   1.6704   2.8 ------	UNKNOWN
263.5494   9.8124    3.2  39.8   -8.2   2.5392   3.6 ------	UNKNOWN
251.7937  23.8175    3.2  55.4  -20.4   6.4115   3.6 ------	UNKNOWN
	UNKNOWN
Pre-slew background subtracted image of 15-350 keV band
Time interval of the image:
-2.716000 2.564000

# RAcent  DECcent POSerr Theta    Phi  PeakCts   SNR AngSep     Name
#  [deg]    [deg]    ['] [deg]  [deg]                   [']
186.6605 -62.7593   40.1  58.6 -153.3  -0.0757  -0.3    0.7	GX 301-2
245.0113 -15.7891   11.2  23.6  -62.7  -0.0519  -1.0    9.1	Sco X-1
256.0040 -37.9986    4.1  11.3 -142.9  -0.1121  -2.8    9.3	4U 1700-377
256.4599 -36.5782   13.5  10.1 -138.3   0.0331   0.9    9.4	GX 349+2
262.9761 -24.7043   42.1   5.8  -29.4  -0.0110  -0.3    3.1	GX 1+4
264.6699 -44.2942    6.5  14.3  177.6  -0.0699  -1.8    9.9	4U 1735-44
268.4033  -1.4545   24.7  28.7    0.8   0.0226   0.5    2.1	SW J1753.5-0127
270.1685 -25.2130  150.6   6.3   36.4  -0.0030  -0.1   10.2	GX 5-1
270.4611 -25.8889   68.1   5.9   42.5   0.0069   0.2   12.2	GRS 1758-258
274.1486 -14.1753    5.1  17.7   23.3  -0.0961  -2.3   11.8	GX 17+2
275.8205 -30.4003   12.0   8.9   90.1  -0.0419  -1.0    5.8	H1820-303
285.1965 -25.0558    4.4  18.1   73.8  -0.1198  -2.6   11.9	HT1900.1-2455
288.7976  10.9219    5.0  46.6   27.1  -0.2739  -2.3    1.4	GRS 1915+105
262.9127 -33.8497   13.6   4.5 -155.4  -0.0346  -0.8    3.9	GX 354-0
288.8199  -1.5935    0.8  36.0   37.1   1.1937  15.3 ------	UNKNOWN
285.0964   3.7999    2.9  38.6   27.2   0.2851   4.0 ------	UNKNOWN
235.4193 -67.5001    2.2  41.6 -168.2   0.3539   5.3 ------	UNKNOWN
228.0810 -71.1827    2.7  46.0 -169.2   0.3318   4.3 ------	UNKNOWN
215.8965 -48.5471    2.6  41.8 -135.8   0.3400   4.3 ------	UNKNOWN
190.0052 -63.5308    3.0  57.1 -154.1   0.7720   3.9 ------	UNKNOWN
193.1989 -57.6535    2.3  55.8 -147.0   1.1760   5.1 ------	UNKNOWN
	UNKNOWN
Post-slew image of 15-350 keV band
Time interval of the image:
79.044600 542.187200

# RAcent  DECcent POSerr Theta    Phi  PeakCts   SNR AngSep     Name
#  [deg]    [deg]    ['] [deg]  [deg]                   [']
254.5015  35.3832    5.7  48.9  -27.8  -5.4559  -2.0    3.3	Her X-1
255.9005 -37.6972    5.9  47.1 -134.4  -7.7048  -1.9    9.7	4U 1700-377
256.2511 -36.3116   81.4  45.9 -133.2   0.5601   0.1   11.1	GX 349+2
263.0976 -24.6140    7.3  33.8 -125.3   3.0115   1.6    9.3	GX 1+4
264.9253 -44.5085    9.4  47.8 -147.4   3.6817   1.2    8.6	4U 1735-44
268.3613  -1.5966    5.8  20.4  -80.6   2.8253   2.0    8.7	SW J1753.5-0127
270.4311 -25.0206    8.9  29.4 -134.7   2.1846   1.3    8.7	GX 5-1
270.4345 -25.7815   11.6  30.0 -135.7   1.6707   1.0    7.5	GRS 1758-258
273.9785 -14.1841    6.8  19.3 -121.8   2.2576   1.7    9.0	GX 17+2
275.9726 -30.3591    6.3  31.2 -148.6   2.9459   1.8    2.5	H1820-303
285.0294 -24.9215  431.1  23.6 -161.8   0.0352   0.0    0.4	HT1900.1-2455
288.9188  10.8848    8.8  12.5   10.3   1.5887   1.3    8.0	GRS 1915+105
299.6413  35.3480    5.1  38.3   24.0   4.6308   2.3    9.1	Cyg X-1
308.1123  40.9523  216.4  46.0   30.0   0.1786   0.1    0.1	Cyg X-3
263.1585 -33.9629   46.6  40.3 -136.6   0.5454   0.2   11.4	GX 354-0
303.5030 -25.4640    2.6  27.8  160.2   6.8004   4.4 ------	UNKNOWN
286.2551  48.1821    2.7  49.8    7.5  12.7779   4.3 ------	UNKNOWN
253.6375  44.1074    3.3  55.4  -20.4  15.2954   3.6 ------	UNKNOWN