Analysis Summary
Notes:
- 1) No attempt has been made to eliminate the non-significant decimal places.
- 2) This batgrbproduct analysis is done using the HEASARC data.
- 3) This batgrbproduct analysis is using the flight position for the mask-weighting calculation.
======================================================================
                  BAT GRB EVENT DATA PROCESSING REPORT
    Process Script Ver: batgrbproduct v2.46
    Process Start Time: Sun Jan 12 23:46:54 EST 2014
             Host Name: batevent1
   Current Working Dir: /local/data/batevent/batevent_reproc/trigger536831
======================================================================

  Trigger: 00536831      Segment: 000

  BAT Trigger Time: 373015959.552   [s; MET]
      Trigger Stop: 373015960.576   [s; MET]
               UTC: 2012-10-27T07:32:29.746680    [includes UTCF correction]
       Where From?: TDRSS position message

  BAT
    RA: 63.6104836572932   Dec: -58.8014814868824  [deg; J2000]

     Catalogged Source?: NO
     Point Source?:      YES
     GRB Indicated?:     YES    [ by BAT flight software ]
     Image S/N Ratio:    7.88
     Image Trigger?:     NO
     Rate S/N Ratio:     13.8202749610853  [ if not an image trigger ]
     Image S/N Ratio:    7.88

  Analysis Position:   [ source = BAT ]
    RA: 63.6104836572932   Dec: -58.8014814868824  [deg; J2000]

  Refined Position:   [ source = BAT pre-slew burst ]
    RA: 63.5952048806683   Dec: -58.8334460657927  [deg; J2000]
        { 04h 14m 22.8s , -58d 50' 00.4" }
         +/- 0.908337518372024 [arcmin] (estimated 90% radius based on SNR)
         +/- 0.318947753563983 [arcmin] (formal 1-sigma fit error)
    SNR: 34.8951574009833

  Angular difference between the analysis and refined position is 1.975737 arcmin

  Partial Coding Fraction: 0.8046875    [ including projection effects ]

  Duration
     T90: 80.0879999399185 +/- 40.7568951405407
        Measured from: -4.54799997806549
                   to: 75.539999961853     [s; relative to TRIGTIME]
     T50: 39.9239999651909 +/- 6.52294532357254
        Measured from: 3.37999999523163
                   to: 43.3039999604225     [s; relative to TRIGTIME]


  Fluence
     Peak Flux  (peak 1 second)
        Measured from: 2
                   to: 3     [s; relative to TRIGTIME]
     Total Fluence
        Measured from: -9.33999997377396
                   to: 135.356000006199     [s; relative to TRIGTIME]

             Band 1     Band 2     Band 3     Band 4
              15-25      25-50     50-100    100-350     keV
 Total     1.355095   1.537651   0.921238   0.205047
           0.066073   0.068031   0.059614   0.051341 [error]
 Peak      0.058193   0.057845   0.035330   0.013256
           0.006494   0.006802   0.006068   0.004820 [error]

     [ fluence units of on-axis counts / fully illuminated detector ]

======================================================================


====== Table of the duration information =============================

        Value   tstart    tstop
T100  144.696   -9.340  135.356
T90    80.088   -4.548   75.540
T50    39.924    3.380   43.304
Peak    1.000    2.000    3.000


====== Spectral Analysis Summary =====================================

Model      : spectral model: simple power-law (PL) and cutoff power-law (CPL)
Ph_index   : photon index: E^{Ph_index}
Ph_90err   : 90% error of the photon index
Epeak      : Epeak in keV
Epeak_90err: 90% error of Epeak
Norm       : normalization at 50 keV in both the PL model and CPL model
Nomr_90err : 90% error of the normalization
chi2       : Chi-Squared
dof        : degree of freedo

=== Time-averaged spectral analysis ===
(Best model with acceptable fit: PL)

Model Ph_index Ph_90err_low Ph_90err_hi  Epeak  Epeak_90err_low  Epeak_90err_hi  Norm       Nomr_90err_low    Norm_90err_hi    chi2    dof
PL      -1.813    -0.103      0.102       -           -               -         1.65e-03     -9.92e-05          9.83e-05      45.290   57
CPL     -1.580    -0.341      0.413       82.462     -32.413       -82.462      2.20e-03     -6.27e-04          1.43e-03      44.200   56


=== 1-s peak spectral analysis ===
(Best model with acceptable fit: PL)

Model Ph_index Ph_90err_low Ph_90err_hi  Epeak  Epeak_90err_low  Epeak_90err_hi  Norm       Nomr_90err_low    Norm_90err_hi    chi2    dof
PL      -1.667     -0.246     0.239       -           -               -         9.85e-03     -1.40e-03          1.36e-03      57.560   57
CPL     -1.680     -0.234     0.274     9999.350    -9999.340      -9999.350      9.82e-03     -8.35e-03          -2.73e-03      57.580   56


=== Fluence/Peak Flux Summary ===

              Model    Band1     Band2     Band3     Band4     Band5     Total
                       15-25     25-50    50-100    100-350    15-150    15-350    keV
Fluence         PL   4.10e-07  6.23e-07  7.09e-07  1.54e-06  2.20e-06  3.28e-06   erg/cm2
      90%_error_low -3.52e-08 -3.33e-08 -5.85e-08 -2.51e-07 -1.34e-07 -3.06e-07   erg/cm2
      90%_error_hi   3.60e-08  3.33e-08  5.88e-08  2.83e-07  1.35e-07  3.31e-07   erg/cm2
Peak flux       PL   4.76e-01  4.34e-01  2.73e-01  2.63e-01  1.29e+00  1.45e+00   ph/cm2/s
      90%_error_low -9.66e-02 -5.51e-02 -5.17e-02 -8.88e-02 -1.62e-01 -1.84e-01   ph/cm2/s
      90%_error_hi   1.01e-01  5.48e-02  5.13e-02  1.14e-01  1.62e-01  1.86e-01   ph/cm2/s

Fluence        CPL   4.19e-07  5.66e-07  5.88e-07  1.37e-06  1.95e-06  2.70e-06   erg/cm2
      90%_error_low -4.01e-08 -5.26e-08 -5.82e-08 -8.11e-07 -1.75e-07    N/A      erg/cm2
      90%_error_hi   2.55e-08  2.53e-08  5.35e-08  2.46e-07  1.70e-07    N/A      erg/cm2
Peak flux      CPL   4.39e-01  3.37e-01  1.81e-01  1.67e-01  1.02e+00  1.12e+00   ph/cm2/s
      90%_error_low -1.17e-01 -8.42e-02 -2.70e-02 -4.14e-02 -2.45e-01 -2.18e-01   ph/cm2/s
      90%_error_hi   1.05e-01  6.63e-02  2.54e-02  3.29e-02  1.91e-01  1.77e-01   ph/cm2/s

======================================================================
Image
Pre-slew 15.0-350.0 keV image (Event data)
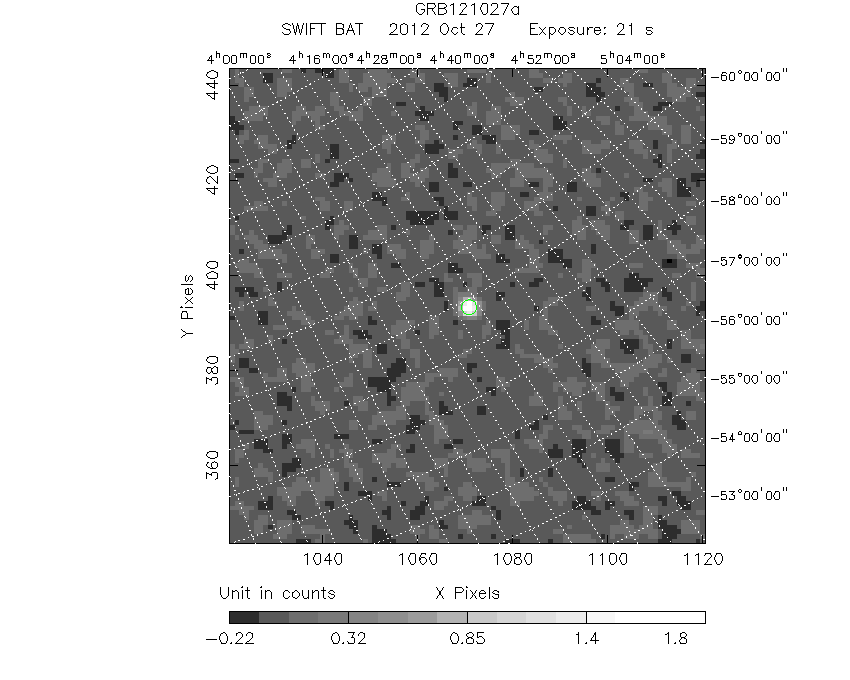
#   RAcent    DECcent   POSerr    Theta     Phi              Peak Cts       SNR   Name
   63.5952   -58.8334   0.0055    23.6638   156.4310         2.0164599     34.895 TRIG_00536831

Foreground time interval of the image:
 -9.340  11.749 (delta_t =  21.089 [sec])
Background time interval of the image:
-239.552  -9.340 (delta_t = 230.212 [sec])
Light Curves
Note: The mask-weighted lightcurves have units of either count/det or counts/sec/det, where a det is 0.4 x 0.4 = 0.16 sq cm.
Full-time range; 1 s binning
Other quick-look light curves:
- 64 ms binning (zoomed)
- 16 ms binning (zoomed)
- 8 ms binning (zoomed)
- 2 ms binning (zoomed)
- SN=5 or 10 s binning (full-time range)
- Raw light curve
Spectra
- 64 ms binning (zoomed)
- 16 ms binning (zoomed)
- 8 ms binning (zoomed)
- 2 ms binning (zoomed)
- SN=5 or 10 s binning (full-time range)
- Raw light curve
Spectra
Notes:
- 1) The fitting includes the systematic errors.
- 2) When the burst includes telescope slew time periods, the fitting uses an average response file made from multiple 5-s response files through out the slew time plus single time preiod for the non-slew times, and weighted by the total counts in the corresponding time period using addrmf. An average response file is needed becuase a spectral fit using the pre-slew DRM will introduce some errors in both a spectral shape and a normalization if the PHA file contains a lot of the slew/post-slew time interval.
- 3) For fits to more complicated models (e.g. a power-law over a cutoff power-law), the BAT team has decided to require a chi-square improvement of more than 6 for each extra dof.
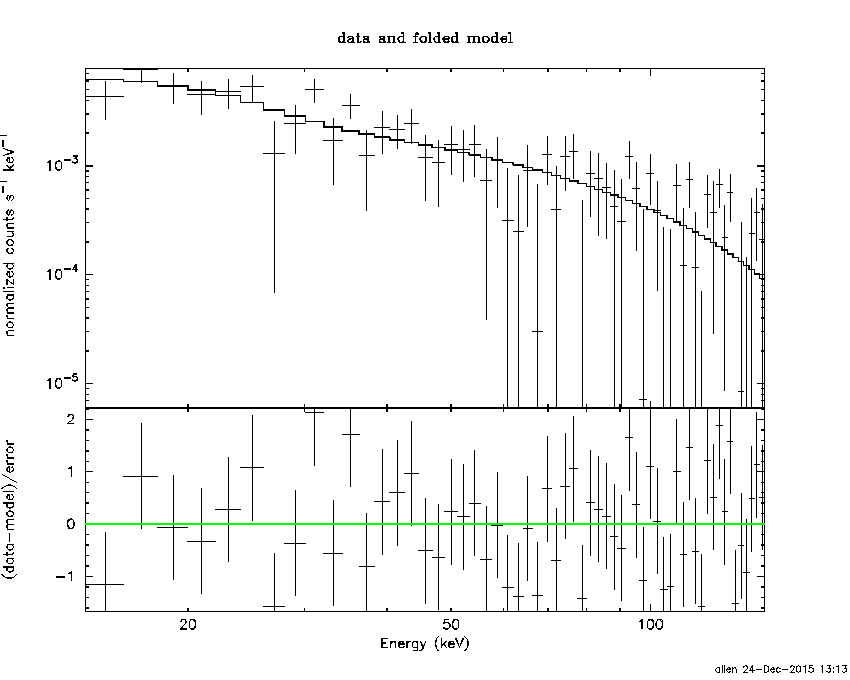
Time averaged spectrum fit using the average DRM
Power-law model
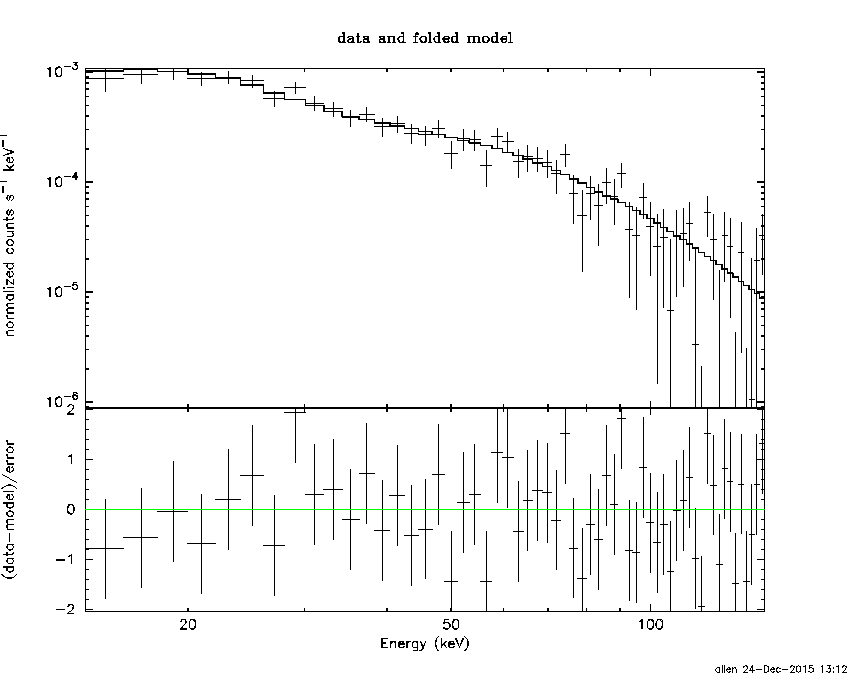
Time interval is from   -9.340 sec. to  135.356 sec.

Spectral model in power-law:
------------------------------------------------------------
Parameters  : value       lower 90%   higher 90%
Photon index: -1.8133     ( -0.103223   0.101532 )
Norm@50keV  : 1.65202E-03    ( -9.91706e-05   9.82527e-05 )
------------------------------------------------------------
#Fit statistic : Chi-Squared =          45.29 using 59 PHA bins.
# Reduced chi-squared =         0.7946 for     57 degrees of freedom
# Null hypothesis probability =   8.683033e-01

Photon flux (15-150 keV)    in 144.7 sec: 0.228842 ( -0.01245  0.012467 ) ph/cm2/s
Energy fluence (15-150 keV)             : 2.20008e-06 ( -1.33942e-07  1.35147e-07 ) ergs/cm2
Cutoff power-law model
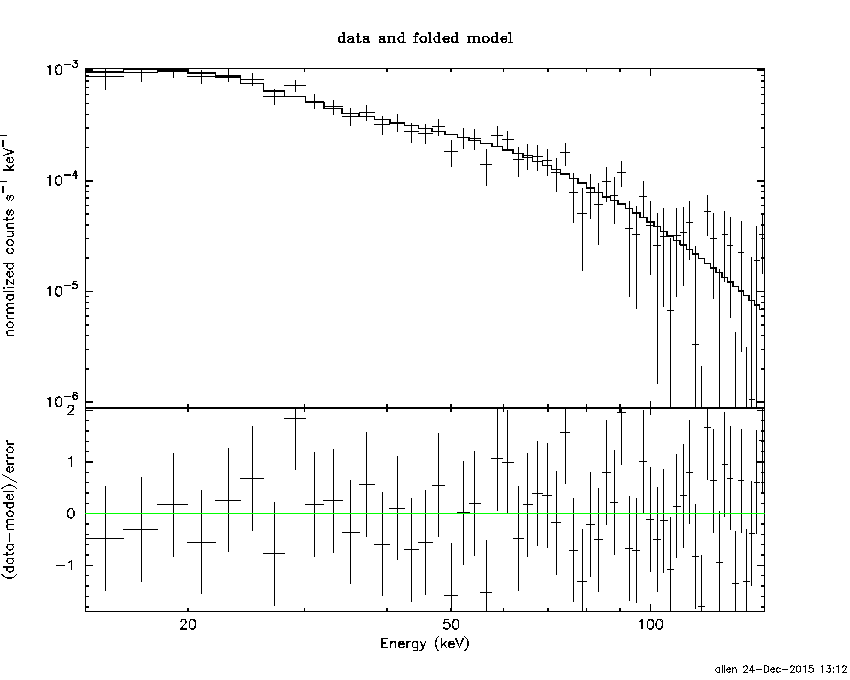
Time interval is from   -9.340 sec. to  135.356 sec.
Spectral model in the cutoff power-law:
------------------------------------------------------------
Parameters  : value       lower 90%   higher 90%
Photon index: -1.58021     ( -0.340545   0.41345 )
Epeak [keV] : 82.4624      ( -32.4126 -82.4625 )
Norm@50keV  : 2.20385E-03    ( -0.000627014   0.00143364 )
------------------------------------------------------------
#Fit statistic : Chi-Squared =          44.20 using 59 PHA bins.
# Reduced chi-squared =         0.7893 for     56 degrees of freedom
# Null hypothesis probability =   8.728695e-01

Photon flux (15-150 keV)    in 144.7 sec: 0.225775 ( -0.013385  0.013378 ) ph/cm2/s
Energy fluence (15-150 keV)             : 1.9459e-06 ( -1.75183e-07  1.69826e-07 ) ergs/cm2
1-s peak spectrum fit
Power-law model
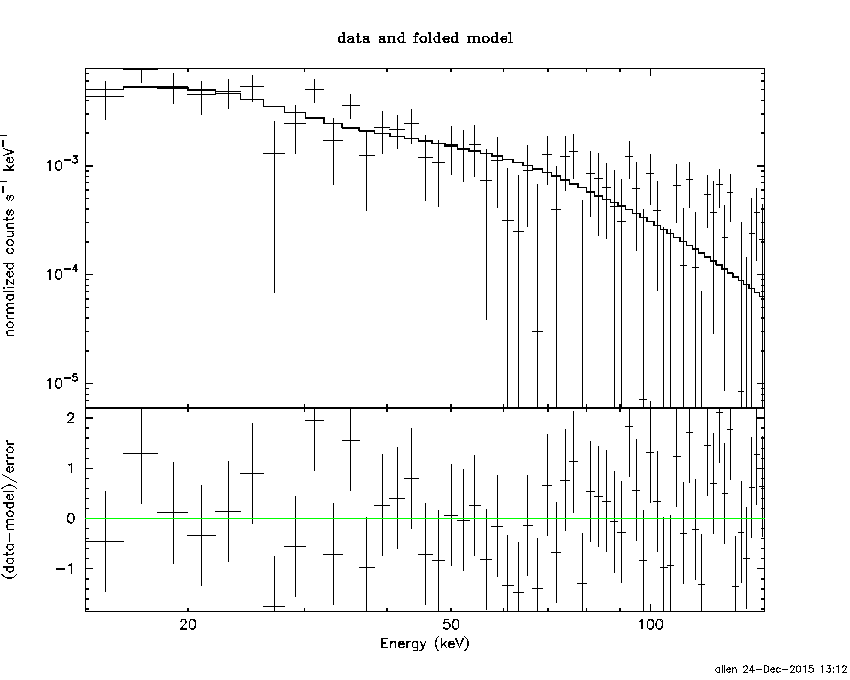
Time interval is from    2.000 sec. to    3.000 sec.

Spectral model in power-law:
------------------------------------------------------------
Parameters  : value       lower 90%   higher 90%
Photon index: -1.66714     ( -0.24625   0.239154 )
Norm@50keV  : 9.84652E-03    ( -0.00140378   0.00136352 )
------------------------------------------------------------
#Fit statistic : Chi-Squared =          57.56 using 59 PHA bins.
# Reduced chi-squared =          1.010 for     57 degrees of freedom
# Null hypothesis probability =   4.544195e-01

Photon flux (15-150 keV)    in 1 sec: 1.29313 ( -0.16169  0.16178 ) ph/cm2/s
Energy fluence (15-150 keV)             : 9.14387e-08 ( -1.37407e-08  1.40048e-08 ) ergs/cm2
Cutoff power-law model
Time interval is from    2.000 sec. to    3.000 sec.
Spectral model in the cutoff power-law:
------------------------------------------------------------
Parameters  : value       lower 90%   higher 90%
Photon index: -2.52496     ( -0.234668   0.2726 )
Epeak [keV] : 176.595      ( -9999.35 -9999.36 )
Norm@50keV  : 3.61952E-03    ( -0.002152   0.00347226 )
------------------------------------------------------------
#Fit statistic : Chi-Squared =          55.04 using 59 PHA bins.
# Reduced chi-squared =         0.9829 for     56 degrees of freedom
# Null hypothesis probability =   5.111123e-01

Photon flux (15-150 keV)    in 1 sec: 1.02380 ( -0.245255  0.19094 ) ph/cm2/s
Energy fluence (15-150 keV)             : 5.12366e-08 ( 0  0 ) ergs/cm2
Time-resolved spectra
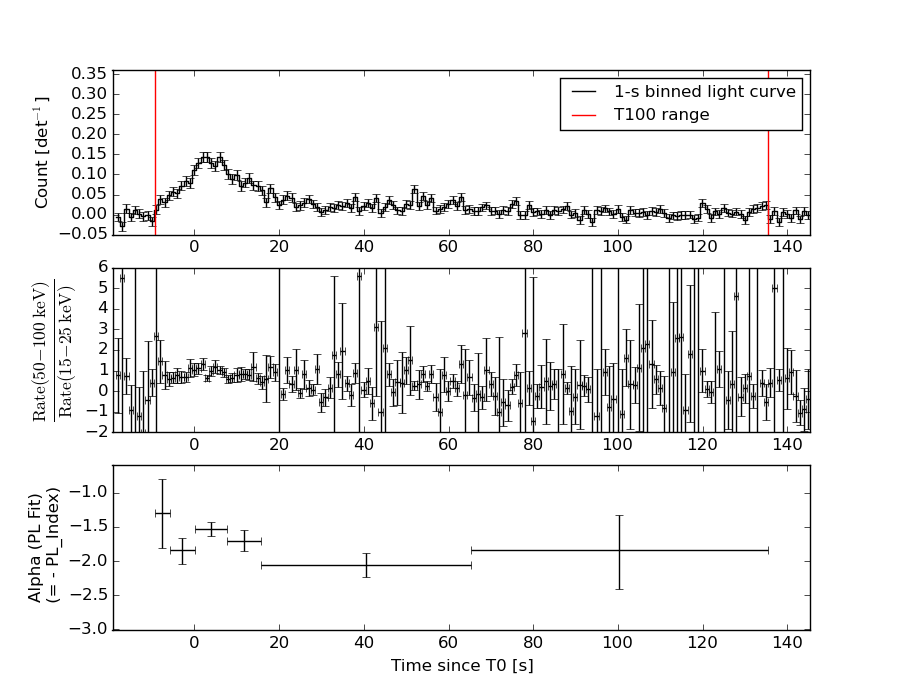
Distribution
T90 vs. Hardness ratio plot
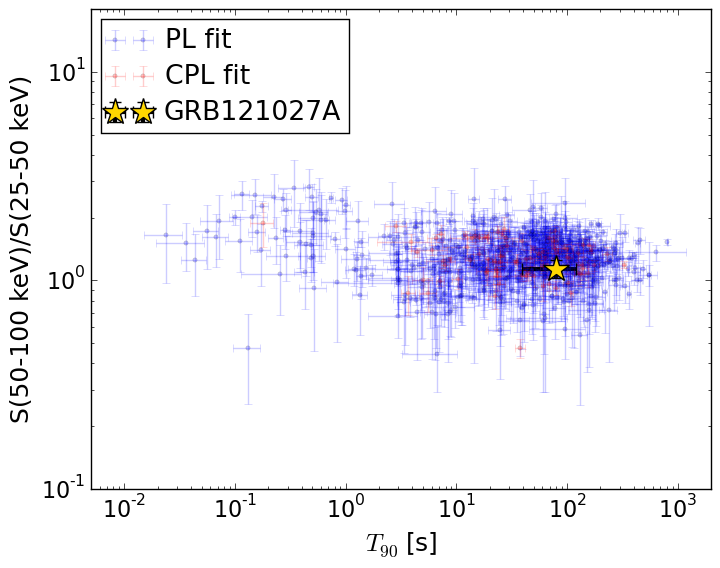
T90                                   = 80.088 sec.
Hardness ratio (energy fluence ratio) = 1.13820373186
S(15-50 keV) vs. S(50-150 keV) plot
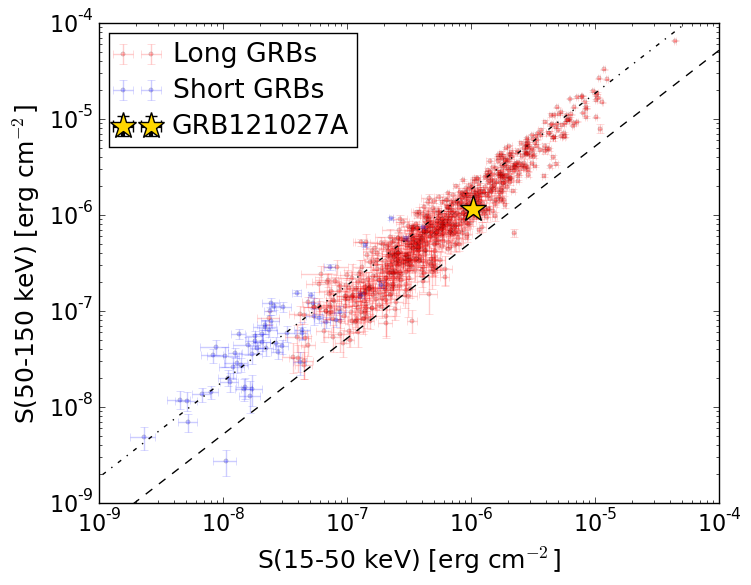
S(15-50 keV)  = 1.0324707e-06
S(50-150 keV) = 1.1676067e-06
The dash-dotted line and the dashed line traces the fluences calculated from the Band function with Epeak = 15 and 150 keV, respectively. Both lines assume a canonical values of alpha = -1 and beta = -2.5.
Mask shadow pattern
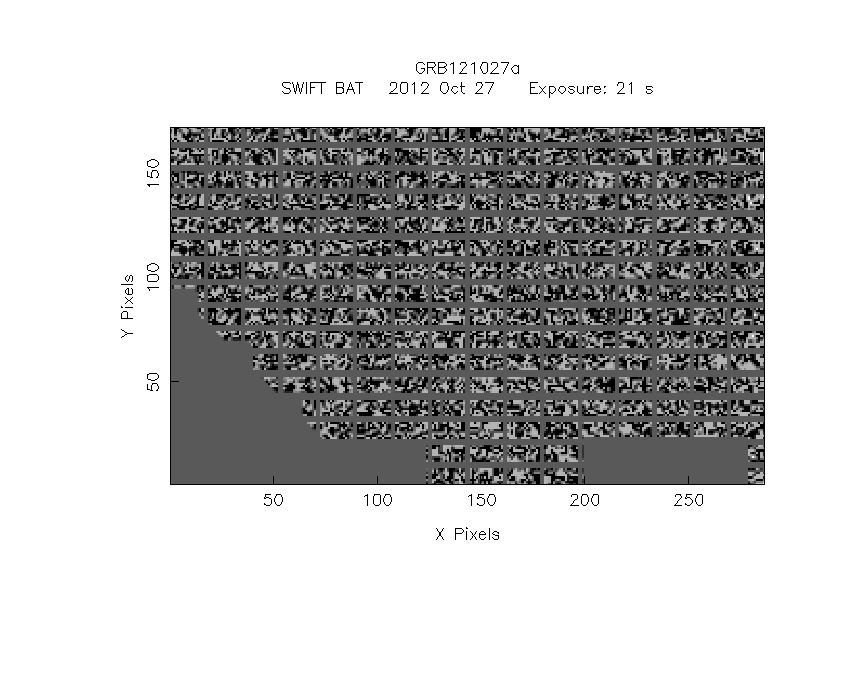
IMX = -4.016588797146752E-01, IMY = -1.752219331109239E-01
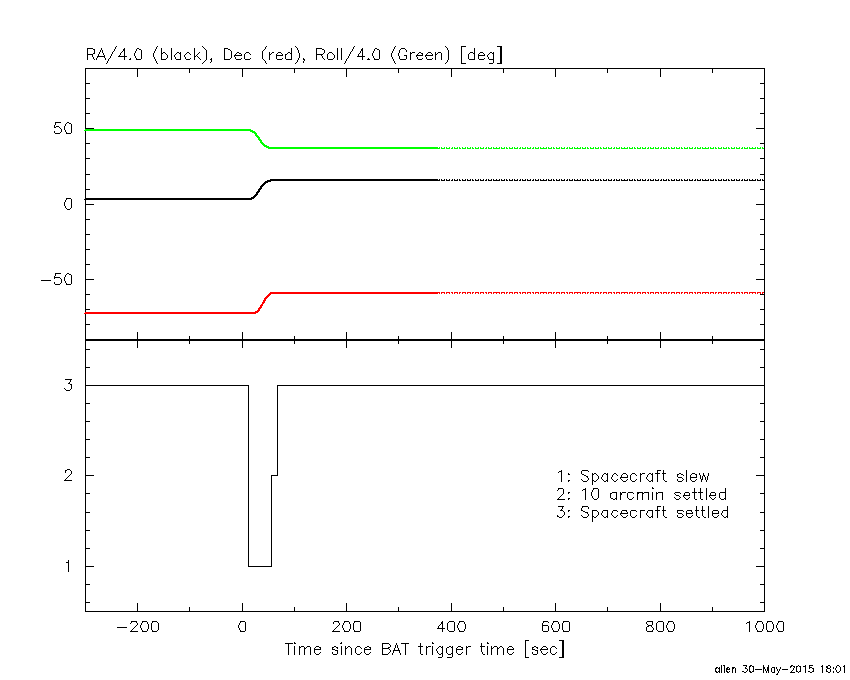
Spacecraft aspect plot
Bright source in the pre-burst/pre-slew/post-slew images
Pre-burst image of 15-350 keV band
Time interval of the image:
-239.552000 -9.340000

# RAcent  DECcent POSerr Theta    Phi  PeakCts   SNR AngSep     Name
#  [deg]    [deg]    ['] [deg]  [deg]                   [']
 35.3181 -49.3406    2.7  25.0  109.6   1.0001   4.3 ------	UNKNOWN
106.9755 -45.6353    2.0  48.1 -175.2   2.0386   5.8 ------	UNKNOWN
116.6008 -45.8831    3.3  50.5 -167.0   1.5673   3.5 ------	UNKNOWN
193.8585 -76.6885    2.7  31.0 -105.3   1.1198   4.3 ------	UNKNOWN
266.8881 -50.2341    3.1  47.4  -49.1   2.7053   3.7 ------	UNKNOWN
Pre-slew background subtracted image of 15-350 keV band
Time interval of the image:
-9.340000 11.748590

# RAcent  DECcent POSerr Theta    Phi  PeakCts   SNR AngSep     Name
#  [deg]    [deg]    ['] [deg]  [deg]                   [']
 18.0894 -60.2865    1.8  12.2   85.5   0.3537   6.3 ------	UNKNOWN
 93.0072 -42.0901    2.3  47.2  170.4   0.6493   5.1 ------	UNKNOWN
 63.5952 -58.8334    0.3  23.7  156.4   2.0162  34.9 ------	UNKNOWN
326.3690 -80.8268    3.0  13.2  -74.8   0.2009   3.8 ------	UNKNOWN
Post-slew image of 15-350 keV band
Time interval of the image:
56.548600 962.525900

# RAcent  DECcent POSerr Theta    Phi  PeakCts   SNR AngSep     Name
#  [deg]    [deg]    ['] [deg]  [deg]                   [']
135.6216 -40.5576    5.0  47.3 -137.4   3.5452   2.3    4.2	Vela X-1
304.6916 -62.9439    2.4  49.6  -26.6   5.3768   4.7 ------	UNKNOWN
136.4821 -85.4469    2.9  30.1  -66.8   2.9415   4.0 ------	UNKNOWN
127.5491 -20.9934    5.3  58.8 -159.2   9.0016   2.2 ------	UNKNOWN
129.2292 -37.8788    4.2  46.1 -144.9   3.1078   2.8 ------	UNKNOWN
297.8435 -54.1172    3.7  59.0  -24.4  13.4101   3.1 ------	UNKNOWN
295.0151 -58.0749    4.6  56.3  -28.3   6.8874   2.5 ------	UNKNOWN
135.9688 -30.5569    5.1  55.3 -145.3  10.7021   2.2 ------	UNKNOWN
141.9919 -43.1989    2.7  48.6 -130.3   9.8413   4.2 ------	UNKNOWN