Analysis Summary
Notes:
- 1) No attempt has been made to eliminate the non-significant decimal places.
- 2) This batgrbproduct analysis is done using the HEASARC data.
- 3) This batgrbproduct analysis is using the flight position for the mask-weighting calculation.
======================================================================
BAT GRB EVENT DATA PROCESSING REPORT
Process Script Ver: batgrbproduct v2.46
Process Start Time: Wed Jun 10 20:43:55 EDT 2015
Host Name: bat1
Current Working Dir: /local/data/bat1/alien/Swift_3rdBATcatalog/event/batevent_reproc/trigger537195
======================================================================
Trigger: 00537195 Segment: 000
BAT Trigger Time: 373416640.512 [s; MET]
Trigger Stop: 373416641.536 [s; MET]
UTC: 2012-10-31T22:50:30.689560 [includes UTCF correction]
Where From?: TDRSS position message
BAT
RA: 170.770786767707 Dec: -3.51064886408243 [deg; J2000]
Catalogged Source?: NO
Point Source?: YES
GRB Indicated?: YES [ by BAT flight software ]
Image S/N Ratio: 15.07
Image Trigger?: NO
Rate S/N Ratio: 35.5246393366632 [ if not an image trigger ]
Image S/N Ratio: 15.07
Analysis Position: [ source = BAT ]
RA: 170.770786767707 Dec: -3.51064886408243 [deg; J2000]
Refined Position: [ source = BAT pre-slew burst ]
RA: 170.776082247814 Dec: -3.51721591786905 [deg; J2000]
{ 11h 23m 06.3s , -03d 31' 02.0" }
+/- 0.970286926301917 [arcmin] (estimated 90% radius based on SNR)
+/- 0.34703749028974 [arcmin] (formal 1-sigma fit error)
SNR: 31.7564837492592
Angular difference between the analysis and refined position is 0.505793 arcmin
Partial Coding Fraction: 1.015625 [ including projection effects ]
Duration
T90: 226.199999928474 +/- 19.3833181453972
Measured from: -198.367999911308
to: 27.8320000171661 [s; relative to TRIGTIME]
T50: 195.799999952316 +/- 1.58267115966089
Measured from: -187.76399987936
to: 8.03600007295609 [s; relative to TRIGTIME]
Fluence
Peak Flux (peak 1 second)
Measured from: -190.72000002861
to: -189.72000002861 [s; relative to TRIGTIME]
Total Fluence
Measured from: -209.004000008106
to: 98.3079999685287 [s; relative to TRIGTIME]
Band 1 Band 2 Band 3 Band 4
15-25 25-50 50-100 100-350 keV
Total 3.580615 4.946582 3.608098 0.903695
0.101215 0.105918 0.095253 0.085569 [error]
Peak 0.069822 0.099456 0.112613 0.047212
0.007746 0.008811 0.008952 0.007105 [error]
[ fluence units of on-axis counts / fully illuminated detector ]
======================================================================
====== Table of the duration information =============================
Value tstart tstop
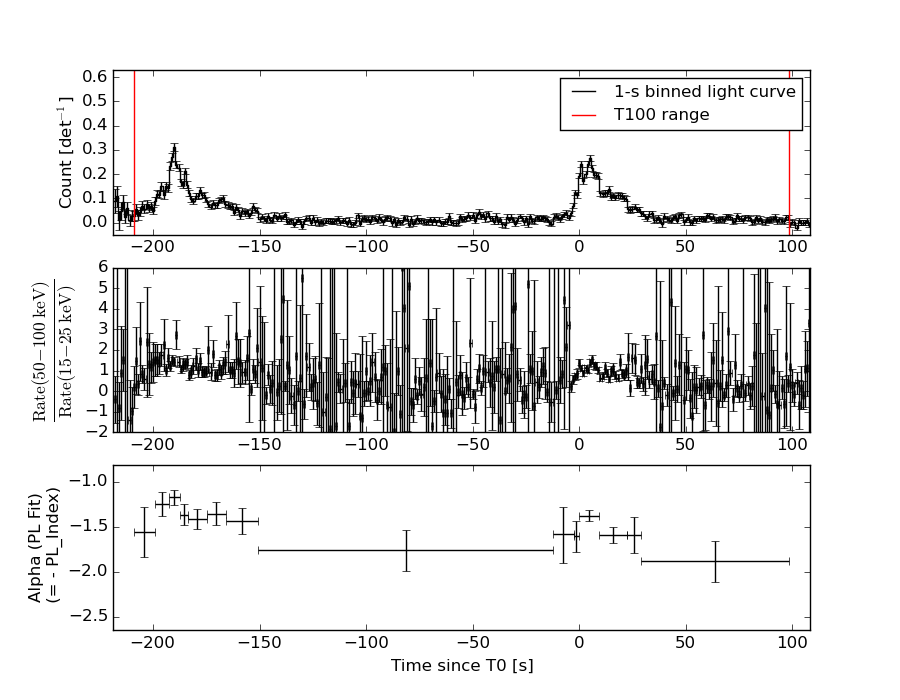
T100 307.312 -209.004 98.308
T90 226.200 -198.368 27.832
T50 195.800 -187.764 8.036
Peak 1.000 -190.720 -189.720
====== Spectral Analysis Summary =====================================
Model : spectral model: simple power-law (PL) and cutoff power-law (CPL)
Ph_index : photon index: E^{Ph_index}
Ph_90err : 90% error of the photon index
Epeak : Epeak in keV
Epeak_90err: 90% error of Epeak
Norm : normalization at 50 keV in both the PL model and CPL model
Nomr_90err : 90% error of the normalization
chi2 : Chi-Squared
dof : degree of freedo
=== Time-averaged spectral analysis ===
(Best model with acceptable fit: PL)
Model Ph_index Ph_90err_low Ph_90err_hi Epeak Epeak_90err_low Epeak_90err_hi Norm Nomr_90err_low Norm_90err_hi chi2 dof
PL -1.514 -0.054 0.054 - - - 2.73e-03 -7.55e-05 7.55e-05 40.990 57
CPL -1.426 -0.119 0.218 347.027 -347.027 -347.027 3.00e-03 -3.33e-04 7.77e-04 40.490 56
=== 1-s peak spectral analysis ===
(Best model with acceptable fit: PL)
Model Ph_index Ph_90err_low Ph_90err_hi Epeak Epeak_90err_low Epeak_90err_hi Norm Nomr_90err_low Norm_90err_hi chi2 dof
PL -1.057 -0.151 0.153 - - - 2.19e-02 -1.81e-03 1.81e-03 42.540 57
CPL -1.003 -0.207 0.362 959.041 -959.041 -959.041 2.33e-02 -3.09e-03 9.07e-03 42.810 56
=== Fluence/Peak Flux Summary ===
Model Band1 Band2 Band3 Band4 Band5 Total
15-25 25-50 50-100 100-350 15-150 15-350 keV
Fluence PL 1.09e-06 1.98e-06 2.77e-06 8.12e-06 7.95e-06 1.40e-05 erg/cm2
90%_error_low -5.95e-08 -6.20e-08 -9.88e-08 -6.50e-07 -2.36e-07 -7.07e-07 erg/cm2
90%_error_hi 6.08e-08 6.18e-08 9.86e-08 6.90e-07 2.37e-07 7.39e-07 erg/cm2
Peak flux PL 5.90e-01 7.74e-01 7.43e-01 1.27e+00 2.53e+00 3.38e+00 ph/cm2/s
90%_error_low -9.73e-02 -7.84e-02 -7.14e-02 -2.50e-01 -2.13e-01 -3.12e-01 ph/cm2/s
90%_error_hi 1.03e-01 7.72e-02 7.05e-02 2.88e-01 2.13e-01 3.22e-01 ph/cm2/s
Fluence CPL 1.06e-06 1.99e-06 2.79e-06 7.13e-06 7.89e-06 1.30e-05 erg/cm2
90%_error_low -7.68e-08 -6.47e-08 -1.05e-07 -1.86e-06 -2.75e-07 -1.88e-06 erg/cm2
90%_error_hi 6.41e-08 6.78e-08 1.06e-07 1.15e-06 2.72e-07 1.22e-06 erg/cm2
Peak flux CPL 5.97e-01 7.74e-01 7.42e-01 1.34e+00 2.54e+00 3.37e+00 ph/cm2/s
90%_error_low N/A -7.87e-02 -6.98e-02 -5.19e-01 -2.22e-01 -4.80e-01 ph/cm2/s
90%_error_hi N/A 7.74e-02 7.56e-02 6.23e-02 2.04e-01 3.00e-01 ph/cm2/s
======================================================================
Image
Pre-slew 15.0-350.0 keV image (Event data)
#   RAcent    DECcent   POSerr    Theta     Phi              Peak Cts       SNR   Name
  170.7761    -3.5172   0.0061     4.6259   -31.7937         4.9931852     31.756 TRIG_00537195

Foreground time interval of the image:
-152.211  15.389 (delta_t = 167.600 [sec])
Background time interval of the image:
Light Curves
Note: The mask-weighted lightcurves have units of either count/det or counts/sec/det, where a det is 0.4 x 0.4 = 0.16 sq cm.
Full-time range; 1 s binning
Other quick-look light curves:
- 64 ms binning (zoomed)
- 16 ms binning (zoomed)
- 8 ms binning (zoomed)
- 2 ms binning (zoomed)
- SN=5 or 10 s binning (full-time range)
- Raw light curve
Spectra
- 64 ms binning (zoomed)
- 16 ms binning (zoomed)
- 8 ms binning (zoomed)
- 2 ms binning (zoomed)
- SN=5 or 10 s binning (full-time range)
- Raw light curve
Spectra
Notes:
- 1) The fitting includes the systematic errors.
- 2) When the burst includes telescope slew time periods, the fitting uses an average response file made from multiple 5-s response files through out the slew time plus single time preiod for the non-slew times, and weighted by the total counts in the corresponding time period using addrmf. An average response file is needed becuase a spectral fit using the pre-slew DRM will introduce some errors in both a spectral shape and a normalization if the PHA file contains a lot of the slew/post-slew time interval.
- 3) For fits to more complicated models (e.g. a power-law over a cutoff power-law), the BAT team has decided to require a chi-square improvement of more than 6 for each extra dof.
Time averaged spectrum fit using the average DRM
Power-law model

Time interval is from -209.004 sec. to   98.308 sec.

Spectral model in power-law:
------------------------------------------------------------
Parameters  : value       lower 90%   higher 90%
Photon index: -1.51396     ( -0.054271   0.05421 )
Norm@50keV  : 2.73177E-03    ( -7.55408e-05   7.55037e-05 )
------------------------------------------------------------
#Fit statistic : Chi-Squared =          40.99 using 59 PHA bins.
# Reduced chi-squared =         0.7192 for     57 degrees of freedom
# Null hypothesis probability =   9.456494e-01

Photon flux (15-150 keV)    in 307.3 sec: 0.342336 ( -0.010269  0.0103 ) ph/cm2/s
Energy fluence (15-150 keV)             : 7.94681e-06 ( -2.36131e-07  2.36757e-07 ) ergs/cm2
Cutoff power-law model
Time interval is from -209.004 sec. to   98.308 sec.
Spectral model in the cutoff power-law:
------------------------------------------------------------
Parameters  : value       lower 90%   higher 90%
Photon index: -1.42644     ( -0.119048   0.217727 )
Epeak [keV] : 347.027      ( -347.965 -347.965 )
Norm@50keV  : 3.00412E-03    ( -0.000331884   0.000777682 )
------------------------------------------------------------
#Fit statistic : Chi-Squared =          40.49 using 59 PHA bins.
# Reduced chi-squared =         0.7231 for     56 degrees of freedom
# Null hypothesis probability =   9.409896e-01

Photon flux (15-150 keV)    in 307.3 sec: 0.340021 ( -0.011587  0.011566 ) ph/cm2/s
Energy fluence (15-150 keV)             : 7.88811e-06 ( -2.74646e-07  2.71555e-07 ) ergs/cm2
1-s peak spectrum fit
Power-law model

Time interval is from -190.720 sec. to -189.720 sec.

Spectral model in power-law:
------------------------------------------------------------
Parameters  : value       lower 90%   higher 90%
Photon index: -1.05748     ( -0.150812   0.152917 )
Norm@50keV  : 2.18813E-02    ( -0.00181142   0.00181036 )
------------------------------------------------------------
#Fit statistic : Chi-Squared =          42.54 using 59 PHA bins.
# Reduced chi-squared =         0.7463 for     57 degrees of freedom
# Null hypothesis probability =   9.230118e-01

Photon flux (15-150 keV)    in 1 sec: 2.52866 ( -0.21275  0.2131 ) ph/cm2/s
Energy fluence (15-150 keV)             : 2.32001e-07 ( -2.18459e-08  2.20144e-08 ) ergs/cm2
Cutoff power-law model
Time interval is from -190.720 sec. to -189.720 sec.
Spectral model in the cutoff power-law:
------------------------------------------------------------
Parameters  : value       lower 90%   higher 90%
Photon index: -1.05224     ( -0.207665   0.361341 )
Epeak [keV] : 9999.33      ( -9999.34 -9999.34 )
Norm@50keV  : 2.20044E-02    ( -0.00181827   0.0103387 )
------------------------------------------------------------
#Fit statistic : Chi-Squared =          42.56 using 59 PHA bins.
# Reduced chi-squared =         0.7600 for     56 degrees of freedom
# Null hypothesis probability =   9.072788e-01

Photon flux (15-150 keV)    in 1 sec: 2.53747 ( -0.22221  0.20362 ) ph/cm2/s
Energy fluence (15-150 keV)             : 2.32697e-07 ( -2.63776e-08  1.47203e-08 ) ergs/cm2
Time-resolved spectra
Distribution
T90 vs. Hardness ratio plot
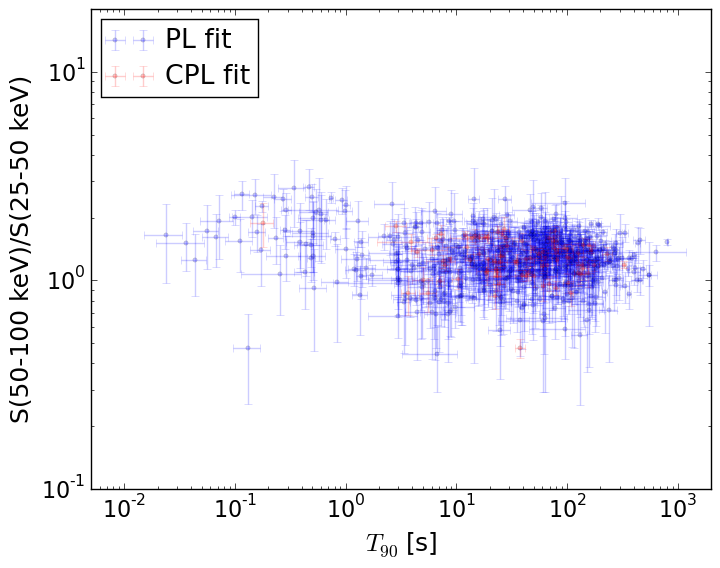
T90                                   = N/A sec.
Hardness ratio (energy fluence ratio) = N/A
S(15-50 keV) vs. S(50-150 keV) plot
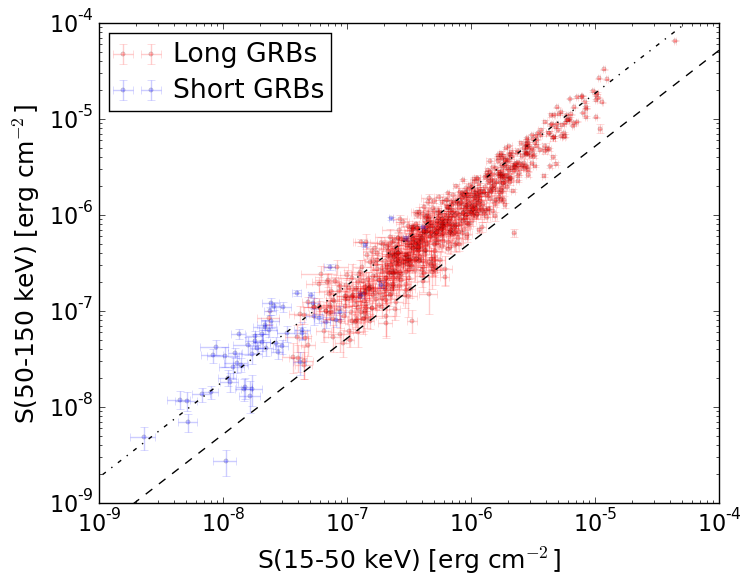
S(15-50 keV)  = N/A
S(50-150 keV) = N/A
The dash-dotted line and the dashed line traces the fluences calculated from the Band function with Epeak = 15 and 150 keV, respectively. Both lines assume a canonical values of alpha = -1 and beta = -2.5.
Mask shadow pattern
IMX = 6.877185746185352E-02, IMY = 4.262995032197137E-02
Spacecraft aspect plot
Bright source in the pre-burst/pre-slew/post-slew images
Pre-burst image of 15-350 keV band
Time interval of the image:
Pre-slew background subtracted image of 15-350 keV band
Time interval of the image:
-152.211400 15.388600

# RAcent  DECcent POSerr Theta    Phi  PeakCts   SNR AngSep     Name
#  [deg]    [deg]    ['] [deg]  [deg]                   [']
135.5379 -40.4936    4.2  52.5    3.1   1.3168   2.7    3.7	Vela X-1
204.5152  47.6410    2.3  55.0  176.8   3.8321   5.1 ------	UNKNOWN
170.7761  -3.5172    0.4   4.6  -31.8   4.9920  31.7 ------	UNKNOWN
155.9854 -40.7135    2.6  43.9  -14.4   1.0894   4.4 ------	UNKNOWN
204.0446  13.2795    2.8  35.2 -142.2   0.9182   4.1 ------	UNKNOWN
Post-slew image of 15-350 keV band
Time interval of the image:
48.588590 139.208000
140.488000 962.629900

# RAcent  DECcent POSerr Theta    Phi  PeakCts   SNR AngSep     Name
#  [deg]    [deg]    ['] [deg]  [deg]                   [']
135.5564 -40.4534    7.3  48.7   19.2   2.1142   1.6    6.2	Vela X-1
170.3344 -60.6319    4.2  57.1  -16.3   6.1096   2.8    0.8	Cen X-3
188.6840  42.9630    2.6  49.2 -179.2   4.9591   4.5 ------	UNKNOWN
194.7679  40.4368    3.1  49.2 -172.4   4.3928   3.8 ------	UNKNOWN
185.1682  -9.7991    2.9  15.6  -82.2   1.9960   4.0 ------	UNKNOWN
213.5446  40.2877    5.2  58.7 -159.2  10.1938   2.2 ------	UNKNOWN
211.9942  -7.7374    5.2  41.2  -98.8   7.6803   2.2 ------	UNKNOWN