Analysis Summary
Notes:
- 1) No attempt has been made to eliminate the non-significant decimal places.
- 2) This batgrbproduct analysis is done using the HEASARC data.
- 3) This batgrbproduct analysis is using the flight position for the mask-weighting calculation.
======================================================================
BAT GRB EVENT DATA PROCESSING REPORT
Process Script Ver: batgrbproduct v2.46
Process Start Time: Sun Jan 12 23:35:44 EST 2014
Host Name: batevent1
Current Working Dir: /local/data/batevent/batevent_reproc/trigger537266
======================================================================
Trigger: 00537266 Segment: 000
BAT Trigger Time: 373516032.512 [s; MET]
Trigger Stop: 373516033.536 [s; MET]
UTC: 2012-11-02T02:27:02.685320 [includes UTCF correction]
Where From?: TDRSS position message
BAT
RA: 270.902873735498 Dec: -16.9658028054735 [deg; J2000]
Catalogged Source?: NO
Point Source?: YES
GRB Indicated?: YES [ by BAT flight software ]
Image S/N Ratio: 7.37
Image Trigger?: NO
Rate S/N Ratio: 14.8996644257513 [ if not an image trigger ]
Image S/N Ratio: 7.37
Analysis Position: [ source = BAT ]
RA: 270.902873735498 Dec: -16.9658028054735 [deg; J2000]
Refined Position: [ source = BAT pre-slew burst ]
RA: 270.894556895852 Dec: -16.9507653700447 [deg; J2000]
{ 18h 03m 34.7s , -16d 57' 02.8" }
+/- 0.691127037731532 [arcmin] (estimated 90% radius based on SNR)
+/- 0.216766577275625 [arcmin] (formal 1-sigma fit error)
SNR: 51.5610085443632
Angular difference between the analysis and refined position is 1.020723 arcmin
Partial Coding Fraction: 1.03125 [ including projection effects ]
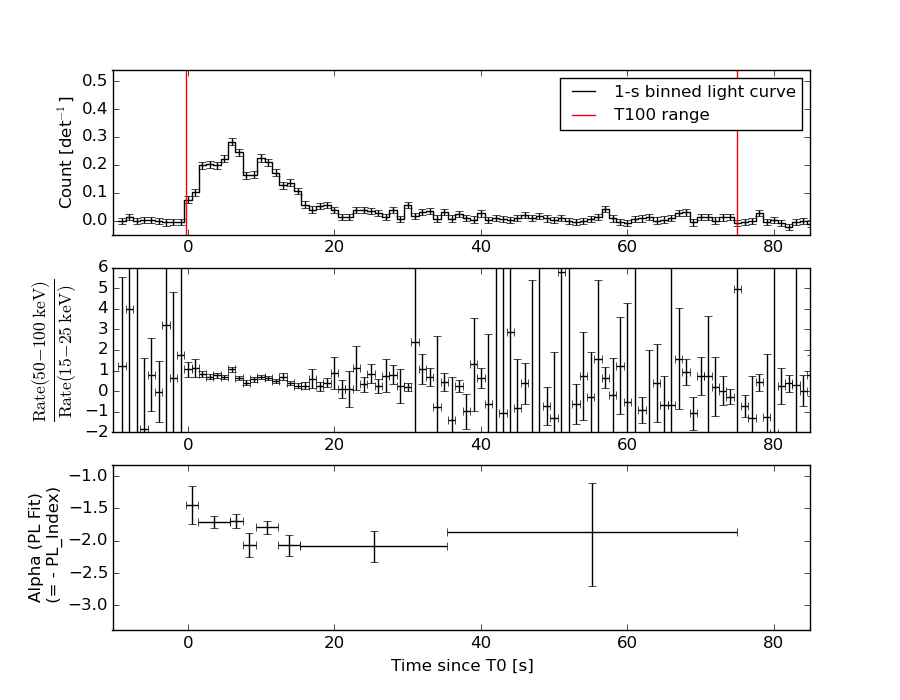
Duration
T90: 54.6799999475479 +/- 13.9357388511512
Measured from: 1.62000000476837
to: 56.2999999523163 [s; relative to TRIGTIME]
T50: 11.6799999475479 +/- 1.93469791194361
Measured from: 5.34799998998642
to: 17.0279999375343 [s; relative to TRIGTIME]
Fluence
Peak Flux (peak 1 second)
Measured from: 5.67599999904633
to: 6.67599999904633 [s; relative to TRIGTIME]
Total Fluence
Measured from: -0.296000003814697
to: 74.9159999489784 [s; relative to TRIGTIME]
Band 1 Band 2 Band 3 Band 4
15-25 25-50 50-100 100-350 keV
Total 1.386494 1.487785 0.853959 0.107818
0.058544 0.054182 0.045082 0.038410 [error]
Peak 0.079805 0.121633 0.078472 0.013430
0.007527 0.007560 0.006222 0.004586 [error]
[ fluence units of on-axis counts / fully illuminated detector ]
======================================================================
====== Table of the duration information =============================
Value tstart tstop
T100 75.212 -0.296 74.916
T90 54.680 1.620 56.300
T50 11.680 5.348 17.028
Peak 1.000 5.676 6.676
====== Spectral Analysis Summary =====================================
Model : spectral model: simple power-law (PL) and cutoff power-law (CPL)
Ph_index : photon index: E^{Ph_index}
Ph_90err : 90% error of the photon index
Epeak : Epeak in keV
Epeak_90err: 90% error of Epeak
Norm : normalization at 50 keV in both the PL model and CPL model
Nomr_90err : 90% error of the normalization
chi2 : Chi-Squared
dof : degree of freedo
=== Time-averaged spectral analysis ===
(Best model with acceptable fit: PL)
Model Ph_index Ph_90err_low Ph_90err_hi Epeak Epeak_90err_low Epeak_90err_hi Norm Nomr_90err_low Norm_90err_hi chi2 dof
PL -1.857 -0.090 0.089 - - - 2.96e-03 -1.47e-04 1.46e-04 39.500 57
CPL -1.732 -0.325 0.347 99.638 -43.842 -99.638 3.45e-03 -9.51e-04 1.75e-03 39.070 56
=== 1-s peak spectral analysis ===
(Best model with acceptable fit: CPL)
Model Ph_index Ph_90err_low Ph_90err_hi Epeak Epeak_90err_low Epeak_90err_hi Norm Nomr_90err_low Norm_90err_hi chi2 dof
PL -1.593 -0.123 0.122 - - - 1.82e-02 -1.39e-03 1.38e-03 67.180 57
CPL -0.807 -0.505 0.569 72.291 -13.944 45.106 4.72e-02 -2.12e-02 4.57e-02 59.670 56
=== Fluence/Peak Flux Summary ===
Model Band1 Band2 Band3 Band4 Band5 Total
15-25 25-50 50-100 100-350 15-150 15-350 keV
Fluence PL 3.99e-07 5.89e-07 6.51e-07 1.35e-06 2.05e-06 2.99e-06 erg/cm2
90%_error_low -3.05e-08 -2.70e-08 -4.46e-08 -1.89e-07 -1.02e-07 -2.27e-07 erg/cm2
90%_error_hi 3.13e-08 2.69e-08 4.48e-08 2.10e-07 1.02e-07 2.43e-07 erg/cm2
Peak flux PL 8.20e-01 7.81e-01 5.18e-01 5.34e-01 2.34e+00 2.65e+00 ph/cm2/s
90%_error_low -9.60e-02 -5.94e-02 -4.95e-02 -9.51e-02 -1.73e-01 -1.95e-01 ph/cm2/s
90%_error_hi 9.90e-02 5.92e-02 4.94e-02 1.07e-01 1.73e-01 1.95e-01 ph/cm2/s
Fluence CPL 3.91e-07 5.96e-07 6.51e-07 1.09e-06 2.02e-06 2.73e-06 erg/cm2
90%_error_low -3.62e-08 -3.15e-08 -4.55e-08 -4.50e-07 -1.22e-07 -4.72e-07 erg/cm2
90%_error_hi 3.37e-08 3.25e-08 4.58e-08 3.13e-07 1.20e-07 4.95e-07 erg/cm2
Peak flux CPL 7.27e-01 8.46e-01 5.42e-01 2.29e-01 2.27e+00 2.34e+00 ph/cm2/s
90%_error_low -1.12e-01 -7.34e-02 -5.59e-02 -9.40e-02 -1.78e-01 -2.05e-01 ph/cm2/s
90%_error_hi 1.14e-01 7.53e-02 5.64e-02 1.58e-01 1.78e-01 2.26e-01 ph/cm2/s
======================================================================
Image
Pre-slew 15.0-350.0 keV image (Event data)
#   RAcent    DECcent   POSerr    Theta     Phi              Peak Cts       SNR   Name
  270.8946   -16.9508   0.0037     5.9926  -132.1383         2.4889201     51.561 TRIG_00537266

Foreground time interval of the image:
 -0.296  12.389 (delta_t =  12.685 [sec])
Background time interval of the image:
-239.512  -0.296 (delta_t = 239.216 [sec])
Light Curves
Note: The mask-weighted lightcurves have units of either count/det or counts/sec/det, where a det is 0.4 x 0.4 = 0.16 sq cm.
Full-time range; 1 s binning
Other quick-look light curves:
- 64 ms binning (zoomed)
- 16 ms binning (zoomed)
- 8 ms binning (zoomed)
- 2 ms binning (zoomed)
- SN=5 or 10 s binning (full-time range)
- Raw light curve
Spectra
- 64 ms binning (zoomed)
- 16 ms binning (zoomed)
- 8 ms binning (zoomed)
- 2 ms binning (zoomed)
- SN=5 or 10 s binning (full-time range)
- Raw light curve
Spectra
Notes:
- 1) The fitting includes the systematic errors.
- 2) When the burst includes telescope slew time periods, the fitting uses an average response file made from multiple 5-s response files through out the slew time plus single time preiod for the non-slew times, and weighted by the total counts in the corresponding time period using addrmf. An average response file is needed becuase a spectral fit using the pre-slew DRM will introduce some errors in both a spectral shape and a normalization if the PHA file contains a lot of the slew/post-slew time interval.
- 3) For fits to more complicated models (e.g. a power-law over a cutoff power-law), the BAT team has decided to require a chi-square improvement of more than 6 for each extra dof.
Time averaged spectrum fit using the average DRM
Power-law model
Time interval is from   -0.296 sec. to   74.916 sec.

Spectral model in power-law:
------------------------------------------------------------
Parameters  : value       lower 90%   higher 90%
Photon index: -1.85725     ( -0.0897459   0.088714 )
Norm@50keV  : 2.96413E-03    ( -0.000146897   0.000145865 )
------------------------------------------------------------
#Fit statistic : Chi-Squared =          39.50 using 59 PHA bins.
# Reduced chi-squared =         0.6929 for     57 degrees of freedom
# Null hypothesis probability =   9.625732e-01

Photon flux (15-150 keV)    in 75.21 sec: 0.417897 ( -0.019778  0.019831 ) ph/cm2/s
Energy fluence (15-150 keV)             : 2.04996e-06 ( -1.01662e-07  1.02303e-07 ) ergs/cm2
Cutoff power-law model
Time interval is from   -0.296 sec. to   74.916 sec.
Spectral model in the cutoff power-law:
------------------------------------------------------------
Parameters  : value       lower 90%   higher 90%
Photon index: -1.73155     ( -0.324519   0.347014 )
Epeak [keV] : 99.6375      ( -43.8425 -99.6376 )
Norm@50keV  : 3.45182E-03    ( -0.000950651   0.00175488 )
------------------------------------------------------------
#Fit statistic : Chi-Squared =          39.07 using 59 PHA bins.
# Reduced chi-squared =         0.6976 for     56 degrees of freedom
# Null hypothesis probability =   9.584483e-01

Photon flux (15-150 keV)    in 75.21 sec: 0.414328 ( -0.021731  0.02173 ) ph/cm2/s
Energy fluence (15-150 keV)             : 2.02309e-06 ( -1.22337e-07  1.20322e-07 ) ergs/cm2
1-s peak spectrum fit
Power-law model
Time interval is from    5.676 sec. to    6.676 sec.

Spectral model in power-law:
------------------------------------------------------------
Parameters  : value       lower 90%   higher 90%
Photon index: -1.59253     ( -0.122947   0.121649 )
Norm@50keV  : 1.82213E-02    ( -0.00138898   0.00138178 )
------------------------------------------------------------
#Fit statistic : Chi-Squared =          67.18 using 59 PHA bins.
# Reduced chi-squared =          1.179 for     57 degrees of freedom
# Null hypothesis probability =   1.676477e-01

Photon flux (15-150 keV)    in 1 sec: 2.33621 ( -0.17273  0.17289 ) ph/cm2/s
Energy fluence (15-150 keV)             : 1.70589e-07 ( -1.38959e-08  1.40103e-08 ) ergs/cm2
Cutoff power-law model
Time interval is from    5.676 sec. to    6.676 sec.
Spectral model in the cutoff power-law:
------------------------------------------------------------
Parameters  : value       lower 90%   higher 90%
Photon index: -0.806594     ( -0.504609   0.569115 )
Epeak [keV] : 72.2910      ( -13.9444 45.1056 )
Norm@50keV  : 4.72223E-02    ( -0.021187   0.0456934 )
------------------------------------------------------------
#Fit statistic : Chi-Squared =          59.67 using 59 PHA bins.
# Reduced chi-squared =          1.065 for     56 degrees of freedom
# Null hypothesis probability =   3.439063e-01

Photon flux (15-150 keV)    in 1 sec: 2.26770 ( -0.17802  0.17811 ) ph/cm2/s
Energy fluence (15-150 keV)             : 1.60465e-07 ( -1.51501e-08  1.53476e-08 ) ergs/cm2
Time-resolved spectra
Distribution
T90 vs. Hardness ratio plot
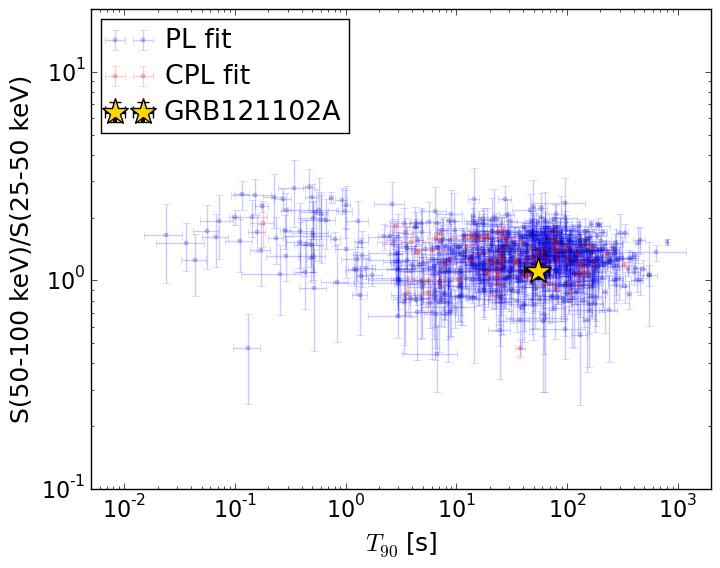
T90                                   = 54.68 sec.
Hardness ratio (energy fluence ratio) = 1.10402765193
S(15-50 keV) vs. S(50-150 keV) plot
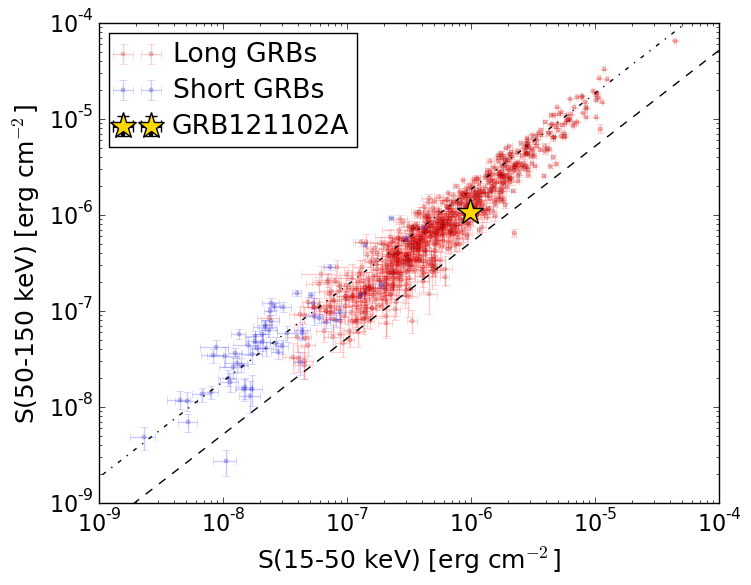
S(15-50 keV)  = 9.878327e-07
S(50-150 keV) = 1.0621471e-06
The dash-dotted line and the dashed line traces the fluences calculated from the Band function with Epeak = 15 and 150 keV, respectively. Both lines assume a canonical values of alpha = -1 and beta = -2.5.
Mask shadow pattern
IMX = -7.042880928023336E-02, IMY = 7.784037113046700E-02
Spacecraft aspect plot
Bright source in the pre-burst/pre-slew/post-slew images
Pre-burst image of 15-350 keV band
Time interval of the image:
-239.512000 -0.296000

# RAcent  DECcent POSerr Theta    Phi  PeakCts   SNR AngSep     Name
#  [deg]    [deg]    ['] [deg]  [deg]                   [']
244.9781 -15.6410    0.4  29.5  -95.5   9.0184  26.7    0.1	Sco X-1
254.4110  35.3427    2.2  51.9  -17.7   3.0450   5.3    2.3	Her X-1
255.9857 -37.8606    1.3  30.5 -145.2   2.4247   8.6    1.0	4U 1700-377
256.4587 -36.4153    3.2  29.1 -143.9   0.9758   3.6    1.2	GX 349+2
262.8457 -24.6838    4.8  16.8 -133.5   0.5426   2.4    9.6	GX 1+4
264.7134 -44.5469    9.5  33.1 -162.3   0.2997   1.2    5.9	4U 1735-44
268.4503  -1.5078    4.1  13.0  -27.6   0.6138   2.8    5.9	SW J1753.5-0127
270.3074 -25.0696    2.5  13.2 -156.2   1.0118   4.6    1.4	GX 5-1
270.2278 -25.8917    3.4  14.0 -157.1   0.7353   3.4    9.8	GRS 1758-258
274.0369 -14.0210    1.7   1.8 -135.4   1.6236   6.9    2.0	GX 17+2
275.9925 -30.2647    6.3  17.6 -178.2   0.4145   1.8    7.1	H1820-303
285.1875 -24.8326   18.3  15.4  147.7  -0.1468  -0.6    9.8	HT1900.1-2455
288.8122  10.9259    2.3  27.2   34.3   1.5084   5.0    1.4	GRS 1915+105
262.9491 -33.8455    3.8  23.9 -150.2   0.7432   3.0    2.1	GX 354-0
266.2890 -26.3989    1.1  16.1 -145.9   2.3002  10.6 ------	UNKNOWN
237.9520 -65.9138    3.6  58.9 -159.2   4.8080   3.3 ------	UNKNOWN
232.5974 -41.9571    3.0  47.1 -132.6   3.1492   3.9 ------	UNKNOWN
235.7440  13.6504    2.2  47.2  -53.5   5.1278   5.1 ------	UNKNOWN
Pre-slew background subtracted image of 15-350 keV band
Time interval of the image:
-0.296000 12.388600

# RAcent  DECcent POSerr Theta    Phi  PeakCts   SNR AngSep     Name
#  [deg]    [deg]    ['] [deg]  [deg]                   [']
244.9344 -15.7680    7.9  29.5  -95.7  -0.1108  -1.5    8.1	Sco X-1
254.4686  35.3407    4.0  51.9  -17.6  -0.3600  -2.9    0.5	Her X-1
255.8137 -37.8534   22.5  30.6 -144.9   0.0312   0.5    8.2	4U 1700-377
256.4970 -36.2846   18.3  29.0 -143.8   0.0375   0.6    8.8	GX 349+2
262.9890 -24.8920    5.9  16.8 -134.4   0.0978   1.9    8.9	GX 1+4
264.9005 -44.4671  105.9  33.0 -162.4   0.0066   0.1    6.8	4U 1735-44
268.3336  -1.3054    6.3  13.3  -27.6  -0.0869  -1.8    9.1	SW J1753.5-0127
270.3926 -25.1380    5.0  13.3 -156.6   0.1107   2.4    6.9	GX 5-1
270.1399 -25.5980    5.4  13.8 -156.4  -0.1034  -2.2   12.4	GRS 1758-258
274.1516 -13.9003    6.9   1.6 -135.6  -0.0779  -1.7   11.8	GX 17+2
276.0427 -30.2644    4.8  17.6 -178.3  -0.1201  -2.4    8.7	H1820-303
285.1044 -24.8998   11.4  15.4  148.1   0.0508   1.0    3.9	HT1900.1-2455
288.7631  11.0899    4.6  27.3   34.0   0.1654   2.5    8.9	GRS 1915+105
263.0129 -33.7053    5.1  23.8 -150.2   0.1193   2.3    7.9	GX 354-0
270.8946 -16.9508    0.2   6.0 -132.1   2.4889  51.6 ------	UNKNOWN
Post-slew image of 15-350 keV band
Time interval of the image:
36.388600 962.620400

# RAcent  DECcent POSerr Theta    Phi  PeakCts   SNR AngSep     Name
#  [deg]    [deg]    ['] [deg]  [deg]                   [']
244.9767 -15.6347    0.3  24.9  -84.9  30.8382  35.9    0.4	Sco X-1
254.3549  35.1721   11.7  54.4  -10.8  -1.9716  -1.0   11.4	Her X-1
255.9949 -37.8425    0.6  24.7 -145.0  13.5458  20.0    0.4	4U 1700-377
256.3677 -36.3814    4.9  23.3 -143.5   1.6031   2.4    4.1	GX 349+2
263.1630 -24.5952    4.6  10.5 -132.1   1.8439   2.5   12.3	GX 1+4
264.8783 -44.3322    4.7  27.8 -164.9   1.6251   2.5    9.1	4U 1735-44
268.3466  -1.4472    2.3  15.7   -3.7   3.1528   5.0    1.3	SW J1753.5-0127
270.2760 -25.0985    1.2   8.2 -170.2   6.2128   9.7    1.2	GX 5-1
270.3110 -25.6806    4.0   8.7 -170.7   2.0625   3.1    3.8	GRS 1758-258
273.9217 -14.0738    2.3   4.1   51.5   3.6197   5.1    5.4	GX 17+2
276.0933 -30.3546    4.6  14.2  167.3   1.6367   2.5    8.7	H1820-303
284.8832 -24.9870    8.0  15.3  129.8   1.0088   1.4    9.2	HT1900.1-2455
288.8390  11.0251    4.4  33.1   39.4   2.4609   2.6    5.3	GRS 1915+105
262.8669 -33.8590    6.7  18.4 -152.6   1.2150   1.7    6.3	GX 354-0
296.1592  19.7768    3.8  44.3   40.9   6.8433   3.0 ------	UNKNOWN
309.5573 -55.8646    3.3  48.7  158.0   7.2562   3.5 ------	UNKNOWN
270.5073 -20.4600    2.3   3.5 -168.1   3.0569   5.0 ------	UNKNOWN
266.2761 -26.4204    0.8  10.4 -150.6   9.7734  14.9 ------	UNKNOWN
256.7148 -66.6073    3.7  50.5 -167.0   5.1730   3.1 ------	UNKNOWN
229.9709 -70.2129    4.2  58.7 -159.2  12.9879   2.8 ------	UNKNOWN