Analysis Summary
Notes:
- 1) No attempt has been made to eliminate the non-significant decimal places.
- 2) This batgrbproduct analysis is done using the HEASARC data.
- 3) This batgrbproduct analysis is using the flight position for the mask-weighting calculation.
======================================================================
                  BAT GRB EVENT DATA PROCESSING REPORT
    Process Script Ver: batgrbproduct v2.46
    Process Start Time: Sun Jan 12 23:23:22 EST 2014
             Host Name: batevent1
   Current Working Dir: /local/data/batevent/batevent_reproc/trigger539358
======================================================================

  Trigger: 00539358      Segment: 000

  BAT Trigger Time: 375357771.2   [s; MET]
      Trigger Stop: 375357779.392   [s; MET]
               UTC: 2012-11-23T10:02:41.294660    [includes UTCF correction]
       Where From?: TDRSS position message

  BAT
    RA: 307.361694621078   Dec: -11.8596197133855  [deg; J2000]

     Catalogged Source?: NO
     Point Source?:      YES
     GRB Indicated?:     YES    [ by BAT flight software ]
     Image S/N Ratio:    8.11
     Image Trigger?:     NO
     Rate S/N Ratio:     8.42614977317636  [ if not an image trigger ]
     Image S/N Ratio:    8.11

  Analysis Position:   [ source = BAT ]
    RA: 307.361694621078   Dec: -11.8596197133855  [deg; J2000]

  Refined Position:   [ source = BAT pre-slew burst ]
    RA: 307.323808221708   Dec: -11.8793652854419  [deg; J2000]
        { 20h 29m 17.7s , -11d 52' 45.7" }
         +/- 1.86146283966942 [arcmin] (estimated 90% radius based on SNR)
         +/- 0.710702862384076 [arcmin] (formal 1-sigma fit error)
    SNR: 12.5202250669747

  Angular difference between the analysis and refined position is 2.520387 arcmin

  Partial Coding Fraction: 0.8203125    [ including projection effects ]

  Duration
     T90: 326.091999948025 +/- 14.2908306292774
        Measured from: 42.6520000100136
                   to: 368.743999958038     [s; relative to TRIGTIME]
     T50: 61.9799998998642 +/- 2.93678736045599
        Measured from: 214.54800003767
                   to: 276.527999937534     [s; relative to TRIGTIME]


  Fluence
     Peak Flux  (peak 1 second)
        Measured from: 232.56400001049
                   to: 233.56400001049     [s; relative to TRIGTIME]
     Total Fluence
        Measured from: -6.24000000953674
                   to: 419.227999985218     [s; relative to TRIGTIME]

             Band 1     Band 2     Band 3     Band 4
              15-25      25-50     50-100    100-350     keV
 Total     6.675278   9.316128   5.839570   0.842123
           0.131380   0.134607   0.120349   0.111572 [error]
 Peak      0.059059   0.124286   0.104406   0.027590
           0.007220   0.008095   0.007528   0.005937 [error]

     [ fluence units of on-axis counts / fully illuminated detector ]

======================================================================


====== Table of the duration information =============================

        Value   tstart    tstop
T100  425.468   -6.240  419.228
T90   326.092   42.652  368.744
T50    61.980  214.548  276.528
Peak    1.000  232.564  233.564


====== Spectral Analysis Summary =====================================

Model      : spectral model: simple power-law (PL) and cutoff power-law (CPL)
Ph_index   : photon index: E^{Ph_index}
Ph_90err   : 90% error of the photon index
Epeak      : Epeak in keV
Epeak_90err: 90% error of Epeak
Norm       : normalization at 50 keV in both the PL model and CPL model
Nomr_90err : 90% error of the normalization
chi2       : Chi-Squared
dof        : degree of freedo

=== Time-averaged spectral analysis ===
(Best model with acceptable fit: CPL)

Model Ph_index Ph_90err_low Ph_90err_hi  Epeak  Epeak_90err_low  Epeak_90err_hi  Norm       Nomr_90err_low    Norm_90err_hi    chi2    dof
PL      -1.724    -0.042      0.042       -           -               -         3.37e-03     -7.55e-05          7.54e-05      91.470   57
CPL     -0.987    -0.195      0.204       69.867      -5.441         8.029      7.65e-03     -1.46e-03          1.90e-03      44.560   56


=== 1-s peak spectral analysis ===
(Best model with acceptable fit: PL)

Model Ph_index Ph_90err_low Ph_90err_hi  Epeak  Epeak_90err_low  Epeak_90err_hi  Norm       Nomr_90err_low    Norm_90err_hi    chi2    dof
PL      -1.198     -0.126     0.127       -           -               -         2.04e-02     -1.53e-03          1.53e-03      65.150   57
CPL     -0.633     -0.508     0.578      127.102     -40.147       507.407      3.84e-02     -1.63e-02          3.35e-02      61.510   56


=== Fluence/Peak Flux Summary ===

              Model    Band1     Band2     Band3     Band4     Band5     Total
                       15-25     25-50    50-100    100-350    15-150    15-350    keV
Fluence         PL   2.26e-06  3.62e-06  4.38e-06  1.04e-05  1.32e-05  2.06e-05   erg/cm2
      90%_error_low -9.42e-08 -8.80e-08 -1.28e-07 -6.61e-07 -3.06e-07 -7.44e-07   erg/cm2
      90%_error_hi   9.57e-08  8.78e-08  1.28e-07  6.91e-07  3.06e-07  7.67e-07   erg/cm2
Peak flux       PL   6.30e-01  7.59e-01  6.61e-01  9.88e-01  2.40e+00  3.04e+00   ph/cm2/s
      90%_error_low -8.47e-02 -6.46e-02 -5.86e-02 -1.71e-01 -1.81e-01 -2.43e-01   ph/cm2/s
      90%_error_hi   8.82e-02  6.40e-02  5.82e-02  1.92e-01  1.82e-01  2.47e-01   ph/cm2/s

Fluence        CPL   1.93e-06  3.79e-06  4.51e-06  4.17e-06  1.24e-05  1.44e-05   erg/cm2
      90%_error_low -1.20e-07 -1.00e-07 -1.41e-07 -7.73e-07 -3.64e-07 -8.59e-07   erg/cm2
      90%_error_hi   1.22e-07  1.01e-07  1.41e-07  9.84e-07  3.64e-07  1.05e-06   erg/cm2
Peak flux      CPL   5.62e-01  7.96e-01  6.99e-01  5.45e-01  2.35e+00  2.60e+00   ph/cm2/s
      90%_error_low -1.03e-01 -7.41e-02 -6.81e-02 -2.15e-01 -1.88e-01 -2.91e-01   ph/cm2/s
      90%_error_hi   1.06e-01  7.58e-02  6.95e-02  3.87e-01  1.88e-01  4.10e-01   ph/cm2/s

======================================================================
Image
Pre-slew 15.0-350.0 keV image (Event data)
#   RAcent    DECcent   POSerr    Theta     Phi              Peak Cts       SNR   Name
  307.3238   -11.8794   0.0153    28.1062   177.8328         1.4999290     12.520 TRIG_00539358

Foreground time interval of the image:
 -6.240  53.701 (delta_t =  59.941 [sec])
Background time interval of the image:
-179.200  -6.240 (delta_t = 172.960 [sec])
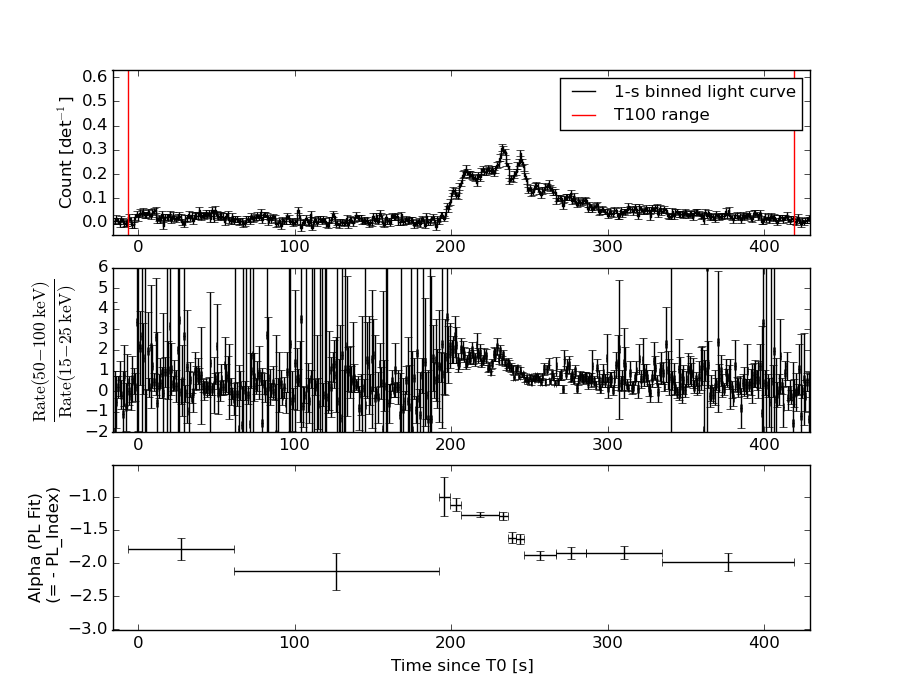
Light Curves
Note: The mask-weighted lightcurves have units of either count/det or counts/sec/det, where a det is 0.4 x 0.4 = 0.16 sq cm.
Full-time range; 1 s binning
Other quick-look light curves:
- 64 ms binning (zoomed)
- 16 ms binning (zoomed)
- 8 ms binning (zoomed)
- 2 ms binning (zoomed)
- SN=5 or 10 s binning (full-time range)
- Raw light curve
Spectra
- 64 ms binning (zoomed)
- 16 ms binning (zoomed)
- 8 ms binning (zoomed)
- 2 ms binning (zoomed)
- SN=5 or 10 s binning (full-time range)
- Raw light curve
Spectra
Notes:
- 1) The fitting includes the systematic errors.
- 2) When the burst includes telescope slew time periods, the fitting uses an average response file made from multiple 5-s response files through out the slew time plus single time preiod for the non-slew times, and weighted by the total counts in the corresponding time period using addrmf. An average response file is needed becuase a spectral fit using the pre-slew DRM will introduce some errors in both a spectral shape and a normalization if the PHA file contains a lot of the slew/post-slew time interval.
- 3) For fits to more complicated models (e.g. a power-law over a cutoff power-law), the BAT team has decided to require a chi-square improvement of more than 6 for each extra dof.
Time averaged spectrum fit using the average DRM
Power-law model
Time interval is from   -6.240 sec. to  419.228 sec.

Spectral model in power-law:
------------------------------------------------------------
Parameters  : value       lower 90%   higher 90%
Photon index: -1.72437     ( -0.0423149   0.0421709 )
Norm@50keV  : 3.36555E-03    ( -7.54679e-05   7.54049e-05 )
------------------------------------------------------------
#Fit statistic : Chi-Squared =          91.47 using 59 PHA bins.
# Reduced chi-squared =          1.605 for     57 degrees of freedom
# Null hypothesis probability =   2.549772e-03

Photon flux (15-150 keV)    in 425.5 sec: 0.450880 ( -0.011123  0.011157 ) ph/cm2/s
Energy fluence (15-150 keV)             : 1.32373e-05 ( -3.05785e-07  3.05841e-07 ) ergs/cm2
Cutoff power-law model
Time interval is from   -6.240 sec. to  419.228 sec.
Spectral model in the cutoff power-law:
------------------------------------------------------------
Parameters  : value       lower 90%   higher 90%
Photon index: -0.986759     ( -0.194705   0.203544 )
Epeak [keV] : 69.8665      ( -5.4407 8.02855 )
Norm@50keV  : 7.64936E-03    ( -0.00146089   0.00190443 )
------------------------------------------------------------
#Fit statistic : Chi-Squared =          44.56 using 59 PHA bins.
# Reduced chi-squared =         0.7958 for     56 degrees of freedom
# Null hypothesis probability =   8.643801e-01

Photon flux (15-150 keV)    in 425.5 sec: 0.424884 ( -0.012625  0.012691 ) ph/cm2/s
Energy fluence (15-150 keV)             : 1.24274e-05 ( -3.63693e-07  3.64373e-07 ) ergs/cm2
1-s peak spectrum fit
Power-law model
Time interval is from  232.564 sec. to  233.564 sec.

Spectral model in power-law:
------------------------------------------------------------
Parameters  : value       lower 90%   higher 90%
Photon index: -1.19829     ( -0.125874   0.126594 )
Norm@50keV  : 2.04276E-02    ( -0.00152671   0.00152624 )
------------------------------------------------------------
#Fit statistic : Chi-Squared =          65.15 using 59 PHA bins.
# Reduced chi-squared =          1.143 for     57 degrees of freedom
# Null hypothesis probability =   2.142985e-01

Photon flux (15-150 keV)    in 1 sec: 2.39722 ( -0.18146  0.18159 ) ph/cm2/s
Energy fluence (15-150 keV)             : 2.07367e-07 ( -1.74779e-08  1.76213e-08 ) ergs/cm2
Cutoff power-law model
Time interval is from  232.564 sec. to  233.564 sec.
Spectral model in the cutoff power-law:
------------------------------------------------------------
Parameters  : value       lower 90%   higher 90%
Photon index: -0.633416     ( -0.50809   0.578093 )
Epeak [keV] : 127.102      ( -40.1472 507.407 )
Norm@50keV  : 3.84260E-02    ( -0.0163487   0.0334527 )
------------------------------------------------------------
#Fit statistic : Chi-Squared =          61.51 using 59 PHA bins.
# Reduced chi-squared =          1.098 for     56 degrees of freedom
# Null hypothesis probability =   2.854719e-01

Photon flux (15-150 keV)    in 1 sec: 2.34520 ( -0.18804  0.18771 ) ph/cm2/s
Energy fluence (15-150 keV)             : 1.99444e-07 ( -1.92128e-08  1.9166e-08 ) ergs/cm2
Time-resolved spectra
Distribution
T90 vs. Hardness ratio plot
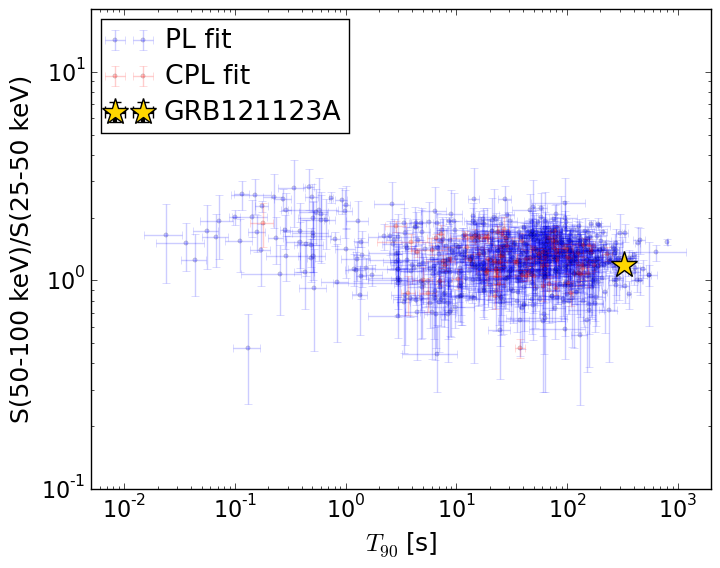
T90                                   = 326.092 sec.
Hardness ratio (energy fluence ratio) = 1.19074788204
S(15-50 keV) vs. S(50-150 keV) plot
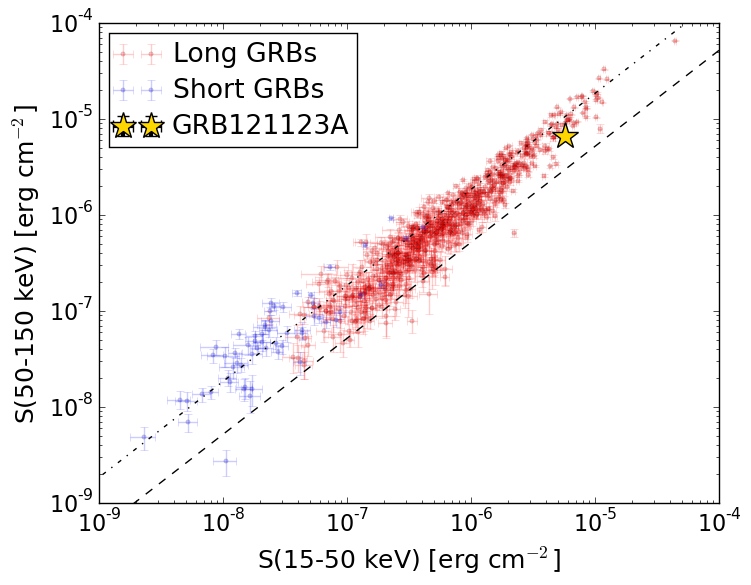
S(15-50 keV)  = 5.716761e-06
S(50-150 keV) = 6.710587e-06
The dash-dotted line and the dashed line traces the fluences calculated from the Band function with Epeak = 15 and 150 keV, respectively. Both lines assume a canonical values of alpha = -1 and beta = -2.5.
Mask shadow pattern
IMX = -5.337062704727726E-01, IMY = -2.019652793920537E-02
Spacecraft aspect plot
Bright source in the pre-burst/pre-slew/post-slew images
Pre-burst image of 15-350 keV band
Time interval of the image:
-179.200000 -6.240000

# RAcent  DECcent POSerr Theta    Phi  PeakCts   SNR AngSep     Name
#  [deg]    [deg]    ['] [deg]  [deg]                   [']
254.4187  35.4994    7.6  40.8    1.3  -0.4183  -1.5    9.6	Her X-1
263.1398 -24.6549   12.5  40.0 -101.3   0.7160   0.9    9.0	GX 1+4
268.3323  -1.5094    2.0  20.9  -72.0   1.2093   5.9    4.0	SW J1753.5-0127
270.2216 -25.0957    3.7  36.8 -110.3   1.1029   3.2    3.5	GX 5-1
270.3714 -25.8509    3.1  37.4 -111.1   1.3379   3.7    7.5	GRS 1758-258
273.9355 -13.9275    4.8  25.4 -105.2   0.4940   2.4    7.7	GX 17+2
275.7883 -30.4511   10.3  39.8 -121.0   0.4562   1.1    8.7	H1820-303
285.1089 -24.7924   29.0  32.6 -133.0  -0.0902  -0.4    8.6	HT1900.1-2455
288.8193  10.9012    1.8   3.5   71.6   1.2004   6.5    2.9	GRS 1915+105
299.7999  35.1594    5.3  29.7   64.8   0.6388   2.2   10.6	Cyg X-1
308.1983  41.0242    2.5  38.1   69.7   2.7478   4.7    5.9	Cyg X-3
334.9857 -15.9748    2.7  53.0  160.4   3.7753   4.3 ------	UNKNOWN
330.2602 -31.0988    3.2  56.7  179.2   3.8489   3.6 ------	UNKNOWN
312.1636 -24.4193    2.1  40.4 -172.8   1.3875   5.6 ------	UNKNOWN
Pre-slew background subtracted image of 15-350 keV band
Time interval of the image:
-6.240000 53.700640

# RAcent  DECcent POSerr Theta    Phi  PeakCts   SNR AngSep     Name
#  [deg]    [deg]    ['] [deg]  [deg]                   [']
254.4250  35.4129   55.2  40.7    1.2   0.0347   0.2    4.5	Her X-1
262.9354 -24.6505    7.8  40.1 -101.0   0.6350   1.5    7.0	GX 1+4
268.3442  -1.5048    5.3  20.9  -72.0  -0.2664  -2.2    3.4	SW J1753.5-0127
270.3139 -25.2137    7.2  36.8 -110.5   0.3473   1.6    8.2	GX 5-1
270.3123 -25.5996    4.1  37.2 -110.8   0.6498   3.0    8.6	GRS 1758-258
274.0356 -13.9002    8.4  25.3 -105.4  -0.1745  -1.4    8.4	GX 17+2
275.9918 -30.2277    4.3  39.5 -121.2   0.6039   2.7    9.0	H1820-303
285.2260 -24.9599    4.9  32.8 -133.2   0.3198   2.3   10.6	HT1900.1-2455
288.9227  11.0347   35.4   3.7   72.0  -0.0328  -0.3    9.1	GRS 1915+105
299.5535  35.0974   14.3  29.6   64.5   0.1341   0.8    6.5	Cyg X-1
308.2711  41.0354    5.4  38.2   69.7  -0.6964  -2.2    8.8	Cyg X-3
307.3238 -11.8793    0.9  28.1  177.8   1.4998  12.5 ------	UNKNOWN
286.3283 -37.2860    2.5  45.1 -135.5   1.2417   4.7 ------	UNKNOWN
Post-slew image of 15-350 keV band
Time interval of the image:
111.500600 467.291700
468.800000 662.880000
720.800000 782.890000
900.800000 962.884200

# RAcent  DECcent POSerr Theta    Phi  PeakCts   SNR AngSep     Name
#  [deg]    [deg]    ['] [deg]  [deg]                   [']
268.2191  -1.3845  311.4  40.2  -60.4  -0.0439  -0.0    9.8	SW J1753.5-0127
270.3528 -25.0830    3.3  37.4  -98.6   4.3940   3.5    3.7	GX 5-1
270.2423 -25.7676    3.3  37.6  -99.6   4.7491   3.5    3.6	GRS 1758-258
274.0696 -14.0631    2.2  32.5  -80.2   4.5178   5.3    4.0	GX 17+2
275.9499 -30.3870   33.8  34.5 -110.0   0.2801   0.3    1.8	H1820-303
285.2043 -24.9233    7.0  24.7 -107.6   0.9472   1.6    9.2	HT1900.1-2455
288.7596  10.9400    1.9  29.3  -22.3   3.2632   6.2    2.3	GRS 1915+105
299.7766  35.1077    5.5  47.5    9.0   2.3017   2.1   10.7	Cyg X-1
307.9913  40.9329    5.4  52.8   18.1   5.7200   2.1    5.5	Cyg X-3
307.3174 -11.8565    0.3   0.1 -100.5  22.9955  44.7 ------	UNKNOWN
331.9160 -66.5961    3.0  57.2 -173.9   9.8885   3.8 ------	UNKNOWN
275.0118  35.0206    3.6  56.0  -14.5   5.7086   3.2 ------	UNKNOWN
268.4098  29.0958    2.3  55.6  -24.3   8.1171   5.0 ------	UNKNOWN
267.4992  21.7498    2.6  51.6  -32.0   6.3311   4.5 ------	UNKNOWN