Analysis Summary
Notes:
- 1) No attempt has been made to eliminate the non-significant decimal places.
- 2) This batgrbproduct analysis is done using the HEASARC data.
- 3) This batgrbproduct analysis is using the flight position for the mask-weighting calculation.
======================================================================
                  BAT GRB EVENT DATA PROCESSING REPORT
    Process Script Ver: batgrbproduct v2.46
    Process Start Time: Sun Jan 12 23:18:04 EST 2014
             Host Name: batevent1
   Current Working Dir: /local/data/batevent/batevent_reproc/trigger539563
======================================================================

  Trigger: 00539563      Segment: 000

  BAT Trigger Time: 375525157.184   [s; MET]
      Trigger Stop: 375525157.696   [s; MET]
               UTC: 2012-11-25T08:32:27.271500    [includes UTCF correction]
       Where From?: TDRSS position message

  BAT
    RA: 228.520506554365   Dec: 55.3218658361602  [deg; J2000]

     Catalogged Source?: NO
     Point Source?:      YES
     GRB Indicated?:     YES    [ by BAT flight software ]
     Image S/N Ratio:    7.04
     Image Trigger?:     NO
     Rate S/N Ratio:     10.4880884817015  [ if not an image trigger ]
     Image S/N Ratio:    7.04

  Analysis Position:   [ source = BAT ]
    RA: 228.520506554365   Dec: 55.3218658361602  [deg; J2000]

  Refined Position:   [ source = BAT pre-slew burst ]
    RA: 228.528958553756   Dec: 55.3183571178776  [deg; J2000]
        { 15h 14m 07.0s , +55d 19' 06.1" }
         +/- 1.15028944977118 [arcmin] (estimated 90% radius based on SNR)
         +/- 0.41714150916382 [arcmin] (formal 1-sigma fit error)
    SNR: 24.9029640747749

  Angular difference between the analysis and refined position is 0.357182 arcmin

  Partial Coding Fraction: 0.8046875    [ including projection effects ]

  Duration
     T90: 52.2519999742508 +/- 5.0375203728785
        Measured from: 0.391999959945679
                   to: 52.6439999341965     [s; relative to TRIGTIME]
     T50: 24.6279999613762 +/- 1.30270487078746
        Measured from: 13.0239999890327
                   to: 37.6519999504089     [s; relative to TRIGTIME]


  Fluence
     Peak Flux  (peak 1 second)
        Measured from: 36.555999994278
                   to: 37.555999994278     [s; relative to TRIGTIME]
     Total Fluence
        Measured from: -6.85199999809265
                   to: 79.9639999866486     [s; relative to TRIGTIME]

             Band 1     Band 2     Band 3     Band 4
              15-25      25-50     50-100    100-350     keV
 Total     2.191378   2.725663   2.129134   0.447805
           0.059244   0.062497   0.056905   0.053036 [error]
 Peak      0.095050   0.114691   0.113336   0.035023
           0.007048   0.007842   0.007613   0.006213 [error]

     [ fluence units of on-axis counts / fully illuminated detector ]

======================================================================


====== Table of the duration information =============================

        Value   tstart    tstop
T100   86.816   -6.852   79.964
T90    52.252    0.392   52.644
T50    24.628   13.024   37.652
Peak    1.000   36.556   37.556


====== Spectral Analysis Summary =====================================

Model      : spectral model: simple power-law (PL) and cutoff power-law (CPL)
Ph_index   : photon index: E^{Ph_index}
Ph_90err   : 90% error of the photon index
Epeak      : Epeak in keV
Epeak_90err: 90% error of Epeak
Norm       : normalization at 50 keV in both the PL model and CPL model
Nomr_90err : 90% error of the normalization
chi2       : Chi-Squared
dof        : degree of freedo

=== Time-averaged spectral analysis ===
(Best model with acceptable fit: PL)

Model Ph_index Ph_90err_low Ph_90err_hi  Epeak  Epeak_90err_low  Epeak_90err_hi  Norm       Nomr_90err_low    Norm_90err_hi    chi2    dof
PL      -1.504    -0.057      0.057       -           -               -         5.59e-03     -1.59e-04          1.59e-04      48.330   57
CPL     -1.469    -0.087      0.188      822.820    -822.820      -822.820      5.80e-03     -3.55e-04          1.23e-03      48.390   56


=== 1-s peak spectral analysis ===
(Best model with acceptable fit: PL)

Model Ph_index Ph_90err_low Ph_90err_hi  Epeak  Epeak_90err_low  Epeak_90err_hi  Norm       Nomr_90err_low    Norm_90err_hi    chi2    dof
PL      -1.314     -0.129     0.129       -           -               -         2.24e-02     -1.55e-03          1.54e-03      60.520   57
CPL     -1.310     -0.130     0.225     9999.360    -9999.360      -9999.360      2.25e-02     -5.58e-03          7.00e-03      60.550   56


=== Fluence/Peak Flux Summary ===

              Model    Band1     Band2     Band3     Band4     Band5     Total
                       15-25     25-50    50-100    100-350    15-150    15-350    keV
Fluence         PL   6.22e-07  1.14e-06  1.61e-06  4.76e-06  4.60e-06  8.14e-06   erg/cm2
      90%_error_low -3.56e-08 -3.69e-08 -5.99e-08 -4.02e-07 -1.42e-07 -4.35e-07   erg/cm2
      90%_error_hi   3.64e-08  3.68e-08  5.97e-08  4.28e-07  1.43e-07  4.57e-07   erg/cm2
Peak flux       PL   7.72e-01  8.68e-01  6.98e-01  9.34e-01  2.68e+00  3.27e+00   ph/cm2/s
      90%_error_low -9.67e-02 -6.51e-02 -6.20e-02 -1.68e-01 -1.83e-01 -2.38e-01   ph/cm2/s
      90%_error_hi   1.01e-01  6.45e-02  6.14e-02  1.90e-01  1.83e-01  2.42e-01   ph/cm2/s

Fluence        CPL   6.22e-07  1.14e-06  1.61e-06  4.74e-06  4.60e-06  8.12e-06   erg/cm2
      90%_error_low -4.63e-08 -3.27e-08 -6.01e-08 -1.27e-06 -1.64e-07 -1.28e-06   erg/cm2
      90%_error_hi   2.66e-08  3.94e-08  6.36e-08  2.67e-07  1.41e-07  2.54e-07   erg/cm2
Peak flux      CPL   7.71e-01  8.67e-01  6.96e-01  1.00e+00  2.70e+00  3.28e+00   ph/cm2/s
      90%_error_low     N/A   -6.51e-02 -6.10e-02     N/A   -2.01e-01 -3.25e-01   ph/cm2/s
      90%_error_hi      N/A    6.61e-02  6.44e-02     N/A    1.65e-01  2.11e-01   ph/cm2/s

======================================================================
Image
Pre-slew 15.0-350.0 keV image (Event data)
#   RAcent    DECcent   POSerr    Theta     Phi              Peak Cts       SNR   Name
  228.5290    55.3184   0.0077    22.9670   -50.0531         1.6264078     24.903 TRIG_00539563

Foreground time interval of the image:
 -6.852  10.717 (delta_t =  17.569 [sec])
Background time interval of the image:
-265.283 -250.525 (delta_t =  14.759 [sec])
-239.184  -6.852 (delta_t = 232.332 [sec])
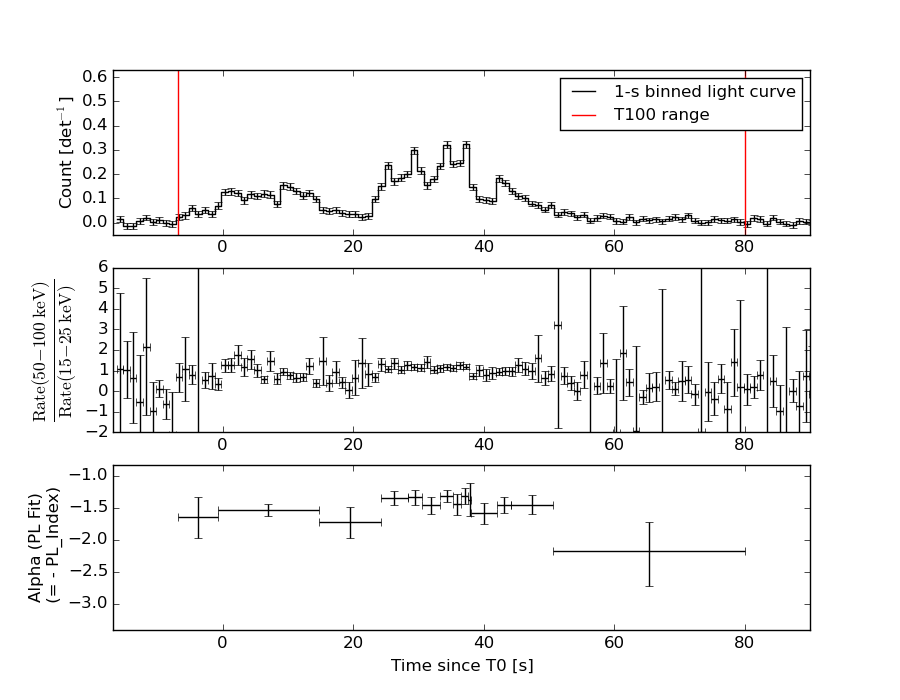
Light Curves
Note: The mask-weighted lightcurves have units of either count/det or counts/sec/det, where a det is 0.4 x 0.4 = 0.16 sq cm.
Full-time range; 1 s binning
Other quick-look light curves:
- 64 ms binning (zoomed)
- 16 ms binning (zoomed)
- 8 ms binning (zoomed)
- 2 ms binning (zoomed)
- SN=5 or 10 s binning (full-time range)
- Raw light curve
Spectra
- 64 ms binning (zoomed)
- 16 ms binning (zoomed)
- 8 ms binning (zoomed)
- 2 ms binning (zoomed)
- SN=5 or 10 s binning (full-time range)
- Raw light curve
Spectra
Notes:
- 1) The fitting includes the systematic errors.
- 2) When the burst includes telescope slew time periods, the fitting uses an average response file made from multiple 5-s response files through out the slew time plus single time preiod for the non-slew times, and weighted by the total counts in the corresponding time period using addrmf. An average response file is needed becuase a spectral fit using the pre-slew DRM will introduce some errors in both a spectral shape and a normalization if the PHA file contains a lot of the slew/post-slew time interval.
- 3) For fits to more complicated models (e.g. a power-law over a cutoff power-law), the BAT team has decided to require a chi-square improvement of more than 6 for each extra dof.
Time averaged spectrum fit using the average DRM
Power-law model
Time interval is from   -6.852 sec. to   79.964 sec.

Spectral model in power-law:
------------------------------------------------------------
Parameters  : value       lower 90%   higher 90%
Photon index: -1.50395     ( -0.0572506   0.0571706 )
Norm@50keV  : 5.59270E-03    ( -0.000159328   0.000159227 )
------------------------------------------------------------
#Fit statistic : Chi-Squared =          48.33 using 59 PHA bins.
# Reduced chi-squared =         0.8480 for     57 degrees of freedom
# Null hypothesis probability =   7.862816e-01

Photon flux (15-150 keV)    in 86.82 sec: 0.698951 ( -0.021535  0.021635 ) ph/cm2/s
Energy fluence (15-150 keV)             : 4.60384e-06 ( -1.42042e-07  1.42512e-07 ) ergs/cm2
Cutoff power-law model

Time interval is from   -6.852 sec. to   79.964 sec.
Spectral model in the cutoff power-law:
------------------------------------------------------------
Parameters  : value       lower 90%   higher 90%
Photon index: -1.50128     ( -0.0589156   0.216346 )
Epeak [keV] : 9998.67      ( -9998.66 -9998.66 )
Norm@50keV  : 5.60909E-03    ( -0.000159974   0.00142347 )
------------------------------------------------------------
#Fit statistic : Chi-Squared =          48.33 using 59 PHA bins.
# Reduced chi-squared =         0.8631 for     56 degrees of freedom
# Null hypothesis probability =   7.569991e-01

Photon flux (15-150 keV)    in 86.82 sec: 0.698882 ( -0.02463  0.021299 ) ph/cm2/s
Energy fluence (15-150 keV)             : 4.60278e-06 ( -1.63937e-07  1.41057e-07 ) ergs/cm2
1-s peak spectrum fit
Power-law model
Time interval is from   36.556 sec. to   37.556 sec.

Spectral model in power-law:
------------------------------------------------------------
Parameters  : value       lower 90%   higher 90%
Photon index: -1.31356     ( -0.129308   0.128593 )
Norm@50keV  : 2.24175E-02    ( -0.0015482   0.00154279 )
------------------------------------------------------------
#Fit statistic : Chi-Squared =          60.52 using 59 PHA bins.
# Reduced chi-squared =          1.062 for     57 degrees of freedom
# Null hypothesis probability =   3.499467e-01

Photon flux (15-150 keV)    in 1 sec: 2.68129 ( -0.18284  0.18302 ) ph/cm2/s
Energy fluence (15-150 keV)             : 2.20826e-07 ( -1.77821e-08  1.79716e-08 ) ergs/cm2
Cutoff power-law model

Time interval is from   36.556 sec. to   37.556 sec.
Spectral model in the cutoff power-law:
------------------------------------------------------------
Parameters  : value       lower 90%   higher 90%
Photon index: -1.30974     ( -0.130255   0.225402 )
Epeak [keV] : 9999.36      ( -9999.36 -9999.36 )
Norm@50keV  : 2.25086E-02    ( -0.00557999   0.00699578 )
------------------------------------------------------------
#Fit statistic : Chi-Squared =          60.55 using 59 PHA bins.
# Reduced chi-squared =          1.081 for     56 degrees of freedom
# Null hypothesis probability =   3.150511e-01

Photon flux (15-150 keV)    in 1 sec: 2.69864 ( -0.20074  0.16509 ) ph/cm2/s
Energy fluence (15-150 keV)             : 2.22116e-07 ( -1.91936e-08  1.65882e-08 ) ergs/cm2
Time-resolved spectra
Distribution
T90 vs. Hardness ratio plot
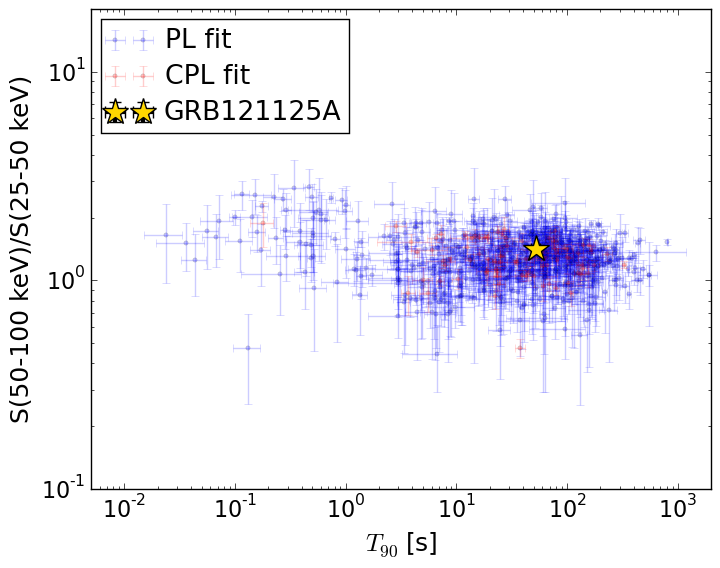
T90                                   = 52.252 sec.
Hardness ratio (energy fluence ratio) = 1.41039300529
S(15-50 keV) vs. S(50-150 keV) plot
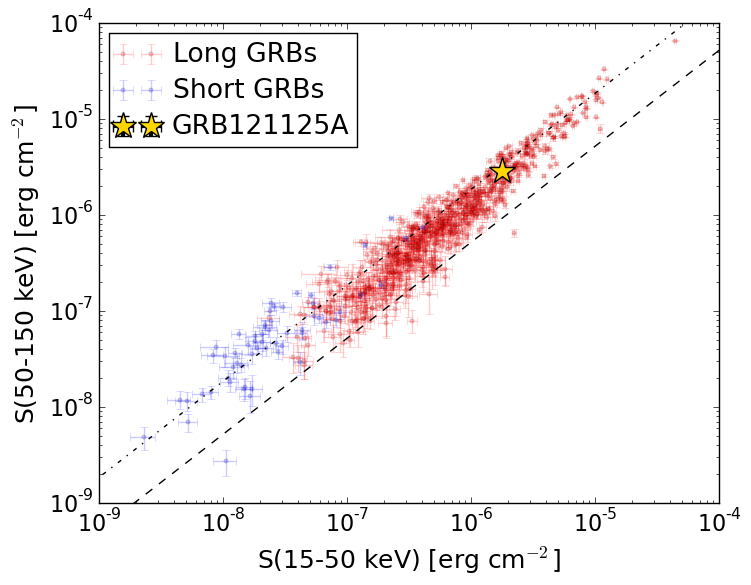
S(15-50 keV)  = 1.7630623e-06
S(50-150 keV) = 2.840787e-06
The dash-dotted line and the dashed line traces the fluences calculated from the Band function with Epeak = 15 and 150 keV, respectively. Both lines assume a canonical values of alpha = -1 and beta = -2.5.
Mask shadow pattern
IMX = 2.721098443244023E-01, IMY = 3.248983524118090E-01
Spacecraft aspect plot
Bright source in the pre-burst/pre-slew/post-slew images
Pre-burst image of 15-350 keV band
Time interval of the image:
-265.283400 -250.524600
-239.184000 -6.852000

# RAcent  DECcent POSerr Theta    Phi  PeakCts   SNR AngSep     Name
#  [deg]    [deg]    ['] [deg]  [deg]                   [']
254.3577  35.4718    6.1  35.4 -100.5   0.9621   1.9    9.2	Her X-1
299.6630  35.2264    5.0  38.5 -163.4   0.7384   2.3    3.9	Cyg X-1
308.1664  40.9669    2.0  35.2 -177.1   1.7043   5.8    2.7	Cyg X-3
326.1504  38.2272    6.0  43.3  164.6   0.9178   1.9    5.8	Cyg X-2
301.7294  14.7887    3.6  58.8 -159.1   4.8897   3.3 ------	UNKNOWN
289.2860  16.1550    4.4  55.2 -145.3   3.7771   2.6 ------	UNKNOWN
Pre-slew background subtracted image of 15-350 keV band
Time interval of the image:
-6.852000 10.716620

# RAcent  DECcent POSerr Theta    Phi  PeakCts   SNR AngSep     Name
#  [deg]    [deg]    ['] [deg]  [deg]                   [']
254.3243  35.3422    4.1  35.5 -100.5   0.3060   2.8    6.5	Her X-1
299.3521  35.2577   22.8  38.4 -163.0   0.0400   0.5   12.1	Cyg X-1
307.9435  40.9315    6.0  35.2 -176.8  -0.1357  -1.9    7.7	Cyg X-3
326.1039  38.2229   20.6  43.3  164.6   0.0624   0.6    6.7	Cyg X-2
335.2550  42.1814    2.3  42.8  152.9   0.6186   5.1 ------	UNKNOWN
228.5290  55.3184    0.5  23.0  -50.1   1.6262  24.9 ------	UNKNOWN
184.2642  39.0602    2.0  52.0  -20.5   0.7921   5.7 ------	UNKNOWN
293.9580  17.4747    2.5  54.7 -150.9   0.9980   4.7 ------	UNKNOWN
Post-slew image of 15-350 keV band
Time interval of the image:
55.516600 422.916630

# RAcent  DECcent POSerr Theta    Phi  PeakCts   SNR AngSep     Name
#  [deg]    [deg]    ['] [deg]  [deg]                   [']
254.5355  35.2875   61.2  26.8 -130.0  -0.0656  -0.2    5.0	Her X-1
299.6225  35.1479   24.6  51.4 -175.5   0.3325   0.5    3.6	Cyg X-1
307.9888  41.0136    4.5  51.8  173.3   2.2782   2.5    6.6	Cyg X-3
320.1975  72.0841    3.0  39.0  131.8   2.5220   3.8 ------	UNKNOWN
246.5705  46.0696    2.4  14.7 -135.8   1.3006   4.7 ------	UNKNOWN
183.5023  12.1576    4.3  55.5  -20.4   3.0020   2.7 ------	UNKNOWN
184.8294   7.5450    3.9  58.9  -24.4   6.6944   3.0 ------	UNKNOWN
285.9965  18.1193    2.6  56.9 -150.6   6.7404   4.5 ------	UNKNOWN