Analysis Summary
Notes:
- 1) No attempt has been made to eliminate the non-significant decimal places.
- 2) This batgrbproduct analysis is done using the HEASARC data.
- 3) This batgrbproduct analysis is using the flight position for the mask-weighting calculation.
======================================================================
                  BAT GRB EVENT DATA PROCESSING REPORT
    Process Script Ver: batgrbproduct v2.46
    Process Start Time: Sun Jan 12 23:13:52 EST 2014
             Host Name: batevent1
   Current Working Dir: /local/data/batevent/batevent_reproc/trigger539866
======================================================================

  Trigger: 00539866      Segment: 000

  BAT Trigger Time: 375771947.136   [s; MET]
      Trigger Stop: 375771948.16   [s; MET]
               UTC: 2012-11-28T05:05:37.212960    [includes UTCF correction]
       Where From?: TDRSS position message

  BAT
    RA: 300.582775438788   Dec: 54.3214660612968  [deg; J2000]

     Catalogged Source?: NO
     Point Source?:      YES
     GRB Indicated?:     YES    [ by BAT flight software ]
     Image S/N Ratio:    7.3
     Image Trigger?:     NO
     Rate S/N Ratio:     9.79795897113271  [ if not an image trigger ]
     Image S/N Ratio:    7.3

  Analysis Position:   [ source = BAT ]
    RA: 300.582775438788   Dec: 54.3214660612968  [deg; J2000]

  Refined Position:   [ source = BAT pre-slew burst ]
    RA: 300.588451186717   Dec: 54.2997324101534  [deg; J2000]
        { 20h 02m 21.2s , +54d 17' 59.0" }
         +/- 0.666858407985102 [arcmin] (estimated 90% radius based on SNR)
         +/- 0.17375182840517 [arcmin] (formal 1-sigma fit error)
    SNR: 54.2623885353922

  Angular difference between the analysis and refined position is 1.319066 arcmin

  Partial Coding Fraction: 0.8828125    [ including projection effects ]

  Duration
     T90: 23.4279999732971 +/- 1.64951387437372
        Measured from: 13.0920000076294
                   to: 36.5199999809265     [s; relative to TRIGTIME]
     T50: 7.39199995994568 +/- 0.447571198196601
        Measured from: 17.5160000324249
                   to: 24.9079999923706     [s; relative to TRIGTIME]


  Fluence
     Peak Flux  (peak 1 second)
        Measured from: 21.6840000152588
                   to: 22.6840000152588     [s; relative to TRIGTIME]
     Total Fluence
        Measured from: -0.00399994850158691
                   to: 41.688000023365     [s; relative to TRIGTIME]

             Band 1     Band 2     Band 3     Band 4
              15-25      25-50     50-100    100-350     keV
 Total     3.401324   4.226054   2.523560   0.402360
           0.049637   0.052852   0.046621   0.042123 [error]
 Peak      0.339884   0.583450   0.550563   0.101145
           0.011306   0.013838   0.013615   0.008793 [error]

     [ fluence units of on-axis counts / fully illuminated detector ]

======================================================================


====== Table of the duration information =============================

        Value   tstart    tstop
T100   41.692   -0.004   41.688
T90    23.428   13.092   36.520
T50     7.392   17.516   24.908
Peak    1.000   21.684   22.684


====== Spectral Analysis Summary =====================================

Model      : spectral model: simple power-law (PL) and cutoff power-law (CPL)
Ph_index   : photon index: E^{Ph_index}
Ph_90err   : 90% error of the photon index
Epeak      : Epeak in keV
Epeak_90err: 90% error of Epeak
Norm       : normalization at 50 keV in both the PL model and CPL model
Nomr_90err : 90% error of the normalization
chi2       : Chi-Squared
dof        : degree of freedo

=== Time-averaged spectral analysis ===
(Best model with acceptable fit: CPL)

Model Ph_index Ph_90err_low Ph_90err_hi  Epeak  Epeak_90err_low  Epeak_90err_hi  Norm       Nomr_90err_low    Norm_90err_hi    chi2    dof
PL      -1.860    -0.040      0.040       -           -               -         1.59e-02     -3.28e-04          3.28e-04      62.400   57
CPL     -1.318    -0.179      0.186       64.923      -5.394         8.462      2.88e-02     -5.05e-03          6.42e-03      33.850   56


=== 1-s peak spectral analysis ===
(Best model with acceptable fit: CPL)

Model Ph_index Ph_90err_low Ph_90err_hi  Epeak  Epeak_90err_low  Epeak_90err_hi  Norm       Nomr_90err_low    Norm_90err_hi    chi2    dof
PL      -1.287     -0.048     0.048       -           -               -         1.09e-01     -3.06e-03          3.06e-03      81.040   57
CPL     -0.495     -0.219     0.230      107.708     -12.373        20.023      2.47e-01     -4.89e-02          6.41e-02      38.690   56


=== Fluence/Peak Flux Summary ===

              Model    Band1     Band2     Band3     Band4     Band5     Total
                       15-25     25-50    50-100    100-350    15-150    15-350    keV
Fluence         PL   1.19e-06  1.76e-06  1.94e-06  4.01e-06  6.10e-06  8.89e-06   erg/cm2
      90%_error_low -4.70e-08 -3.98e-08 -5.22e-08 -2.39e-07 -1.26e-07 -2.71e-07   erg/cm2
      90%_error_hi   4.78e-08  3.97e-08  5.22e-08  2.49e-07  1.26e-07  2.78e-07   erg/cm2
Peak flux       PL   9.96e-04  1.23e-02  8.27e-02  1.26e+01  3.55e-01  1.26e+01   ph/cm2/s
      90%_error_low     N/A       N/A       N/A       N/A       N/A       N/A     ph/cm2/s
      90%_error_hi      N/A       N/A       N/A       N/A       N/A       N/A     ph/cm2/s

Fluence        CPL   1.05e-06  1.81e-06  1.98e-06  2.04e-06  5.83e-06  6.89e-06   erg/cm2
      90%_error_low -6.13e-08 -4.41e-08 -5.67e-08 -3.66e-07 -1.52e-07 -4.04e-07   erg/cm2
      90%_error_hi   6.25e-08  4.43e-08  5.69e-08  4.65e-07  1.52e-07  4.94e-07   erg/cm2
Peak flux      CPL   2.97e+00  4.34e+00  3.74e+00  2.44e+00  1.25e+01  1.35e+01   ph/cm2/s
      90%_error_low -2.49e-01 -1.55e-01 -1.40e-01 -3.67e-01 -4.00e-01 -5.60e-01   ph/cm2/s
      90%_error_hi   2.55e-01  1.55e-01  1.42e-01  4.42e-01  4.02e-01  6.02e-01   ph/cm2/s

======================================================================
Image
Pre-slew 15.0-350.0 keV image (Event data)
#   RAcent    DECcent   POSerr    Theta     Phi              Peak Cts       SNR   Name
  300.5885    54.2997   0.0035    24.5790   175.5194         4.1774645     54.262 TRIG_00539866

Foreground time interval of the image:
 -0.004  20.365 (delta_t =  20.369 [sec])
Background time interval of the image:
-239.136  -0.004 (delta_t = 239.132 [sec])
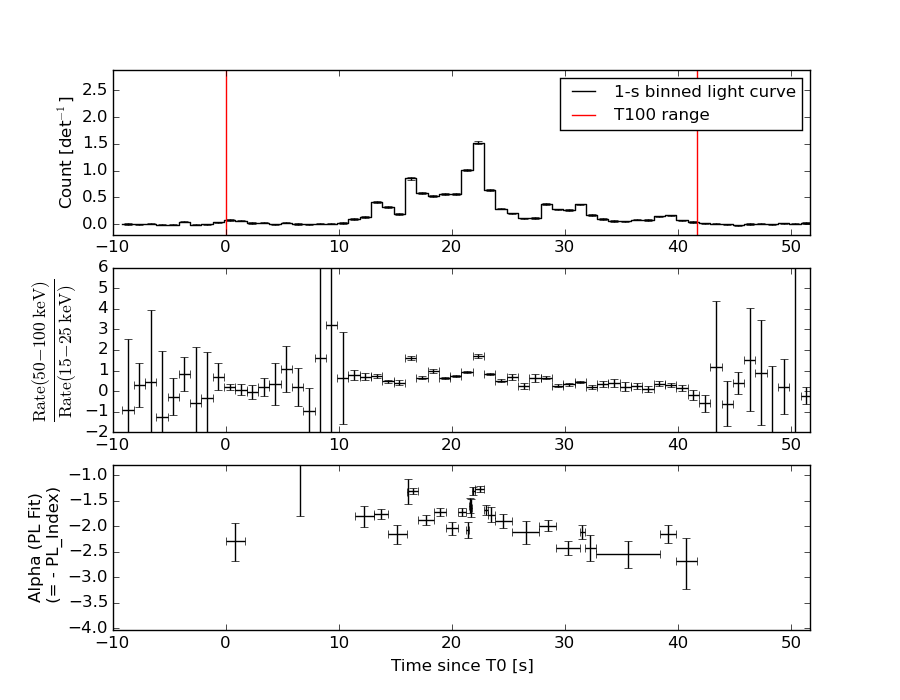
Light Curves
Note: The mask-weighted lightcurves have units of either count/det or counts/sec/det, where a det is 0.4 x 0.4 = 0.16 sq cm.
Full-time range; 1 s binning
Other quick-look light curves:
- 64 ms binning (zoomed)
- 16 ms binning (zoomed)
- 8 ms binning (zoomed)
- 2 ms binning (zoomed)
- SN=5 or 10 s binning (full-time range)
- Raw light curve
Spectra
- 64 ms binning (zoomed)
- 16 ms binning (zoomed)
- 8 ms binning (zoomed)
- 2 ms binning (zoomed)
- SN=5 or 10 s binning (full-time range)
- Raw light curve
Spectra
Notes:
- 1) The fitting includes the systematic errors.
- 2) When the burst includes telescope slew time periods, the fitting uses an average response file made from multiple 5-s response files through out the slew time plus single time preiod for the non-slew times, and weighted by the total counts in the corresponding time period using addrmf. An average response file is needed becuase a spectral fit using the pre-slew DRM will introduce some errors in both a spectral shape and a normalization if the PHA file contains a lot of the slew/post-slew time interval.
- 3) For fits to more complicated models (e.g. a power-law over a cutoff power-law), the BAT team has decided to require a chi-square improvement of more than 6 for each extra dof.
Time averaged spectrum fit using the average DRM
Power-law model
Time interval is from   -0.004 sec. to   41.688 sec.

Spectral model in power-law:
------------------------------------------------------------
Parameters  : value       lower 90%   higher 90%
Photon index: -1.8598     ( -0.0402425   0.0401202 )
Norm@50keV  : 1.59180E-02    ( -0.000328262   0.000328061 )
------------------------------------------------------------
#Fit statistic : Chi-Squared =          62.40 using 59 PHA bins.
# Reduced chi-squared =          1.095 for     57 degrees of freedom
# Null hypothesis probability =   2.903996e-01

Photon flux (15-150 keV)    in 41.69 sec: 2.24654 ( -0.05379  0.05403 ) ph/cm2/s
Energy fluence (15-150 keV)             : 6.10212e-06 ( -1.26106e-07  1.26354e-07 ) ergs/cm2
Cutoff power-law model
Time interval is from   -0.004 sec. to   41.688 sec.
Spectral model in the cutoff power-law:
------------------------------------------------------------
Parameters  : value       lower 90%   higher 90%
Photon index: -1.31845     ( -0.179162   0.186476 )
Epeak [keV] : 64.9227      ( -5.39422 8.4619 )
Norm@50keV  : 2.88377E-02    ( -0.0050475   0.00641864 )
------------------------------------------------------------
#Fit statistic : Chi-Squared =          33.85 using 59 PHA bins.
# Reduced chi-squared =         0.6044 for     56 degrees of freedom
# Null hypothesis probability =   9.916379e-01

Photon flux (15-150 keV)    in 41.69 sec: 2.13708 ( -0.06255  0.06304 ) ph/cm2/s
Energy fluence (15-150 keV)             : 5.83043e-06 ( -1.52345e-07  1.52197e-07 ) ergs/cm2
1-s peak spectrum fit
Power-law model
Time interval is from   21.684 sec. to   22.684 sec.

Spectral model in power-law:
------------------------------------------------------------
Parameters  : value       lower 90%   higher 90%
Photon index: -1.28674     ( -0.0479102   0.0479048 )
Norm@50keV  : 0.108700    ( -0.00306498   0.00306489 )
------------------------------------------------------------
#Fit statistic : Chi-Squared =          81.04 using 59 PHA bins.
# Reduced chi-squared =          1.422 for     57 degrees of freedom
# Null hypothesis probability =   1.989032e-02

Photon flux (15-150 keV)    in 1 sec: 0.355356 (    ) ph/cm2/s
Energy fluence (15-150 keV)             : 1.0778e-06 ( -3.26226e-08  3.26525e-08 ) ergs/cm2
Cutoff power-law model
Time interval is from   21.684 sec. to   22.684 sec.
Spectral model in the cutoff power-law:
------------------------------------------------------------
Parameters  : value       lower 90%   higher 90%
Photon index: -0.495255     ( -0.219276   0.229842 )
Epeak [keV] : 107.708      ( -12.3732 20.0233 )
Norm@50keV  : 0.246695    ( -0.04887   0.0640945 )
------------------------------------------------------------
#Fit statistic : Chi-Squared =          38.69 using 59 PHA bins.
# Reduced chi-squared =         0.6909 for     56 degrees of freedom
# Null hypothesis probability =   9.622937e-01

Photon flux (15-150 keV)    in 1 sec: 12.4615 ( -0.4004  0.4018 ) ph/cm2/s
Energy fluence (15-150 keV)             : 1.04311e-06 ( -3.46701e-08  3.45953e-08 ) ergs/cm2
Time-resolved spectra
Distribution
T90 vs. Hardness ratio plot
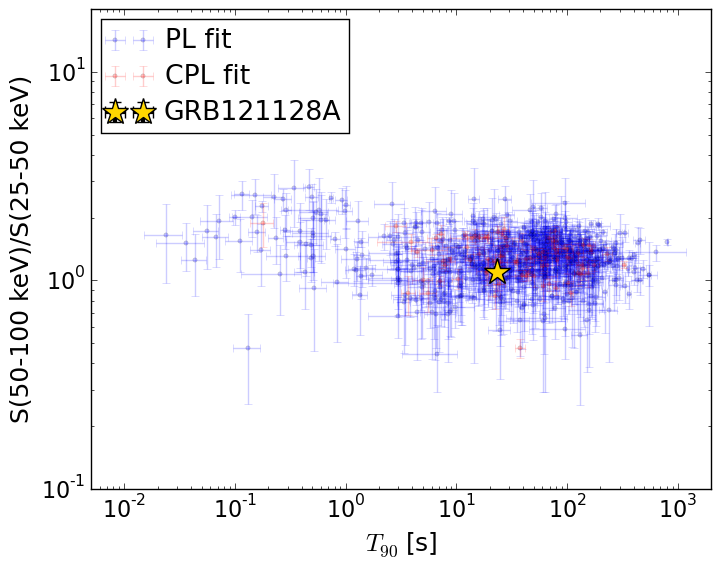
T90                                   = 23.428 sec.
Hardness ratio (energy fluence ratio) = 1.09647817337
S(15-50 keV) vs. S(50-150 keV) plot
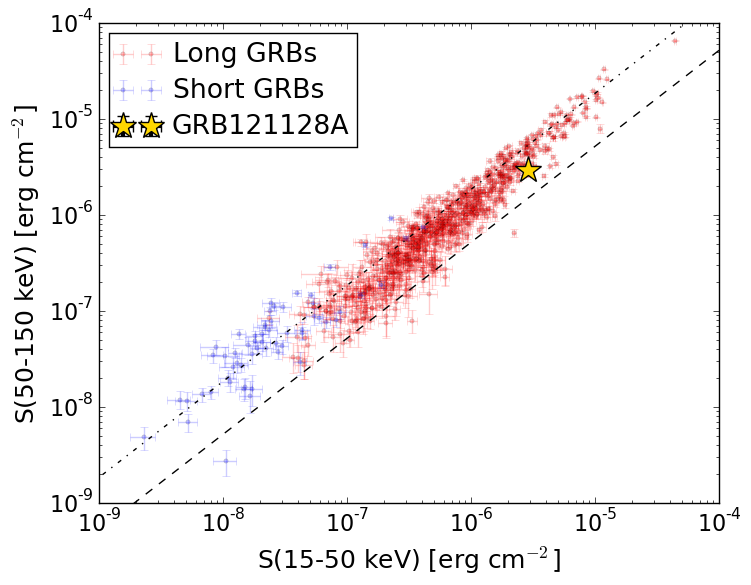
S(15-50 keV)  = 2.860075e-06
S(50-150 keV) = 2.9703467e-06
The dash-dotted line and the dashed line traces the fluences calculated from the Band function with Epeak = 15 and 150 keV, respectively. Both lines assume a canonical values of alpha = -1 and beta = -2.5.
Mask shadow pattern
IMX = -4.559939090212756E-01, IMY = -3.573238866592082E-02
Spacecraft aspect plot
Bright source in the pre-burst/pre-slew/post-slew images
Pre-burst image of 15-350 keV band
Time interval of the image:
-239.136000 -0.004000

# RAcent  DECcent POSerr Theta    Phi  PeakCts   SNR AngSep     Name
#  [deg]    [deg]    ['] [deg]  [deg]                   [']
254.4636  35.3902  363.3  28.8  -95.5   0.0104   0.0    2.9	Her X-1
299.4137  35.1605    5.0  39.4 -160.8   0.7763   2.3    9.0	Cyg X-1
308.1338  40.9383    2.1  38.0 -175.0   1.6449   5.6    1.4	Cyg X-3
326.0407  38.3058    9.1  47.9  170.4   0.7221   1.3    6.2	Cyg X-2
324.4723  38.3784    2.2  47.2  171.7   2.7000   5.3 ------	UNKNOWN
324.4807  34.0491    2.2  50.8  174.8   3.3945   5.2 ------	UNKNOWN
289.9090  29.7618    2.6  40.8 -145.9   1.6792   4.5 ------	UNKNOWN
Pre-slew background subtracted image of 15-350 keV band
Time interval of the image:
-0.004000 20.364600

# RAcent  DECcent POSerr Theta    Phi  PeakCts   SNR AngSep     Name
#  [deg]    [deg]    ['] [deg]  [deg]                   [']
254.5905  35.1948   25.6  29.0  -95.7  -0.0473  -0.5   11.0	Her X-1
299.4400  35.1441    8.8  39.4 -160.8  -0.1285  -1.3    8.1	Cyg X-1
308.0446  41.0376    4.1  37.9 -175.0   0.2798   2.8    5.9	Cyg X-3
326.2638  38.4253   13.8  47.9  170.1  -0.1406  -0.8    7.6	Cyg X-2
300.5884  54.2997    0.2  24.6  175.5   4.1775  54.3 ------	UNKNOWN
240.1661  58.3451    2.6   9.3  -39.2   0.2887   4.4 ------	UNKNOWN
Post-slew image of 15-350 keV band
Time interval of the image:
66.364620 962.932300

# RAcent  DECcent POSerr Theta    Phi  PeakCts   SNR AngSep     Name
#  [deg]    [deg]    ['] [deg]  [deg]                   [']
254.5338  35.4180   13.2  36.8  -62.1  -1.0880  -0.9    5.9	Her X-1
288.8183  10.9899    3.5  44.3 -123.8   9.0904   3.3    2.9	GRS 1915+105
299.7231  35.2986    3.7  19.0 -138.3   2.0112   3.1    8.7	Cyg X-1
308.1347  40.9689    1.1  14.3 -164.1   6.2916  10.9    1.5	Cyg X-3
326.2087  38.3983    5.1  23.6  161.6   1.3635   2.3    4.9	Cyg X-2
212.3328  46.2186    3.5  53.2  -20.1   4.8652   3.3 ------	UNKNOWN
210.3564  44.4269    3.7  55.4  -20.5   7.3215   3.2 ------	UNKNOWN
287.3865  21.7007    3.2  34.1 -118.2   3.7002   3.7 ------	UNKNOWN
314.4495  -2.4559    6.3  57.9 -156.8   8.2435   1.8 ------	UNKNOWN
215.7508  39.3165    5.1  56.3  -28.3   7.7806   2.3 ------	UNKNOWN
240.7347  32.3055    5.0  47.0  -53.0   7.2966   2.4 ------	UNKNOWN
273.0770  18.8825    3.6  41.2  -98.9  12.6728   3.3 ------	UNKNOWN