Analysis Summary
Notes:
- 1) No attempt has been made to eliminate the non-significant decimal places.
- 2) This batgrbproduct analysis is done using the HEASARC data.
- 3) This batgrbproduct analysis is using the flight position for the mask-weighting calculation.
======================================================================
                  BAT GRB EVENT DATA PROCESSING REPORT
    Process Script Ver: batgrbproduct v2.46
    Process Start Time: Sun Jan 12 23:10:26 EST 2014
             Host Name: batevent1
   Current Working Dir: /local/data/batevent/batevent_reproc/trigger540178
======================================================================

  Trigger: 00540178      Segment: 000

  BAT Trigger Time: 376057552   [s; MET]
      Trigger Stop: 376057616   [s; MET]
               UTC: 2012-12-01T12:25:42.064740    [includes UTCF correction]
       Where From?: TDRSS position message

  BAT
    RA: 13.4879874034949   Dec: -42.9520058447332  [deg; J2000]

     Catalogged Source?: NO
     Point Source?:      YES
     GRB Indicated?:     YES    [ by BAT flight software ]
     Image S/N Ratio:    9.28
     Image Trigger?:     YES
     Rate S/N Ratio:     0  [ if not an image trigger ]
     Image S/N Ratio:    9.28

  Analysis Position:   [ source = BAT ]
    RA: 13.4879874034949   Dec: -42.9520058447332  [deg; J2000]

  Refined Position:   [ source = BAT pre-slew burst ]
    RA: 13.4957664996339   Dec: -42.934956596233  [deg; J2000]
        { 00h 53m 59.0s , -42d 56' 05.8" }
         +/- 1.59695376852788 [arcmin] (estimated 90% radius based on SNR)
         +/- 0.562566729973271 [arcmin] (formal 1-sigma fit error)
    SNR: 15.5847825220581

  Angular difference between the analysis and refined position is 1.078506 arcmin

  Partial Coding Fraction: 1    [ including projection effects ]

  Duration
     T90: 38 +/- 8.24621125123532
        Measured from: -23
                   to: 15     [s; relative to TRIGTIME]
     T50: 20 +/- 4.12310562561766
        Measured from: -17
                   to: 3     [s; relative to TRIGTIME]


  Fluence
     Peak Flux  (peak 1 second)
        Measured from: -9
                   to: -8     [s; relative to TRIGTIME]
     Total Fluence
        Measured from: -24
                   to: 22     [s; relative to TRIGTIME]

             Band 1     Band 2     Band 3     Band 4
              15-25      25-50     50-100    100-350     keV
 Total     0.496686   0.529114   0.283573   0.089508
           0.038067   0.039028   0.034503   0.030680 [error]
 Peak      0.031119   0.040714   0.025184   0.008966
           0.005960   0.006368   0.005590   0.004736 [error]

     [ fluence units of on-axis counts / fully illuminated detector ]

======================================================================


====== Table of the duration information =============================

        Value   tstart    tstop
T100   46.000  -24.000   22.000
T90    38.000  -23.000   15.000
T50    20.000  -17.000    3.000
Peak    1.000   -9.000   -8.000


====== Spectral Analysis Summary =====================================

Model      : spectral model: simple power-law (PL) and cutoff power-law (CPL)
Ph_index   : photon index: E^{Ph_index}
Ph_90err   : 90% error of the photon index
Epeak      : Epeak in keV
Epeak_90err: 90% error of Epeak
Norm       : normalization at 50 keV in both the PL model and CPL model
Nomr_90err : 90% error of the normalization
chi2       : Chi-Squared
dof        : degree of freedo

=== Time-averaged spectral analysis ===
(Best model with acceptable fit: PL)

Model Ph_index Ph_90err_low Ph_90err_hi  Epeak  Epeak_90err_low  Epeak_90err_hi  Norm       Nomr_90err_low    Norm_90err_hi    chi2    dof
PL      -1.866    -0.169      0.163       -           -               -         1.70e-03     -1.78e-04          1.74e-04      51.570   57
CPL     -1.828    -0.578      0.663      192.867    -185.685      -192.867      1.79e-03     -8.59e-04          2.40e-03      51.560   56


=== 1-s peak spectral analysis ===
(Best model with acceptable fit: PL)

Model Ph_index Ph_90err_low Ph_90err_hi  Epeak  Epeak_90err_low  Epeak_90err_hi  Norm       Nomr_90err_low    Norm_90err_hi    chi2    dof
PL      -1.557     -0.320     0.304       -           -               -         6.29e-03     -1.22e-03          1.19e-03      69.320   57
CPL     -1.237     -1.198     1.553      115.205    -115.205      -115.205      9.27e-03     -9.27e-03          4.92e-02      69.130   56


=== Fluence/Peak Flux Summary ===

              Model    Band1     Band2     Band3     Band4     Band5     Total
                       15-25     25-50    50-100    100-350    15-150    15-350    keV
Fluence         PL   1.41e-07  2.08e-07  2.28e-07  4.69e-07  7.20e-07  1.05e-06   erg/cm2
      90%_error_low -1.78e-08 -1.74e-08 -3.28e-08 -1.24e-07 -7.40e-08 -1.60e-07   erg/cm2
      90%_error_hi   1.82e-08  1.75e-08  3.32e-08  1.52e-07  7.55e-08  1.82e-07   erg/cm2
Peak flux       PL   2.73e-01  2.66e-01  1.81e-01  1.93e-01  7.98e-01  9.13e-01   ph/cm2/s
      90%_error_low -7.40e-02 -4.79e-02 -4.51e-02 -8.13e-02 -1.40e-01 -1.66e-01   ph/cm2/s
      90%_error_hi   7.86e-02  4.75e-02  4.45e-02  1.10e-01  1.40e-01  1.69e-01   ph/cm2/s

Fluence        CPL   1.41e-07  2.09e-07  2.27e-07  4.34e-07  7.16e-07  1.01e-06   erg/cm2
      90%_error_low -1.97e-08 -1.83e-08 -3.39e-08 -2.96e-07 -9.01e-08 -3.16e-07   erg/cm2
      90%_error_hi   1.93e-08  2.32e-08  3.34e-08  5.85e-08  7.79e-08  1.67e-07   erg/cm2
Peak flux      CPL   2.61e-01  2.76e-01  1.85e-01  1.30e-01  7.89e-01  8.52e-01   ph/cm2/s
      90%_error_low -9.08e-02 -5.54e-02 -4.79e-02 -1.30e-01 -1.45e-01 -1.90e-01   ph/cm2/s
      90%_error_hi   8.82e-02  6.29e-02  5.04e-02  9.45e-02  1.44e-01  2.17e-01   ph/cm2/s

======================================================================
Image
Pre-slew 15.0-350.0 keV image (Event data)
#   RAcent    DECcent   POSerr    Theta     Phi              Peak Cts       SNR   Name
   13.4958   -42.9350   0.0124     4.2649    -8.1036         0.9970423     15.585 TRIG_00540178

Foreground time interval of the image:
-13.299  22.000 (delta_t =  35.299 [sec])
Background time interval of the image:
Light Curves
Note: The mask-weighted lightcurves have units of either count/det or counts/sec/det, where a det is 0.4 x 0.4 = 0.16 sq cm.
Full-time range; 1 s binning
Other quick-look light curves:
- 64 ms binning (zoomed)
- 16 ms binning (zoomed)
- 8 ms binning (zoomed)
- 2 ms binning (zoomed)
- SN=5 or 10 s binning (full-time range)
- Raw light curve
Spectra
- 64 ms binning (zoomed)
- 16 ms binning (zoomed)
- 8 ms binning (zoomed)
- 2 ms binning (zoomed)
- SN=5 or 10 s binning (full-time range)
- Raw light curve
Spectra
Notes:
- 1) The fitting includes the systematic errors.
- 2) When the burst includes telescope slew time periods, the fitting uses an average response file made from multiple 5-s response files through out the slew time plus single time preiod for the non-slew times, and weighted by the total counts in the corresponding time period using addrmf. An average response file is needed becuase a spectral fit using the pre-slew DRM will introduce some errors in both a spectral shape and a normalization if the PHA file contains a lot of the slew/post-slew time interval.
- 3) For fits to more complicated models (e.g. a power-law over a cutoff power-law), the BAT team has decided to require a chi-square improvement of more than 6 for each extra dof.
Time averaged spectrum fit using the average DRM
Power-law model
Time interval is from  -24.000 sec. to   22.000 sec.

Spectral model in power-law:
------------------------------------------------------------
Parameters  : value       lower 90%   higher 90%
Photon index: -1.86642     ( -0.168672   0.162708 )
Norm@50keV  : 1.70166E-03    ( -0.000177826   0.000174193 )
------------------------------------------------------------
#Fit statistic : Chi-Squared =          51.57 using 59 PHA bins.
# Reduced chi-squared =         0.9048 for     57 degrees of freedom
# Null hypothesis probability =   6.780370e-01

Photon flux (15-150 keV)    in 46 sec: 0.240813 ( -0.020321  0.02033 ) ph/cm2/s
Energy fluence (15-150 keV)             : 7.19744e-07 ( -7.39735e-08  7.54957e-08 ) ergs/cm2
Cutoff power-law model
Time interval is from  -24.000 sec. to   22.000 sec.
Spectral model in the cutoff power-law:
------------------------------------------------------------
Parameters  : value       lower 90%   higher 90%
Photon index: -1.82798     ( -0.578106   0.66378 )
Epeak [keV] : 192.867      ( -187.661 -194.843 )
Norm@50keV  : 1.78912E-03    ( -0.000858439   0.00240454 )
------------------------------------------------------------
#Fit statistic : Chi-Squared =          51.56 using 59 PHA bins.
# Reduced chi-squared =         0.9208 for     56 degrees of freedom
# Null hypothesis probability =   6.433389e-01

Photon flux (15-150 keV)    in 46 sec: 0.240363 ( -0.021531  0.020717 ) ph/cm2/s
Energy fluence (15-150 keV)             : 7.16386e-07 ( -9.00777e-08  7.7884e-08 ) ergs/cm2
1-s peak spectrum fit
Power-law model
Time interval is from   -9.000 sec. to   -8.000 sec.

Spectral model in power-law:
------------------------------------------------------------
Parameters  : value       lower 90%   higher 90%
Photon index: -1.55714     ( -0.320078   0.30392 )
Norm@50keV  : 6.29004E-03    ( -0.00122169   0.00119008 )
------------------------------------------------------------
#Fit statistic : Chi-Squared =          69.32 using 59 PHA bins.
# Reduced chi-squared =          1.216 for     57 degrees of freedom
# Null hypothesis probability =   1.268519e-01

Photon flux (15-150 keV)    in 1 sec: 0.797959 ( -0.140254  0.140297 ) ph/cm2/s
Energy fluence (15-150 keV)             : 5.9163e-08 ( -1.23733e-08  1.26462e-08 ) ergs/cm2
Cutoff power-law model
Time interval is from   -9.000 sec. to   -8.000 sec.
Spectral model in the cutoff power-law:
------------------------------------------------------------
Parameters  : value       lower 90%   higher 90%
Photon index: -1.23734     ( -1.19821   1.55292 )
Epeak [keV] : 115.205      ( -115.201 -115.201 )
Norm@50keV  : 9.26527E-03    ( -0.0092655   0.0492036 )
------------------------------------------------------------
#Fit statistic : Chi-Squared =          69.13 using 59 PHA bins.
# Reduced chi-squared =          1.234 for     56 degrees of freedom
# Null hypothesis probability =   1.118368e-01

Photon flux (15-150 keV)    in 1 sec: 0.789491 ( -0.144895  0.143879 ) ph/cm2/s
Energy fluence (15-150 keV)             : 5.77431e-08 ( -1.34506e-08  1.38037e-08 ) ergs/cm2
Time-resolved spectra
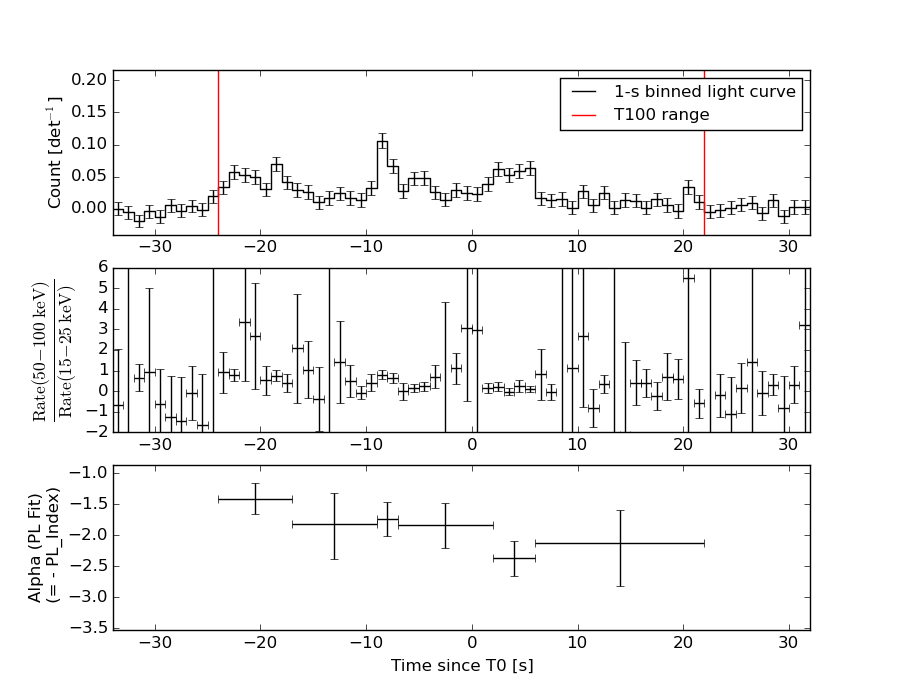
Distribution
T90 vs. Hardness ratio plot
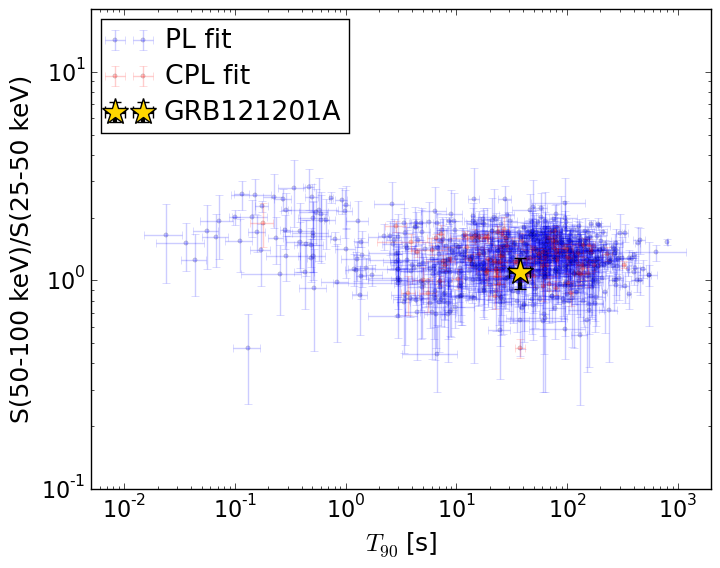
T90                                   = 38.0 sec.
Hardness ratio (energy fluence ratio) = 1.09705903891
S(15-50 keV) vs. S(50-150 keV) plot
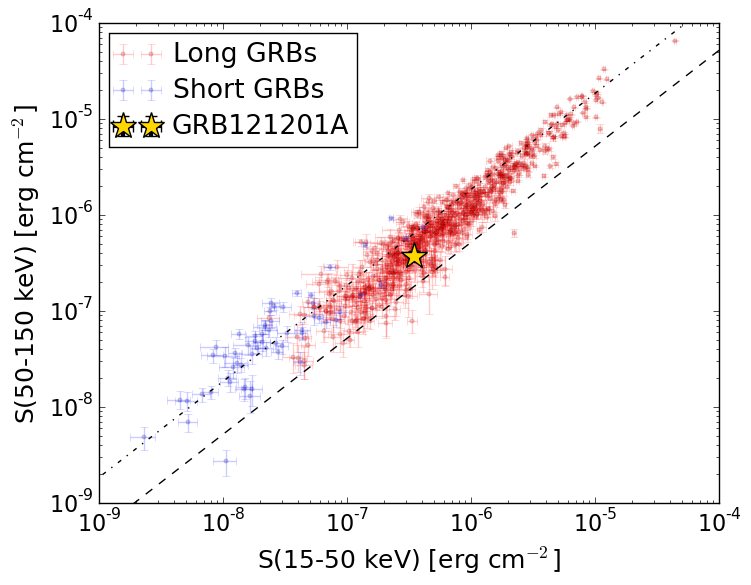
S(15-50 keV)  = 3.487141e-07
S(50-150 keV) = 3.710255e-07
The dash-dotted line and the dashed line traces the fluences calculated from the Band function with Epeak = 15 and 150 keV, respectively. Both lines assume a canonical values of alpha = -1 and beta = -2.5.
Mask shadow pattern
IMX = 7.382999173426451E-02, IMY = 1.051230636761357E-02
Spacecraft aspect plot
Bright source in the pre-burst/pre-slew/post-slew images
Pre-burst image of 15-350 keV band
Time interval of the image:
Pre-slew background subtracted image of 15-350 keV band
Time interval of the image:
-13.299410 22.000000

# RAcent  DECcent POSerr Theta    Phi  PeakCts   SNR AngSep     Name
#  [deg]    [deg]    ['] [deg]  [deg]                   [']
358.2150   6.7825    2.5  55.6   12.9   1.8500   4.5  420.7	UNKNOWN
 13.4958 -42.9350    0.7   4.3   -8.1   0.9966  15.6 ------	UNKNOWN
 77.5932 -75.6707    3.2  38.4 -163.7   0.3195   3.6 ------	UNKNOWN
297.5637 -71.0213    2.0  44.0 -116.1   1.6617   5.9 ------	UNKNOWN
Post-slew image of 15-350 keV band
Time interval of the image:
98.100590 783.134500
841.000000 963.045000

# RAcent  DECcent POSerr Theta    Phi  PeakCts   SNR AngSep     Name
#  [deg]    [deg]    ['] [deg]  [deg]                   [']
 46.3074 -39.0197    2.7  24.9  132.6   2.4767   4.3 ------	UNKNOWN
 93.9648 -60.6710    2.8  49.2 -179.2   4.7527   4.1 ------	UNKNOWN
328.6000  -7.1483    2.8  53.2  -20.6   5.4168   4.1 ------	UNKNOWN
326.2264 -17.3049    3.8  47.4  -31.9   3.0920   3.0 ------	UNKNOWN
136.5981 -72.5642    3.4  58.0 -156.8  12.8993   3.4 ------	UNKNOWN
322.4760  -4.8042    3.9  58.9  -24.3  11.9153   3.0 ------	UNKNOWN
164.1372 -80.6959    6.7  55.3 -145.1   7.4174   1.8 ------	UNKNOWN
302.4707 -73.0039    4.1  43.8 -116.1   6.4404   2.8 ------	UNKNOWN