Analysis Summary
Notes:
- 1) No attempt has been made to eliminate the non-significant decimal places.
- 2) This batgrbproduct analysis is done using the HEASARC data.
- 3) This batgrbproduct analysis is using the flight position for the mask-weighting calculation.
======================================================================
BAT GRB EVENT DATA PROCESSING REPORT
Process Script Ver: batgrbproduct v2.46
Process Start Time: Sun Jan 12 22:56:07 EST 2014
Host Name: batevent1
Current Working Dir: /local/data/batevent/batevent_reproc/trigger540255
======================================================================
Trigger: 00540255 Segment: 000
BAT Trigger Time: 376114814.976 [s; MET]
Trigger Stop: 376114816 [s; MET]
UTC: 2012-12-02T04:20:05.038260 [includes UTCF correction]
Where From?: TDRSS position message
BAT
RA: 256.81487469703 Dec: 23.9520792363031 [deg; J2000]
Catalogged Source?: NO
Point Source?: YES
GRB Indicated?: YES [ by BAT flight software ]
Image S/N Ratio: 7.49
Image Trigger?: NO
Rate S/N Ratio: 13.7840487520902 [ if not an image trigger ]
Image S/N Ratio: 7.49
Analysis Position: [ source = BAT ]
RA: 256.81487469703 Dec: 23.9520792363031 [deg; J2000]
Refined Position: [ source = BAT pre-slew burst ]
RA: 256.795738457097 Dec: 23.9449641866872 [deg; J2000]
{ 17h 07m 11.0s , +23d 56' 41.9" }
+/- 1.09715379311727 [arcmin] (estimated 90% radius based on SNR)
+/- 0.40248048221767 [arcmin] (formal 1-sigma fit error)
SNR: 26.643628360915
Angular difference between the analysis and refined position is 1.132845 arcmin
Partial Coding Fraction: 0.703125 [ including projection effects ]
Duration
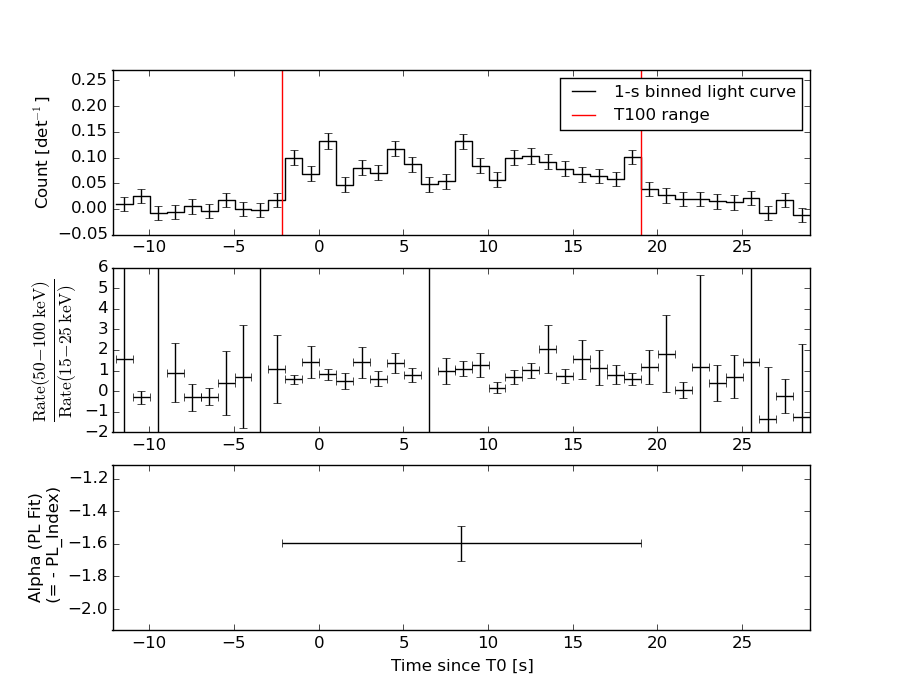
T90: 19.5359999537468 +/- 1.49226541307976
Measured from: -1.33600002527237
to: 18.1999999284744 [s; relative to TRIGTIME]
T50: 10.1599999666214 +/- 1.31444893960463
Measured from: 2.96399998664856
to: 13.12399995327 [s; relative to TRIGTIME]
Fluence
Peak Flux (peak 1 second)
Measured from: -0.0160000324249268
to: 0.983999967575073 [s; relative to TRIGTIME]
Total Fluence
Measured from: -2.18400001525879
to: 19.0080000162125 [s; relative to TRIGTIME]
Band 1 Band 2 Band 3 Band 4
15-25 25-50 50-100 100-350 keV
Total 0.493030 0.696439 0.476748 0.089506
0.035695 0.036567 0.032498 0.028303 [error]
Peak 0.042170 0.056458 0.035999 0.007827
0.008103 0.008258 0.007567 0.006145 [error]
[ fluence units of on-axis counts / fully illuminated detector ]
======================================================================
====== Table of the duration information =============================
Value tstart tstop
T100 21.192 -2.184 19.008
T90 19.536 -1.336 18.200
T50 10.160 2.964 13.124
Peak 1.000 -0.016 0.984
====== Spectral Analysis Summary =====================================
Model : spectral model: simple power-law (PL) and cutoff power-law (CPL)
Ph_index : photon index: E^{Ph_index}
Ph_90err : 90% error of the photon index
Epeak : Epeak in keV
Epeak_90err: 90% error of Epeak
Norm : normalization at 50 keV in both the PL model and CPL model
Nomr_90err : 90% error of the normalization
chi2 : Chi-Squared
dof : degree of freedo
=== Time-averaged spectral analysis ===
(Best model with acceptable fit: CPL)
Model Ph_index Ph_90err_low Ph_90err_hi Epeak Epeak_90err_low Epeak_90err_hi Norm Nomr_90err_low Norm_90err_hi chi2 dof
PL -1.596 -0.107 0.106 - - - 5.69e-03 -3.61e-04 3.60e-04 48.920 57
CPL -0.904 -0.459 0.519 75.993 -15.002 54.726 1.30e-02 -5.41e-03 1.10e-02 41.930 56
=== 1-s peak spectral analysis ===
(Best model with acceptable fit: PL)
Model Ph_index Ph_90err_low Ph_90err_hi Epeak Epeak_90err_low Epeak_90err_hi Norm Nomr_90err_low Norm_90err_hi chi2 dof
PL -1.721 -0.300 0.284 - - - 9.11e-03 -1.74e-03 1.70e-03 51.060 57
CPL -0.780 -1.100 1.592 58.540 -14.375 -58.540 2.98e-02 -2.98e-02 1.95e-01 49.200 56
=== Fluence/Peak Flux Summary ===
Model Band1 Band2 Band3 Band4 Band5 Total
15-25 25-50 50-100 100-350 15-150 15-350 keV
Fluence PL 1.68e-07 2.92e-07 3.86e-07 1.04e-06 1.13e-06 1.89e-06 erg/cm2
90%_error_low -1.69e-08 -1.85e-08 -3.19e-08 -1.71e-07 -7.66e-08 -1.99e-07 erg/cm2
90%_error_hi 1.74e-08 1.84e-08 3.19e-08 1.92e-07 7.71e-08 2.16e-07 erg/cm2
Peak flux PL 4.64e-01 4.10e-01 2.49e-01 2.28e-01 1.22e+00 1.35e+00 ph/cm2/s
90%_error_low -1.16e-01 -7.00e-02 -6.01e-02 -9.21e-02 -2.07e-01 -2.31e-01 ph/cm2/s
90%_error_hi 1.22e-01 6.99e-02 6.03e-02 1.23e-01 2.07e-01 2.33e-01 ph/cm2/s
Fluence CPL 1.52e-07 3.14e-07 3.96e-07 3.93e-07 1.06e-06 1.25e-06 erg/cm2
90%_error_low -2.02e-08 -2.34e-08 -3.54e-08 -1.71e-07 -8.73e-08 -1.91e-07 erg/cm2
90%_error_hi 2.05e-08 2.40e-08 3.55e-08 3.30e-07 8.78e-08 3.33e-07 erg/cm2
Peak flux CPL 4.11e-01 4.54e-01 2.56e-01 8.04e-02 1.18e+00 1.20e+00 ph/cm2/s
90%_error_low -1.36e-01 -8.91e-02 -7.21e-02 -8.04e-02 -2.13e-01 -2.28e-01 ph/cm2/s
90%_error_hi 1.39e-01 9.49e-02 6.99e-02 1.90e-01 2.13e-01 2.78e-01 ph/cm2/s
======================================================================
Image
Pre-slew 15.0-350.0 keV image (Event data)
#   RAcent    DECcent   POSerr    Theta     Phi              Peak Cts       SNR   Name
  256.7957    23.9450   0.0073    33.4596   -26.3777         1.9366919     26.644 TRIG_00540255

Foreground time interval of the image:
 -2.184  19.008 (delta_t =  21.192 [sec])
Background time interval of the image:
-239.976  -2.184 (delta_t = 237.792 [sec])
Light Curves
Note: The mask-weighted lightcurves have units of either count/det or counts/sec/det, where a det is 0.4 x 0.4 = 0.16 sq cm.
Full-time range; 1 s binning
Other quick-look light curves:
- 64 ms binning (zoomed)
- 16 ms binning (zoomed)
- 8 ms binning (zoomed)
- 2 ms binning (zoomed)
- SN=5 or 10 s binning (full-time range)
- Raw light curve
Spectra
- 64 ms binning (zoomed)
- 16 ms binning (zoomed)
- 8 ms binning (zoomed)
- 2 ms binning (zoomed)
- SN=5 or 10 s binning (full-time range)
- Raw light curve
Spectra
Notes:
- 1) The fitting includes the systematic errors.
- 2) When the burst includes telescope slew time periods, the fitting uses an average response file made from multiple 5-s response files through out the slew time plus single time preiod for the non-slew times, and weighted by the total counts in the corresponding time period using addrmf. An average response file is needed becuase a spectral fit using the pre-slew DRM will introduce some errors in both a spectral shape and a normalization if the PHA file contains a lot of the slew/post-slew time interval.
- 3) For fits to more complicated models (e.g. a power-law over a cutoff power-law), the BAT team has decided to require a chi-square improvement of more than 6 for each extra dof.
Time averaged spectrum fit using the average DRM
Power-law model

Time interval is from   -2.184 sec. to   19.008 sec.

Spectral model in power-law:
------------------------------------------------------------
Parameters  : value       lower 90%   higher 90%
Photon index: -1.59637     ( -0.106687   0.105843 )
Norm@50keV  : 5.68865E-03    ( -0.000361193   0.000359741 )
------------------------------------------------------------
#Fit statistic : Chi-Squared =          48.92 using 59 PHA bins.
# Reduced chi-squared =         0.8583 for     57 degrees of freedom
# Null hypothesis probability =   7.679357e-01

Photon flux (15-150 keV)    in 21.19 sec: 0.730221 ( -0.045709  0.045773 ) ph/cm2/s
Energy fluence (15-150 keV)             : 1.12798e-06 ( -7.65724e-08  7.71144e-08 ) ergs/cm2
Cutoff power-law model
Time interval is from   -2.184 sec. to   19.008 sec.
Spectral model in the cutoff power-law:
------------------------------------------------------------
Parameters  : value       lower 90%   higher 90%
Photon index: -0.90373     ( -0.459166   0.519034 )
Epeak [keV] : 75.9932      ( -15.0017 54.7254 )
Norm@50keV  : 1.30250E-02    ( -0.00541019   0.0109672 )
------------------------------------------------------------
#Fit statistic : Chi-Squared =          41.93 using 59 PHA bins.
# Reduced chi-squared =         0.7488 for     56 degrees of freedom
# Null hypothesis probability =   9.186046e-01

Photon flux (15-150 keV)    in 21.19 sec: 0.706686 ( -0.048344  0.048284 ) ph/cm2/s
Energy fluence (15-150 keV)             : 1.0637e-06 ( -8.7342e-08  8.78145e-08 ) ergs/cm2
1-s peak spectrum fit
Power-law model
Time interval is from   -0.016 sec. to    0.984 sec.

Spectral model in power-law:
------------------------------------------------------------
Parameters  : value       lower 90%   higher 90%
Photon index: -1.72098     ( -0.299794   0.283661 )
Norm@50keV  : 9.11056E-03    ( -0.00173943   0.00169979 )
------------------------------------------------------------
#Fit statistic : Chi-Squared =          51.06 using 59 PHA bins.
# Reduced chi-squared =         0.8958 for     57 degrees of freedom
# Null hypothesis probability =   6.963907e-01

Photon flux (15-150 keV)    in 1 sec: 1.21904 ( -0.20722  0.20738 ) ph/cm2/s
Energy fluence (15-150 keV)             : 8.42345e-08 ( -1.6461e-08  1.68396e-08 ) ergs/cm2
Cutoff power-law model
Time interval is from   -0.016 sec. to    0.984 sec.
Spectral model in the cutoff power-law:
------------------------------------------------------------
Parameters  : value       lower 90%   higher 90%
Photon index: -0.78016     ( -1.10045   1.59207 )
Epeak [keV] : 58.5396      ( -14.3751 -58.5396 )
Norm@50keV  : 2.98125E-02    ( -0.0298125   0.195314 )
------------------------------------------------------------
#Fit statistic : Chi-Squared =          49.20 using 59 PHA bins.
# Reduced chi-squared =         0.8786 for     56 degrees of freedom
# Null hypothesis probability =   7.278901e-01

Photon flux (15-150 keV)    in 1 sec: 1.17972 ( -0.213428  0.21337 ) ph/cm2/s
Energy fluence (15-150 keV)             : 7.78789e-08 ( -1.76035e-08  1.86106e-08 ) ergs/cm2
Time-resolved spectra
Distribution
T90 vs. Hardness ratio plot
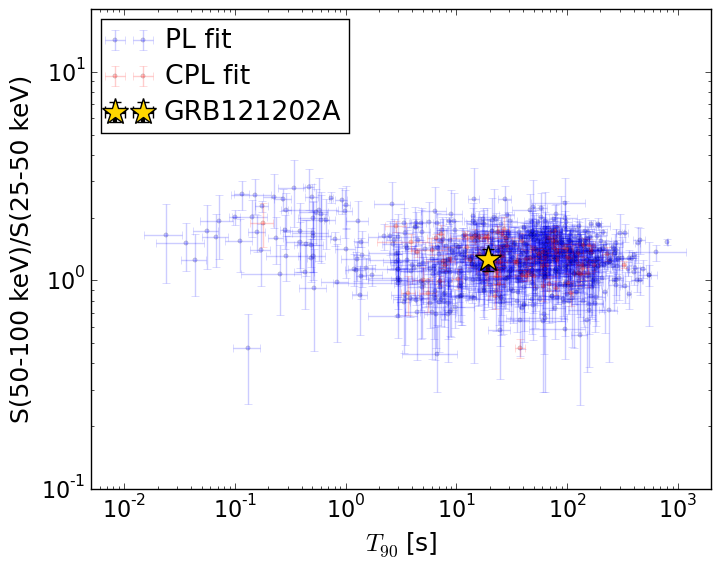
T90                                   = 19.536 sec.
Hardness ratio (energy fluence ratio) = 1.26255470893
S(15-50 keV) vs. S(50-150 keV) plot
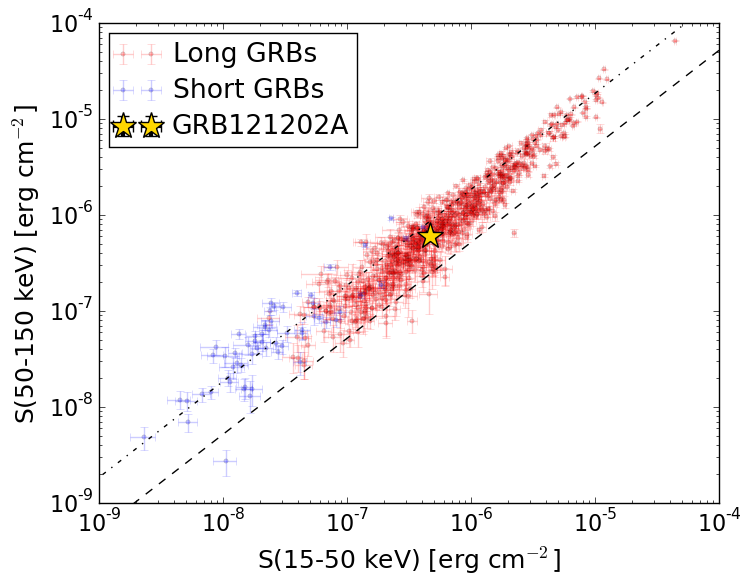
S(15-50 keV)  = 4.651463e-07
S(50-150 keV) = 5.985486e-07
The dash-dotted line and the dashed line traces the fluences calculated from the Band function with Epeak = 15 and 150 keV, respectively. Both lines assume a canonical values of alpha = -1 and beta = -2.5.
Mask shadow pattern
IMX = 5.920643393936137E-01, IMY = 2.936165033805292E-01
Spacecraft aspect plot
Bright source in the pre-burst/pre-slew/post-slew images
Pre-burst image of 15-350 keV band
Time interval of the image:
-239.976000 -2.184000

# RAcent  DECcent POSerr Theta    Phi  PeakCts   SNR AngSep     Name
#  [deg]    [deg]    ['] [deg]  [deg]                   [']
254.4080  35.3244    2.3  40.7  -11.3   1.4325   4.9    2.7	Her X-1
263.0475 -24.7270    4.8  41.0 -112.3   1.7881   2.5    2.4	GX 1+4
268.4151  -1.3110    2.8  21.6  -83.6   1.0060   4.2    9.0	SW J1753.5-0127
270.3478 -25.1413    3.9  37.6 -121.3   1.0884   3.0    5.1	GX 5-1
270.1528 -25.6617    9.5  38.2 -121.5  -0.4704  -1.2    9.5	GRS 1758-258
274.0789 -14.0757    3.5  26.3 -116.4   0.9047   3.3    4.9	GX 17+2
276.0487 -30.2940   52.2  40.3 -132.0  -0.0921  -0.2    7.8	H1820-303
285.1846 -24.8758    4.2  33.4 -143.4  -0.7281  -2.8    8.5	HT1900.1-2455
288.8083  10.9563    1.0   2.7   53.5   2.2776  11.1    0.9	GRS 1915+105
299.6169  35.0596   10.9  28.8   52.6  -0.3275  -1.0    8.6	Cyg X-1
308.2068  40.9625    3.5  37.2   58.0   1.7899   3.3    4.4	Cyg X-3
259.6815  55.6429    2.3  52.2   12.6   3.8313   5.0 ------	UNKNOWN
265.5120  31.3636    2.5  30.9   -6.8   1.1180   4.6 ------	UNKNOWN
Pre-slew background subtracted image of 15-350 keV band
Time interval of the image:
-2.184000 19.008000

# RAcent  DECcent POSerr Theta    Phi  PeakCts   SNR AngSep     Name
#  [deg]    [deg]    ['] [deg]  [deg]                   [']
254.3988  35.3151    2.4  40.7  -11.3  -0.4059  -4.8    3.3	Her X-1
262.8466 -24.6774   10.3  41.1 -112.0  -0.2119  -1.1    9.8	GX 1+4
268.1676  -1.4194    0.0  21.9  -83.5   0.0727   1.1   12.2	SW J1753.5-0127
270.2808 -25.0838   76.7  37.6 -121.2   0.0163   0.2    0.3	GX 5-1
270.3016 -25.7431   22.9  38.2 -121.7  -0.0573  -0.5    0.0	GRS 1758-258
273.7932 -13.9934    0.0  26.4 -115.8   0.1839   2.6   12.6	GX 17+2
275.9953 -30.2248    3.4  40.3 -131.9  -0.3558  -3.4    9.3	H1820-303
285.1251 -25.0383   25.2  33.6 -143.3  -0.0360  -0.5    8.6	HT1900.1-2455
288.7321  11.0085   35.1   2.8   51.6  -0.0184  -0.3    5.4	GRS 1915+105
299.6338  35.3689    5.1  29.1   52.4   0.1840   2.3   10.3	Cyg X-1
308.2159  41.0736    7.4  37.3   58.0  -0.2256  -1.6    8.7	Cyg X-3
256.7965  23.9454    0.4  33.5  -26.4   1.9431  26.7 ------	UNKNOWN
Post-slew image of 15-350 keV band
Time interval of the image:
274.724600 706.124660

# RAcent  DECcent POSerr Theta    Phi  PeakCts   SNR AngSep     Name
#  [deg]    [deg]    ['] [deg]  [deg]                   [']
135.5270 -40.5599    1.1  39.3 -175.9   5.0375  10.3    0.3	Vela X-1
170.2584 -60.6234    3.1  34.5 -126.9   2.0408   3.7    1.7	Cen X-3
186.6576 -62.7596    2.4  37.4 -114.1   3.8598   4.7    0.6	GX 301-2
 93.4448 -47.9333    2.8  21.9  131.2   1.7461   4.2 ------	UNKNOWN
 11.9277 -50.6704    2.7  37.4   14.9   1.9882   4.2 ------	UNKNOWN
152.4143 -58.2977    0.4  30.4 -142.6  11.8023  30.2 ------	UNKNOWN
327.2431 -44.5140    3.0  57.1  -17.3   5.4795   3.8 ------	UNKNOWN