Analysis Summary
Notes:
- 1) No attempt has been made to eliminate the non-significant decimal places.
- 2) This batgrbproduct analysis is done using the HEASARC data.
- 3) This batgrbproduct analysis is using the flight position for the mask-weighting calculation.
======================================================================
                  BAT GRB EVENT DATA PROCESSING REPORT
    Process Script Ver: batgrbproduct v2.46
    Process Start Time: Sun Jan 12 22:43:53 EST 2014
             Host Name: batevent1
   Current Working Dir: /local/data/batevent/batevent_reproc/trigger541200
======================================================================

  Trigger: 00541200      Segment: 000

  BAT Trigger Time: 376926432.768   [s; MET]
      Trigger Stop: 376926434.816   [s; MET]
               UTC: 2012-12-11T13:47:02.795260    [includes UTCF correction]
       Where From?: TDRSS position message

  BAT
    RA: 195.544262597769   Dec: 30.1610171473832  [deg; J2000]

     Catalogged Source?: NO
     Point Source?:      YES
     GRB Indicated?:     YES    [ by BAT flight software ]
     Image S/N Ratio:    7.59
     Image Trigger?:     NO
     Rate S/N Ratio:     13.4536240470737  [ if not an image trigger ]
     Image S/N Ratio:    7.59

  Analysis Position:   [ source = BAT ]
    RA: 195.544262597769   Dec: 30.1610171473832  [deg; J2000]

  Refined Position:   [ source = BAT pre-slew burst ]
    RA: 195.544   Dec: 30.161  [deg; J2000]
        { 13h 02m 10.6s , +30d 09' 39.6" }
        +/- 2.50185808081 [arcmin] (estimated 90% radius based on SNR)
    SNR: 8.20783326529


  Angular difference between the analysis and refined position is 0.013662 arcmin

  Partial Coding Fraction: 0.2285156    [ including projection effects ]

  Duration
     T90: 182.695999920368 +/- 38.7314644051461
        Measured from: 1
                   to: 183.695999920368     [s; relative to TRIGTIME]
     T50: 47.6279999613762 +/- 23.898011380813
        Measured from: 120.727999985218
                   to: 168.355999946594     [s; relative to TRIGTIME]


  Fluence
     Peak Flux  (peak 1 second)
        Measured from: 1.06800001859665
                   to: 2.06800001859665     [s; relative to TRIGTIME]
     Total Fluence
        Measured from: -0.356000006198883
                   to: 196.772000014782     [s; relative to TRIGTIME]

             Band 1     Band 2     Band 3     Band 4
              15-25      25-50     50-100    100-350     keV
 Total     1.176068   1.080575   0.422906   0.053919
           0.104108   0.106804   0.092874   0.081457 [error]
 Peak      0.027647   0.042056   0.055976   0.023343
           0.013240   0.013189   0.012544   0.010036 [error]

     [ fluence units of on-axis counts / fully illuminated detector ]

======================================================================


====== Table of the duration information =============================

        Value   tstart    tstop
T100  197.128   -0.356  196.772
T90   182.696    1.000  183.696
T50    47.628  120.728  168.356
Peak    1.000    1.068    2.068


====== Spectral Analysis Summary =====================================

Model      : spectral model: simple power-law (PL) and cutoff power-law (CPL)
Ph_index   : photon index: E^{Ph_index}
Ph_90err   : 90% error of the photon index
Epeak      : Epeak in keV
Epeak_90err: 90% error of Epeak
Norm       : normalization at 50 keV in both the PL model and CPL model
Nomr_90err : 90% error of the normalization
chi2       : Chi-Squared
dof        : degree of freedo

=== Time-averaged spectral analysis ===
(Best model with acceptable fit: PL)

Model Ph_index Ph_90err_low Ph_90err_hi  Epeak  Epeak_90err_low  Epeak_90err_hi  Norm       Nomr_90err_low    Norm_90err_hi    chi2    dof
PL      -2.263    -0.266      0.243       -           -               -         6.76e-04     -1.23e-04          1.20e-04      55.160   57
CPL     -2.475    -0.280      0.893      182.006      N/A           N/A         5.21e-04        N/A               N/A         54.880   56


=== 1-s peak spectral analysis ===
(Best model with acceptable fit: PL)

Model Ph_index Ph_90err_low Ph_90err_hi  Epeak  Epeak_90err_low  Epeak_90err_hi  Norm       Nomr_90err_low    Norm_90err_hi    chi2    dof
PL      -0.944     -0.509     0.605       -           -               -         8.91e-03     -2.81e-03          2.63e-03      38.460   57
CPL     -0.867     -1.348    -1.142      827.540      N/A           N/A         9.69e-03        N/A               N/A         38.510   56


=== Fluence/Peak Flux Summary ===

              Model    Band1     Band2     Band3     Band4     Band5     Total
                       15-25     25-50    50-100    100-350    15-150    15-350    keV
Fluence         PL   3.50e-07  4.06e-07  3.38e-07  4.75e-07  1.27e-06  1.57e-06   erg/cm2
      90%_error_low -5.26e-08 -5.06e-08 -8.23e-08 -1.92e-07 -1.85e-07 -3.05e-07   erg/cm2
      90%_error_hi   5.35e-08  4.96e-08  8.69e-08  2.67e-07  1.92e-07  3.63e-07   erg/cm2
Peak flux       PL   2.16e-01  3.03e-01  3.15e-01  6.01e-01  1.02e+00  1.43e+00   ph/cm2/s
      90%_error_low -1.26e-01 -1.26e-01 -9.07e-02 -3.11e-01 -3.11e-01 -4.13e-01   ph/cm2/s
      90%_error_hi   1.61e-01  1.20e-01  8.94e-02  5.13e-01  3.16e-01  4.48e-01   ph/cm2/s

Fluence        CPL   3.47e-07  3.70e-07  2.92e-07  4.63e-07  1.16e-06  1.47e-06   erg/cm2
      90%_error_low -5.71e-08 -1.28e-07 -1.65e-07 -3.45e-07 -4.19e-07 -6.56e-07   erg/cm2
      90%_error_hi   5.59e-08  7.87e-08  1.32e-07  3.84e-07  3.03e-07  5.67e-07   erg/cm2
Peak flux      CPL   2.27e-01  3.00e-01  3.08e-01  6.88e-01  1.03e+00  1.54e+00   ph/cm2/s
      90%_error_low     N/A       N/A   -9.50e-02     N/A   -3.57e-01 -8.11e-01   ph/cm2/s
      90%_error_hi      N/A       N/A    1.27e-01     N/A    3.43e-01  4.60e-01   ph/cm2/s

======================================================================
Image
Pre-slew 25.0-100.0 keV image (Event data)
#RAcent DECcent POSerr Theta  Phi  Peak_Cts  SNR Name
195.544 30.161 0.000 33.426 87.274 0.221 8.208 TRIG_00541200

Image time interval: 0.000 to 2.048 [sec]
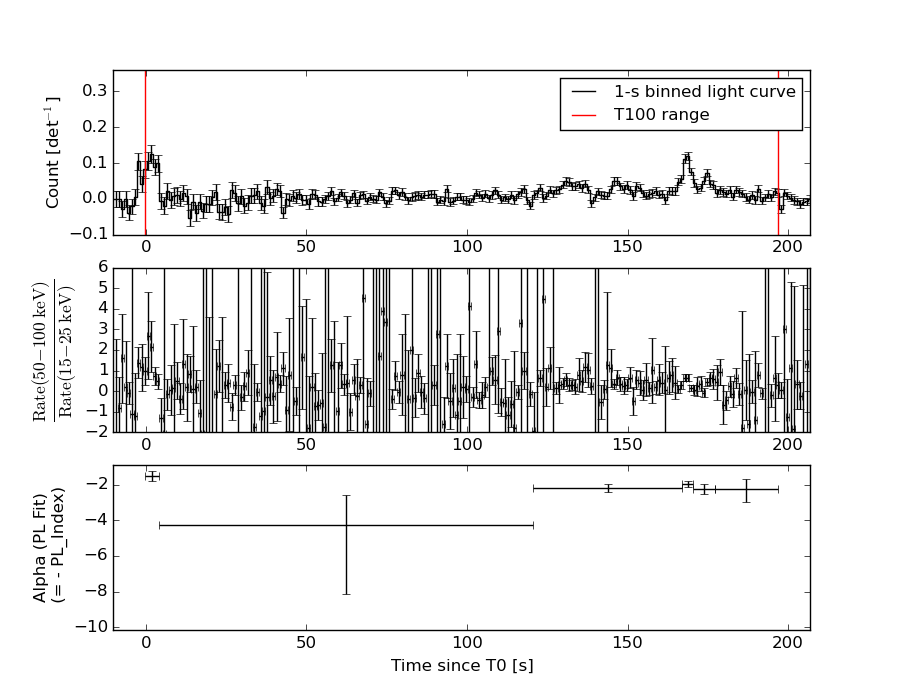
Light Curves
Note: The mask-weighted lightcurves have units of either count/det or counts/sec/det, where a det is 0.4 x 0.4 = 0.16 sq cm.
Full-time range; 1 s binning
Other quick-look light curves:
- 64 ms binning (zoomed)
- 16 ms binning (zoomed)
- 8 ms binning (zoomed)
- 2 ms binning (zoomed)
- SN=5 or 10 s binning (full-time range)
- Raw light curve
Spectra
- 64 ms binning (zoomed)
- 16 ms binning (zoomed)
- 8 ms binning (zoomed)
- 2 ms binning (zoomed)
- SN=5 or 10 s binning (full-time range)
- Raw light curve
Spectra
Notes:
- 1) The fitting includes the systematic errors.
- 2) When the burst includes telescope slew time periods, the fitting uses an average response file made from multiple 5-s response files through out the slew time plus single time preiod for the non-slew times, and weighted by the total counts in the corresponding time period using addrmf. An average response file is needed becuase a spectral fit using the pre-slew DRM will introduce some errors in both a spectral shape and a normalization if the PHA file contains a lot of the slew/post-slew time interval.
- 3) For fits to more complicated models (e.g. a power-law over a cutoff power-law), the BAT team has decided to require a chi-square improvement of more than 6 for each extra dof.
Time averaged spectrum fit using the average DRM
Power-law model
Time interval is from   -0.356 sec. to  196.772 sec.

Spectral model in power-law:
------------------------------------------------------------
Parameters  : value       lower 90%   higher 90%
Photon index: -2.2626     ( -0.266289   0.24274 )
Norm@50keV  : 6.75964E-04    ( -0.000123053   0.000119639 )
------------------------------------------------------------
#Fit statistic : Chi-Squared =          55.16 using 59 PHA bins.
# Reduced chi-squared =         0.9677 for     57 degrees of freedom
# Null hypothesis probability =   5.443615e-01

Photon flux (15-150 keV)    in 197.1 sec: 0.115735 ( -0.013073  0.013072 ) ph/cm2/s
Energy fluence (15-150 keV)             : 1.26511e-06 ( -1.8495e-07  1.91817e-07 ) ergs/cm2
Cutoff power-law model
Time interval is from   -0.356 sec. to  196.772 sec.
Spectral model in the cutoff power-law:
------------------------------------------------------------
Parameters  : value       lower 90%   higher 90%
Photon index: -2.47482     ( -0.279909   0.892855 )
Epeak [keV] : 182.006      (   )
Norm@50keV  : 5.20563E-04    (     )
------------------------------------------------------------
#Fit statistic : Chi-Squared =          54.88 using 59 PHA bins.
# Reduced chi-squared =         0.9800 for     56 degrees of freedom
# Null hypothesis probability =   5.174077e-01

Photon flux (15-150 keV)    in 197.1 sec: 0.114557 ( -0.013104  0.012852 ) ph/cm2/s
Energy fluence (15-150 keV)             : 1.15973e-06 ( -4.19005e-07  3.03481e-07 ) ergs/cm2
1-s peak spectrum fit
Power-law model
Time interval is from    1.068 sec. to    2.068 sec.

Spectral model in power-law:
------------------------------------------------------------
Parameters  : value       lower 90%   higher 90%
Photon index: -0.943988     ( -0.509374   0.604905 )
Norm@50keV  : 8.91208E-03    ( -0.00280573   0.00263454 )
------------------------------------------------------------
#Fit statistic : Chi-Squared =          38.46 using 59 PHA bins.
# Reduced chi-squared =         0.6748 for     57 degrees of freedom
# Null hypothesis probability =   9.717057e-01

Photon flux (15-150 keV)    in 1 sec: 1.02372 ( -0.31055  0.31568 ) ph/cm2/s
Energy fluence (15-150 keV)             : 9.83671e-08 ( -2.82845e-08  2.84506e-08 ) ergs/cm2
Cutoff power-law model
Time interval is from    1.068 sec. to    2.068 sec.
Spectral model in the cutoff power-law:
------------------------------------------------------------
Parameters  : value       lower 90%   higher 90%
Photon index: -2.02142     ( -0.19299   0.0127621 )
Epeak [keV] : 7.46747      (   )
Norm@50keV  : 8.24931E-04    (     )
------------------------------------------------------------
#Fit statistic : Chi-Squared =          38.38 using 59 PHA bins.
# Reduced chi-squared =         0.6854 for     56 degrees of freedom
# Null hypothesis probability =   9.652697e-01

Photon flux (15-150 keV)    in 1 sec: 1.03270 ( -0.357477  0.34273 ) ph/cm2/s
Energy fluence (15-150 keV)             : 9.9049e-08 ( -3.26961e-08  2.63517e-08 ) ergs/cm2
Time-resolved spectra
Distribution
T90 vs. Hardness ratio plot
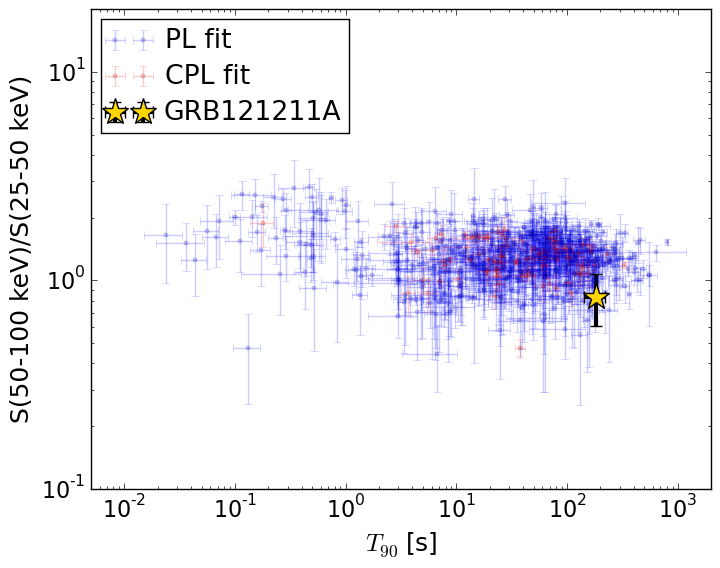
T90                                   = 182.696 sec.
Hardness ratio (energy fluence ratio) = 0.833623674487
S(15-50 keV) vs. S(50-150 keV) plot
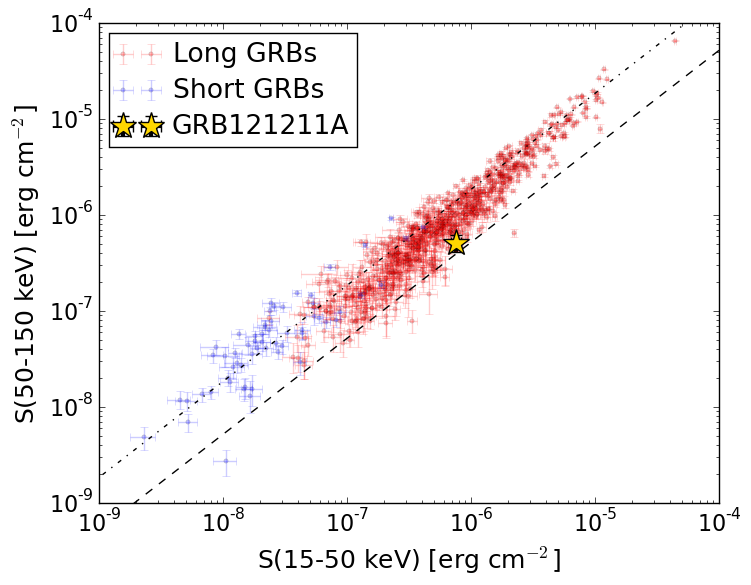
S(15-50 keV)  = 7.557607e-07
S(50-150 keV) = 5.093324e-07
The dash-dotted line and the dashed line traces the fluences calculated from the Band function with Epeak = 15 and 150 keV, respectively. Both lines assume a canonical values of alpha = -1 and beta = -2.5.
Mask shadow pattern
IMX = 0.031394799218, IMY = -0.659290200863
Spacecraft aspect plot
Bright source in the pre-burst/pre-slew/post-slew images
Pre-burst image of 15-350 keV band
Time interval of the image:
-239.768000 -0.356000

# RAcent  DECcent POSerr Theta    Phi  PeakCts   SNR AngSep     Name
#  [deg]    [deg]    ['] [deg]  [deg]                   [']
244.9674 -15.6370    0.3  32.6  -91.1  18.0561  39.0    0.7	Sco X-1
254.2263  35.3651  193.4  39.9  174.5  -0.0206  -0.1   11.4	Her X-1
268.3531  -1.4578  219.1  46.9 -128.0   0.0496   0.1    0.9	SW J1753.5-0127
177.9825   4.8088    3.2  44.2   40.9   2.4113   3.6 ------	UNKNOWN
203.8553 -20.0642    3.8  33.5  -15.0   0.8745   3.1 ------	UNKNOWN
204.9718 -45.3065    2.7  55.6  -32.9   5.6182   4.3 ------	UNKNOWN
Pre-slew background subtracted image of 15-350 keV band
Time interval of the image:
-0.356000 25.532600

# RAcent  DECcent POSerr Theta    Phi  PeakCts   SNR AngSep     Name
#  [deg]    [deg]    ['] [deg]  [deg]                   [']
245.0195 -15.4975   59.4  32.6  -91.3   0.0183   0.2    8.9	Sco X-1
254.5637  35.2795    5.2  40.1  174.8   0.1970   2.2    6.4	Her X-1
268.4048  -1.5389    6.3  46.9 -127.9  -0.4658  -1.8    5.6	SW J1753.5-0127
171.8189   0.0140    2.2  51.0   35.7   1.6027   5.1 ------	UNKNOWN
189.0346  -0.0520    2.4  34.2   30.2   0.4077   4.9 ------	UNKNOWN
232.4661   4.7609    2.0  10.6 -120.1   0.3091   5.7 ------	UNKNOWN
280.4415  31.6566    2.6  58.7 -170.0   1.5510   4.5 ------	UNKNOWN
258.5412  -2.8002    1.8  37.7 -122.4   0.6644   6.4 ------	UNKNOWN
Post-slew image of 15-350 keV band
Time interval of the image:
78.932600 689.432600

# RAcent  DECcent POSerr Theta    Phi  PeakCts   SNR AngSep     Name
#  [deg]    [deg]    ['] [deg]  [deg]                   [']
254.4086  35.2280   31.2  49.1 -145.6  -0.9836  -0.4    7.3	Her X-1
258.8724  62.5431    3.9  51.3  178.5   7.9874   3.0 ------	UNKNOWN
250.0149  61.1549    3.2  47.0  179.2   7.7435   3.6 ------	UNKNOWN
241.3202  54.0046    2.3  40.5 -172.9   7.6591   5.0 ------	UNKNOWN
184.0322 -24.2253    3.8  55.5  -20.5  10.2337   3.1 ------	UNKNOWN
267.2911  41.8996    3.7  57.5 -156.4  14.8599   3.1 ------	UNKNOWN
256.0568  34.1506    3.5  50.6 -144.6   9.7635   3.3 ------	UNKNOWN
188.4292 -28.2571    3.0  58.8  -26.0  24.0886   3.9 ------	UNKNOWN
194.9221 -25.4786    4.4  55.6  -32.6  14.7526   2.6 ------	UNKNOWN
232.8590   8.0481    4.2  41.3  -98.7  13.4539   2.8 ------	UNKNOWN