Analysis Summary
Notes:
- 1) No attempt has been made to eliminate the non-significant decimal places.
- 2) This batgrbproduct analysis is done using the HEASARC data.
- 3) This batgrbproduct analysis is using the flight position for the mask-weighting calculation.
======================================================================
                  BAT GRB EVENT DATA PROCESSING REPORT
    Process Script Ver: batgrbproduct v2.46
    Process Start Time: Sun Jan 12 22:29:40 EST 2014
             Host Name: batevent1
   Current Working Dir: /local/data/batevent/batevent_reproc/trigger544027
======================================================================

  Trigger: 00544027      Segment: 000

  BAT Trigger Time: 378241793.92   [s; MET]
      Trigger Stop: 378241794.944   [s; MET]
               UTC: 2012-12-26T19:09:43.890520    [includes UTCF correction]
       Where From?: TDRSS position message

  BAT
    RA: 168.657836545913   Dec: -30.4144824746842  [deg; J2000]

     Catalogged Source?: NO
     Point Source?:      YES
     GRB Indicated?:     YES    [ by BAT flight software ]
     Image S/N Ratio:    7.23
     Image Trigger?:     NO
     Rate S/N Ratio:     15.6843871413581  [ if not an image trigger ]
     Image S/N Ratio:    7.23

  Analysis Position:   [ source = BAT ]
    RA: 168.657836545913   Dec: -30.4144824746842  [deg; J2000]

  Refined Position:   [ source = BAT pre-slew burst ]
    RA: 168.619872955185   Dec: -30.4129687748913  [deg; J2000]
        { 11h 14m 28.8s , -30d 24' 46.7" }
         +/- 1.96270273044716 [arcmin] (estimated 90% radius based on SNR)
         +/- 1.13694808261099 [arcmin] (formal 1-sigma fit error)
    SNR: 11.6079297327899

  Angular difference between the analysis and refined position is 1.966469 arcmin

  Partial Coding Fraction: 0.359375    [ including projection effects ]

  Duration
     T90: 1.01199996471405 +/- 0.203214155154292
        Measured from: -0.304000020027161
                   to: 0.70799994468689     [s; relative to TRIGTIME]
     T50: 0.507999897003174 +/- 0.139713955893594
        Measured from: 0.00400000810623169
                   to: 0.511999905109406     [s; relative to TRIGTIME]


  Fluence
     Peak Flux  (peak 1 second)
        Measured from: -0.208000004291534
                   to: 0.791999995708466     [s; relative to TRIGTIME]
     Total Fluence
        Measured from: -0.364000022411346
                   to: 0.796000003814697     [s; relative to TRIGTIME]

             Band 1     Band 2     Band 3     Band 4
              15-25      25-50     50-100    100-350     keV
 Total     0.073028   0.065378   0.060557   0.038983
           0.010370   0.011505   0.010324   0.008311 [error]
 Peak      0.066487   0.057161   0.053113   0.039717
           0.009728   0.010711   0.009760   0.007704 [error]

     [ fluence units of on-axis counts / fully illuminated detector ]

======================================================================


====== Table of the duration information =============================

        Value   tstart    tstop
T100    1.160   -0.364    0.796
T90     1.012   -0.304    0.708
T50     0.508    0.004    0.512
Peak    1.000   -0.208    0.792


====== Spectral Analysis Summary =====================================

Model      : spectral model: simple power-law (PL) and cutoff power-law (CPL)
Ph_index   : photon index: E^{Ph_index}
Ph_90err   : 90% error of the photon index
Epeak      : Epeak in keV
Epeak_90err: 90% error of Epeak
Norm       : normalization at 50 keV in both the PL model and CPL model
Nomr_90err : 90% error of the normalization
chi2       : Chi-Squared
dof        : degree of freedo

=== Time-averaged spectral analysis ===
(Best model with acceptable fit: PL)

Model Ph_index Ph_90err_low Ph_90err_hi  Epeak  Epeak_90err_low  Epeak_90err_hi  Norm       Nomr_90err_low    Norm_90err_hi    chi2    dof
PL      -1.504    -0.290      0.289       -           -               -         1.29e-02     -2.05e-03          2.04e-03      67.390   57
CPL     -1.518    -0.275      0.309     9999.360    -9999.360      -9999.360      1.29e-02     -2.04e-03          8.72e-03      67.410   56


=== 1-s peak spectral analysis ===
(Best model with acceptable fit: PL)

Model Ph_index Ph_90err_low Ph_90err_hi  Epeak  Epeak_90err_low  Epeak_90err_hi  Norm       Nomr_90err_low    Norm_90err_hi    chi2    dof
PL      -1.469     -0.305     0.307       -           -               -         1.35e-02     -2.23e-03          2.22e-03      56.840   57
CPL     -1.484     -0.290     0.512     9999.360    -9999.360      -9999.360      1.34e-02     -2.14e-03          9.64e-03      56.870   56


=== Fluence/Peak Flux Summary ===

              Model    Band1     Band2     Band3     Band4     Band5     Total
                       15-25     25-50    50-100    100-350    15-150    15-350    keV
Fluence         PL   1.92e-08  3.52e-08  4.96e-08  1.47e-07  1.42e-07  2.51e-07   erg/cm2
      90%_error_low -5.35e-09 -6.12e-09 -1.02e-08 -5.67e-08 -2.43e-08 -6.56e-08   erg/cm2
      90%_error_hi   5.72e-09  5.96e-09  9.93e-09  7.68e-08  2.44e-08  8.10e-08   erg/cm2
Peak flux       PL   5.38e-01  5.51e-01  3.98e-01  4.60e-01  1.67e+00  1.95e+00   ph/cm2/s
      90%_error_low -1.61e-01 -1.05e-01 -8.21e-02 -1.74e-01 -2.88e-01 -3.21e-01   ph/cm2/s
      90%_error_hi   1.75e-01  1.02e-01  7.95e-02  2.28e-01  2.89e-01  3.23e-01   ph/cm2/s

Fluence        CPL   1.70e-08  2.38e-08  2.59e-08  6.42e-08  8.38e-08  1.31e-07   erg/cm2
      90%_error_low -1.14e-08 -1.11e-08 -1.16e-08 -1.20e-08 -3.80e-08 -4.85e-08   erg/cm2
      90%_error_hi   1.26e-09  7.36e-09  6.30e-09  8.72e-09  2.18e-08  2.38e-08   erg/cm2
Peak flux      CPL   4.30e-01  2.60e-01  1.05e-01  7.86e-02  8.26e-01  8.54e-01   ph/cm2/s
      90%_error_low -2.26e-01 -1.45e-01 -6.15e-02 -7.86e-02 -4.39e-01 -4.58e-01   ph/cm2/s
      90%_error_hi   2.22e-01  2.32e-01  7.98e-02  7.94e-02  6.73e-01  1.45e+00   ph/cm2/s

======================================================================
Image
Pre-slew 15.0-350.0 keV image (Event data)
#   RAcent    DECcent   POSerr    Theta     Phi              Peak Cts       SNR   Name
  168.6199   -30.4130   0.0164    47.4554   -14.6502         0.2510439     11.608 TRIG_00544027

Foreground time interval of the image:
 -0.364   0.796 (delta_t =   1.160 [sec])
Background time interval of the image:
-239.920  -0.364 (delta_t = 239.556 [sec])
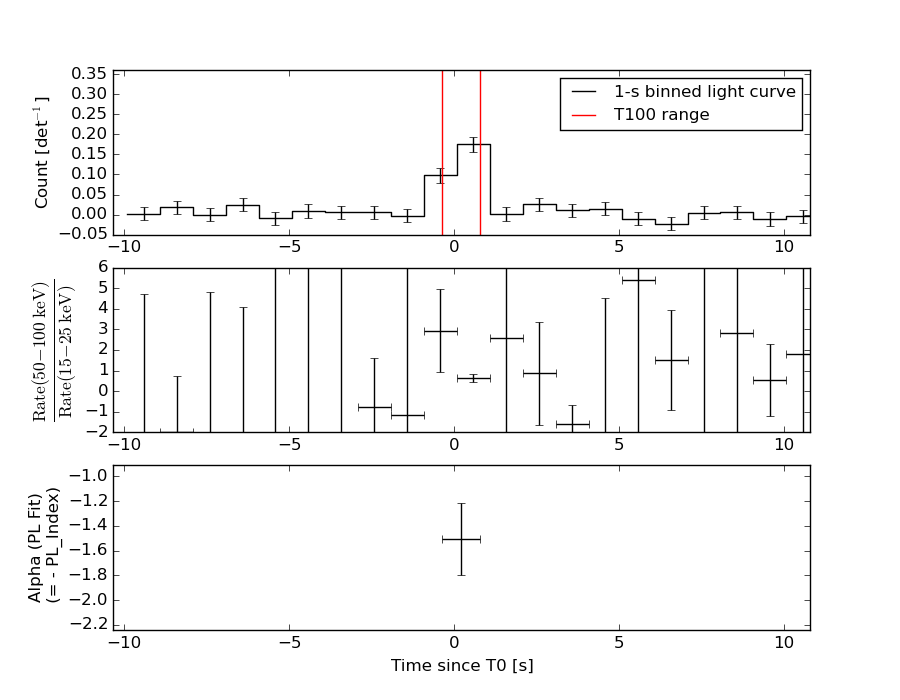
Light Curves
Note: The mask-weighted lightcurves have units of either count/det or counts/sec/det, where a det is 0.4 x 0.4 = 0.16 sq cm.
Full-time range; 1 s binning
Other quick-look light curves:
- 64 ms binning (zoomed)
- 16 ms binning (zoomed)
- 8 ms binning (zoomed)
- 2 ms binning (zoomed)
- SN=5 or 10 s binning (full-time range)
- Raw light curve
Spectra
- 64 ms binning (zoomed)
- 16 ms binning (zoomed)
- 8 ms binning (zoomed)
- 2 ms binning (zoomed)
- SN=5 or 10 s binning (full-time range)
- Raw light curve
Spectra
Notes:
- 1) The fitting includes the systematic errors.
- 2) When the burst includes telescope slew time periods, the fitting uses an average response file made from multiple 5-s response files through out the slew time plus single time preiod for the non-slew times, and weighted by the total counts in the corresponding time period using addrmf. An average response file is needed becuase a spectral fit using the pre-slew DRM will introduce some errors in both a spectral shape and a normalization if the PHA file contains a lot of the slew/post-slew time interval.
- 3) For fits to more complicated models (e.g. a power-law over a cutoff power-law), the BAT team has decided to require a chi-square improvement of more than 6 for each extra dof.
Time averaged spectrum fit using the average DRM
Power-law model

Time interval is from   -0.364 sec. to    0.796 sec.

Spectral model in power-law:
------------------------------------------------------------
Parameters  : value       lower 90%   higher 90%
Photon index: -1.50354     ( -0.289525   0.289473 )
Norm@50keV  : 1.29155E-02    ( -0.00205451   0.0020439 )
------------------------------------------------------------
#Fit statistic : Chi-Squared =          67.39 using 59 PHA bins.
# Reduced chi-squared =          1.182 for     57 degrees of freedom
# Null hypothesis probability =   1.633144e-01

Photon flux (15-150 keV)    in 1.16 sec: 1.61394 ( -0.26622  0.26733 ) ph/cm2/s
Energy fluence (15-150 keV)             : 1.42062e-07 ( -2.4326e-08  2.44473e-08 ) ergs/cm2
Cutoff power-law model
Time interval is from   -0.364 sec. to    0.796 sec.
Spectral model in the cutoff power-law:
------------------------------------------------------------
Parameters  : value       lower 90%   higher 90%
Photon index: -1.51789     ( -0.276422   0.307599 )
Epeak [keV] : 9999.36      ( -9999.36 -9999.36 )
Norm@50keV  : 1.29286E-02    ( -0.00204851   0.00871411 )
------------------------------------------------------------
#Fit statistic : Chi-Squared =          67.41 using 59 PHA bins.
# Reduced chi-squared =          1.204 for     56 degrees of freedom
# Null hypothesis probability =   1.412953e-01

Photon flux (15-150 keV)    in 1.16 sec: 0.847367 (    ) ph/cm2/s
Energy fluence (15-150 keV)             : 8.37853e-08 ( -3.80262e-08  2.17646e-08 ) ergs/cm2
1-s peak spectrum fit
Power-law model

Time interval is from   -0.208 sec. to    0.792 sec.

Spectral model in power-law:
------------------------------------------------------------
Parameters  : value       lower 90%   higher 90%
Photon index: -1.46916     ( -0.305271   0.306643 )
Norm@50keV  : 1.34529E-02    ( -0.00223013   0.00222174 )
------------------------------------------------------------
#Fit statistic : Chi-Squared =          56.84 using 59 PHA bins.
# Reduced chi-squared =         0.9973 for     57 degrees of freedom
# Null hypothesis probability =   4.809236e-01

Photon flux (15-150 keV)    in 1 sec: 1.66595 ( -0.28814  0.28949 ) ph/cm2/s
Energy fluence (15-150 keV)             : 1.28307e-07 ( -2.30018e-08  2.31154e-08 ) ergs/cm2
Cutoff power-law model
Time interval is from   -0.208 sec. to    0.792 sec.
Spectral model in the cutoff power-law:
------------------------------------------------------------
Parameters  : value       lower 90%   higher 90%
Photon index: -1.48447     ( -0.291489   0.510708 )
Epeak [keV] : 9999.36      ( -9999.36 -9999.36 )
Norm@50keV  : 1.33871E-02    ( -0.00222605   0.0095512 )
------------------------------------------------------------
#Fit statistic : Chi-Squared =          56.87 using 59 PHA bins.
# Reduced chi-squared =          1.016 for     56 degrees of freedom
# Null hypothesis probability =   4.424366e-01

Photon flux (15-150 keV)    in 1 sec: 0.825736 ( -0.439486  0.673284 ) ph/cm2/s
Energy fluence (15-150 keV)             : 7.11197e-08 ( -3.57004e-08  2.14673e-08 ) ergs/cm2
Time-resolved spectra
Distribution
T90 vs. Hardness ratio plot
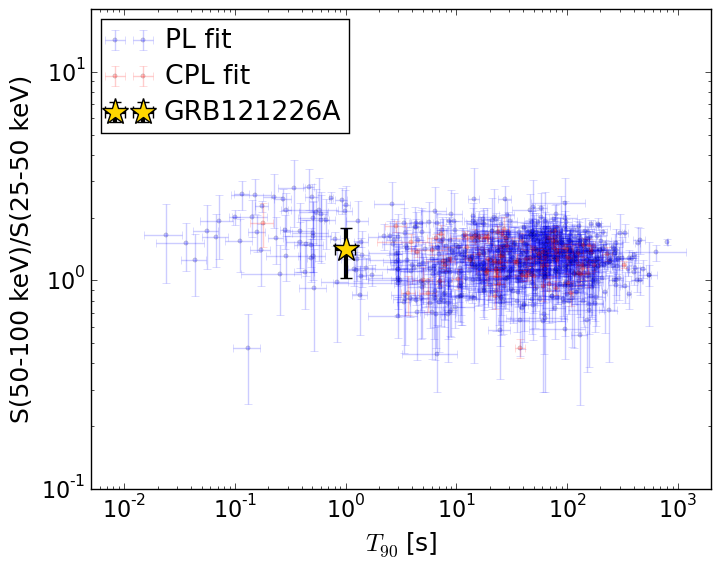
T90                                   = 1.012 sec.
Hardness ratio (energy fluence ratio) = 1.4107823286
S(15-50 keV) vs. S(50-150 keV) plot
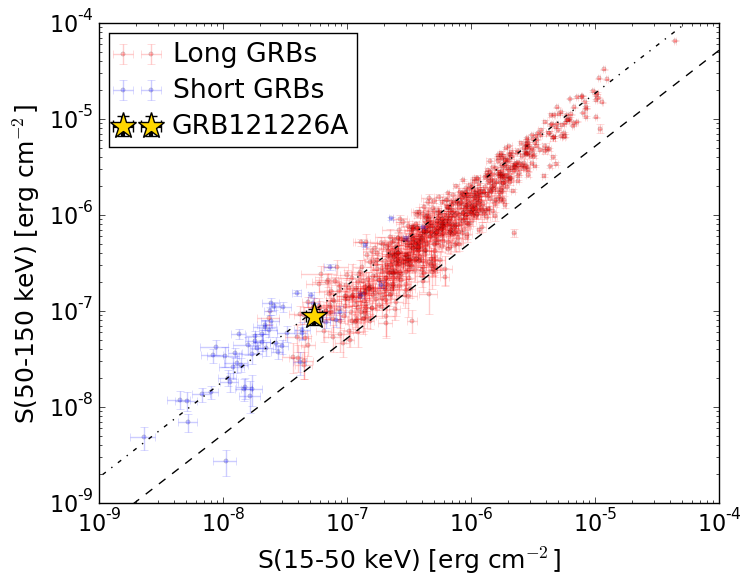
S(15-50 keV)  = 5.438725e-08
S(50-150 keV) = 8.767387e-08
The dash-dotted line and the dashed line traces the fluences calculated from the Band function with Epeak = 15 and 150 keV, respectively. Both lines assume a canonical values of alpha = -1 and beta = -2.5.
Mask shadow pattern
IMX = 1.054177635931437E+00, IMY = 2.755788578305471E-01
Spacecraft aspect plot
Bright source in the pre-burst/pre-slew/post-slew images
Pre-burst image of 15-350 keV band
Time interval of the image:
-239.920000 -0.364000

# RAcent  DECcent POSerr Theta    Phi  PeakCts   SNR AngSep     Name
#  [deg]    [deg]    ['] [deg]  [deg]                   [']
124.3890   3.6443    2.8  40.4   67.0   2.5276   4.1 ------	UNKNOWN
143.7577 -10.1489    4.2  33.2   28.6   0.6230   2.8 ------	UNKNOWN
163.1025  42.1210    2.8  25.4  171.1   0.7106   4.1 ------	UNKNOWN
216.2534  59.8671    3.3  57.4 -160.1   2.8886   3.5 ------	UNKNOWN
Pre-slew background subtracted image of 15-350 keV band
Time interval of the image:
-0.364000 0.796000

# RAcent  DECcent POSerr Theta    Phi  PeakCts   SNR AngSep     Name
#  [deg]    [deg]    ['] [deg]  [deg]                   [']
125.3233  30.6914    2.5  37.3  110.5   0.1205   4.5 ------	UNKNOWN
156.9944 -32.7443    2.4  49.9   -1.5   0.1185   4.7 ------	UNKNOWN
168.6199 -30.4130    1.0  47.5  -14.7   0.2511  11.6 ------	UNKNOWN
216.3456  62.3988    2.3  58.5 -162.8   0.2839   5.0 ------	UNKNOWN
Post-slew image of 15-350 keV band
Time interval of the image:
84.380590 850.680590

# RAcent  DECcent POSerr Theta    Phi  PeakCts   SNR AngSep     Name
#  [deg]    [deg]    ['] [deg]  [deg]                   [']
135.4862 -40.5738    2.3  28.6   31.6   2.8298   5.1    2.2	Vela X-1
170.3884 -60.7970   18.0  30.4  -30.2   0.3180   0.6   10.7	Cen X-3
186.6787 -62.7789    0.6  34.4  -43.0  10.0087  17.9    0.8	GX 301-2
 99.1702 -52.1340    3.5  54.2   16.7   8.3702   3.3 ------	UNKNOWN
123.4099 -58.7572    3.3  41.6    5.2   2.2411   3.6 ------	UNKNOWN
152.6216 -58.3417    2.1  30.0  -11.6   2.5677   5.4 ------	UNKNOWN
111.7145 -74.1780    3.2  52.0  -11.6   4.1899   3.6 ------	UNKNOWN
176.9814 -61.9745    2.3  32.0  -35.9   2.3622   5.0 ------	UNKNOWN
220.3736 -74.2808    3.8  50.8  -44.4   6.3457   3.0 ------	UNKNOWN