Analysis Summary
Notes:
- 1) No attempt has been made to eliminate the non-significant decimal places.
- 2) This batgrbproduct analysis is done using the HEASARC data.
- 3) This batgrbproduct analysis is using the flight position for the mask-weighting calculation.
======================================================================
                  BAT GRB EVENT DATA PROCESSING REPORT
    Process Script Ver: batgrbproduct v2.46
    Process Start Time: Sun Jan 12 22:22:21 EST 2014
             Host Name: batevent1
   Current Working Dir: /local/data/batevent/batevent_reproc/trigger544347
======================================================================

  Trigger: 00544347      Segment: 000

  BAT Trigger Time: 378450032   [s; MET]
      Trigger Stop: 378450096   [s; MET]
               UTC: 2012-12-29T05:00:21.961480    [includes UTCF correction]
       Where From?: TDRSS position message

  BAT
    RA: 190.100258521476   Dec: -50.5938550502162  [deg; J2000]

     Catalogged Source?: NO
     Point Source?:      YES
     GRB Indicated?:     YES    [ by BAT flight software ]
     Image S/N Ratio:    7.31
     Image Trigger?:     YES
     Rate S/N Ratio:     0  [ if not an image trigger ]
     Image S/N Ratio:    7.31

  Analysis Position:   [ source = BAT ]
    RA: 190.100258521476   Dec: -50.5938550502162  [deg; J2000]

  Refined Position:   [ source = BAT pre-slew burst ]
    RA: 190.1   Dec: -50.5939  [deg; J2000]
        { 12h 40m 24.0s , -50d -35' -38.0" }
        +/- 2.70202144597 [arcmin] (estimated 90% radius based on SNR)
    SNR: 7.35320923246


  Angular difference between the analysis and refined position is 0.010209 arcmin

  Partial Coding Fraction: 0.3945312    [ including projection effects ]

  Duration
     T90: 111.459999978542 +/- 41.3259519844239
        Measured from: -48.9200000166893
                   to: 62.539999961853     [s; relative to TRIGTIME]
     T50: 56.0039999485016 +/- 35.0842760064695
        Measured from: -20.5120000243187
                   to: 35.4919999241829     [s; relative to TRIGTIME]


  Fluence
     Peak Flux  (peak 1 second)
        Measured from: -49.7519999742508
                   to: -48.7519999742508     [s; relative to TRIGTIME]
     Total Fluence
        Measured from: -81.6679999828339
                   to: 64.8080000281334     [s; relative to TRIGTIME]

             Band 1     Band 2     Band 3     Band 4
              15-25      25-50     50-100    100-350     keV
 Total     0.588626   0.616362   0.256606  -0.000885
           0.102400   0.105848   0.094367   0.084785 [error]
 Peak      0.015374   0.015576   0.012476   0.014527
           0.008467   0.008979   0.007759   0.007037 [error]

     [ fluence units of on-axis counts / fully illuminated detector ]

======================================================================


====== Table of the duration information =============================

        Value   tstart    tstop
T100  146.476  -81.668   64.808
T90   111.460  -48.920   62.540
T50    56.004  -20.512   35.492
Peak    1.000  -49.752  -48.752


====== Spectral Analysis Summary =====================================

Model      : spectral model: simple power-law (PL) and cutoff power-law (CPL)
Ph_index   : photon index: E^{Ph_index}
Ph_90err   : 90% error of the photon index
Epeak      : Epeak in keV
Epeak_90err: 90% error of Epeak
Norm       : normalization at 50 keV in both the PL model and CPL model
Nomr_90err : 90% error of the normalization
chi2       : Chi-Squared
dof        : degree of freedo

=== Time-averaged spectral analysis ===
(Best model with acceptable fit: PL)

Model Ph_index Ph_90err_low Ph_90err_hi  Epeak  Epeak_90err_low  Epeak_90err_hi  Norm       Nomr_90err_low    Norm_90err_hi    chi2    dof
PL      -2.273    -0.418      0.360       -           -               -         6.03e-04     -1.72e-04          1.66e-04      59.980   57
CPL     -1.316    -0.763      2.381       27.554      N/A           N/A         2.30e-03        N/A               N/A         58.860   56


=== 1-s peak spectral analysis ===
(Best model with acceptable fit: N/A)

Model Ph_index Ph_90err_low Ph_90err_hi  Epeak  Epeak_90err_low  Epeak_90err_hi  Norm       Nomr_90err_low    Norm_90err_hi    chi2    dof
PL      -1.353     -1.079     1.585       -           -               -         3.59e-03     -3.59e-03          1.79e-03      56.870   57
CPL     -1.396     -1.298     1.646     9999.340    -9999.340      -9999.340      3.56e-03        N/A               N/A         56.880   56


=== Fluence/Peak Flux Summary ===

              Model    Band1     Band2     Band3     Band4     Band5     Total
                       15-25     25-50    50-100    100-350    15-150    15-350    keV
Fluence         PL   2.34e-07  2.70e-07  2.23e-07  3.11e-07  8.40e-07  1.04e-06   erg/cm2
      90%_error_low -5.74e-08 -5.59e-08 -8.20e-08 -1.75e-07 -1.95e-07 -3.02e-07   erg/cm2
      90%_error_hi   5.92e-08  5.48e-08  8.82e-08  2.81e-07  2.03e-07  3.79e-07   erg/cm2
Peak flux       PL   1.28e-01  1.41e-01  1.10e-01  1.43e-01  4.33e-01  5.22e-01   ph/cm2/s
      90%_error_low -1.28e-01 -1.41e-01 -1.10e-01 -1.43e-01 -4.33e-01 -2.60e-01   ph/cm2/s
      90%_error_hi   1.55e-01  8.42e-02  6.20e-02  4.28e-01  2.38e-01  9.32e-01   ph/cm2/s

Fluence        CPL   2.22e-07  3.02e-07  2.03e-07  6.64e-08  7.75e-07  7.93e-07   erg/cm2
      90%_error_low -6.38e-08    N/A    -1.17e-07    N/A    -1.99e-07 -2.16e-07   erg/cm2
      90%_error_hi   6.36e-08    N/A     1.03e-07    N/A     2.25e-07  5.76e-07   erg/cm2
Peak flux      CPL   1.29e-01  1.41e-01  1.07e-01  3.68e-02  4.41e-01  5.33e-01   ph/cm2/s
      90%_error_low     N/A   -1.41e-01     N/A   -3.68e-02 -4.41e-01 -2.75e-01   ph/cm2/s
      90%_error_hi      N/A    1.11e-01     N/A    3.00e-02  2.34e-01  2.44e-01   ph/cm2/s

======================================================================
Image
Pre-slew 15.0-50.0 keV image (Event data)
#RAcent DECcent POSerr Theta  Phi  Peak_Cts  SNR Name
190.100 -50.594 0.000 46.761 -11.874 0.761 7.353 TRIG_00544347

Image time interval: 0.000 to 64.000 [sec]
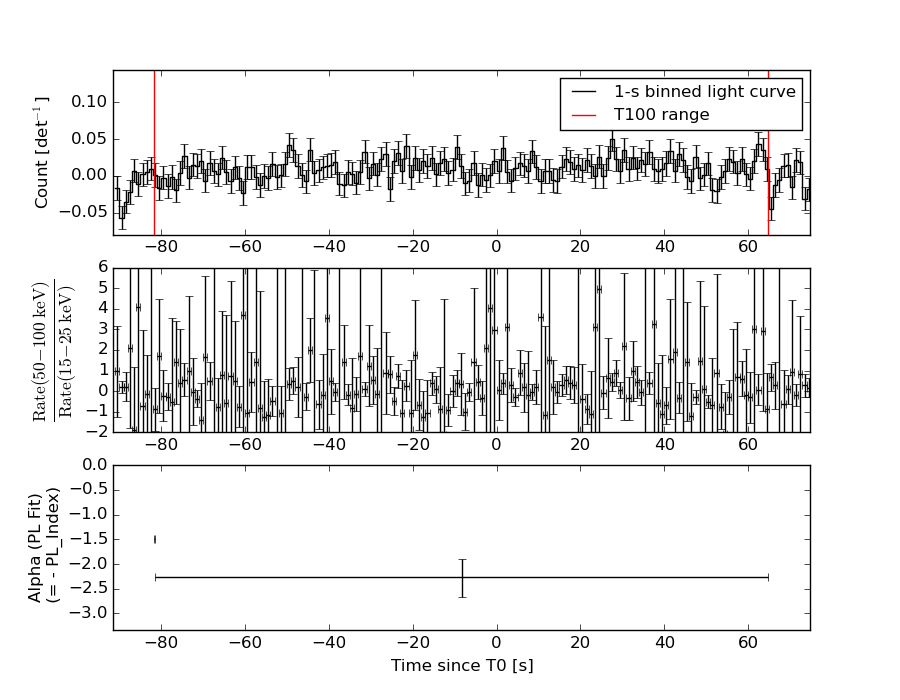
Light Curves
Note: The mask-weighted lightcurves have units of either count/det or counts/sec/det, where a det is 0.4 x 0.4 = 0.16 sq cm.
Full-time range; 1 s binning
Other quick-look light curves:
- 64 ms binning (zoomed)
- 16 ms binning (zoomed)
- 8 ms binning (zoomed)
- 2 ms binning (zoomed)
- SN=5 or 10 s binning (full-time range)
- Raw light curve
Spectra
- 64 ms binning (zoomed)
- 16 ms binning (zoomed)
- 8 ms binning (zoomed)
- 2 ms binning (zoomed)
- SN=5 or 10 s binning (full-time range)
- Raw light curve
Spectra
Notes:
- 1) The fitting includes the systematic errors.
- 2) When the burst includes telescope slew time periods, the fitting uses an average response file made from multiple 5-s response files through out the slew time plus single time preiod for the non-slew times, and weighted by the total counts in the corresponding time period using addrmf. An average response file is needed becuase a spectral fit using the pre-slew DRM will introduce some errors in both a spectral shape and a normalization if the PHA file contains a lot of the slew/post-slew time interval.
- 3) For fits to more complicated models (e.g. a power-law over a cutoff power-law), the BAT team has decided to require a chi-square improvement of more than 6 for each extra dof.
Time averaged spectrum fit using the average DRM
Power-law model
Time interval is from  -81.668 sec. to   64.808 sec.

Spectral model in power-law:
------------------------------------------------------------
Parameters  : value       lower 90%   higher 90%
Photon index: -2.27276     ( -0.417668   0.360417 )
Norm@50keV  : 6.02974E-04    ( -0.000172336   0.000166365 )
------------------------------------------------------------
#Fit statistic : Chi-Squared =          59.98 using 59 PHA bins.
# Reduced chi-squared =          1.052 for     57 degrees of freedom
# Null hypothesis probability =   3.680674e-01

Photon flux (15-150 keV)    in 146.5 sec: 0.103813 ( -0.0200045  0.020005 ) ph/cm2/s
Energy fluence (15-150 keV)             : 8.40229e-07 ( -1.94876e-07  2.03452e-07 ) ergs/cm2
Cutoff power-law model
Time interval is from  -81.668 sec. to   64.808 sec.
Spectral model in the cutoff power-law:
------------------------------------------------------------
Parameters  : value       lower 90%   higher 90%
Photon index: -1.31625     ( -0.762892   2.38053 )
Epeak [keV] : 27.5540      (   )
Norm@50keV  : 2.29959E-03    (     )
------------------------------------------------------------
#Fit statistic : Chi-Squared =          58.86 using 59 PHA bins.
# Reduced chi-squared =          1.051 for     56 degrees of freedom
# Null hypothesis probability =   3.712441e-01

Photon flux (15-150 keV)    in 146.5 sec: 0.101251 ( -0.0202655  0.020361 ) ph/cm2/s
Energy fluence (15-150 keV)             : 7.75404e-07 ( -1.98614e-07  2.25282e-07 ) ergs/cm2
1-s peak spectrum fit
Power-law model
Time interval is from  -49.752 sec. to  -48.752 sec.

Spectral model in power-law:
------------------------------------------------------------
Parameters  : value       lower 90%   higher 90%
Photon index: -1.35264     ( -1.07898   1.58497 )
Norm@50keV  : 3.59194E-03    ( -0.00359188   0.00178758 )
------------------------------------------------------------
#Fit statistic : Chi-Squared =          56.87 using 59 PHA bins.
# Reduced chi-squared =         0.9976 for     57 degrees of freedom
# Null hypothesis probability =   4.800957e-01

Photon flux (15-150 keV)    in 1 sec: 0.432916 ( -0.432916  0.238436 ) ph/cm2/s
Energy fluence (15-150 keV)             : 3.50687e-08 ( -1.85232e-08  1.87694e-08 ) ergs/cm2
Cutoff power-law model
Time interval is from  -49.752 sec. to  -48.752 sec.
Spectral model in the cutoff power-law:
------------------------------------------------------------
Parameters  : value       lower 90%   higher 90%
Photon index: -1.39617     ( -1.30032   1.64338 )
Epeak [keV] : 9999.34      ( -9999.36 -9999.36 )
Norm@50keV  : 3.55612E-03    (     )
------------------------------------------------------------
#Fit statistic : Chi-Squared =          56.87 using 59 PHA bins.
# Reduced chi-squared =          1.016 for     56 degrees of freedom
# Null hypothesis probability =   4.423000e-01

Photon flux (15-150 keV)    in 1 sec: 0.440531 ( -0.440531  0.234411 ) ph/cm2/s
Energy fluence (15-150 keV)             : 1.46265e-08 ( 0  0 ) ergs/cm2
Time-resolved spectra
Distribution
T90 vs. Hardness ratio plot
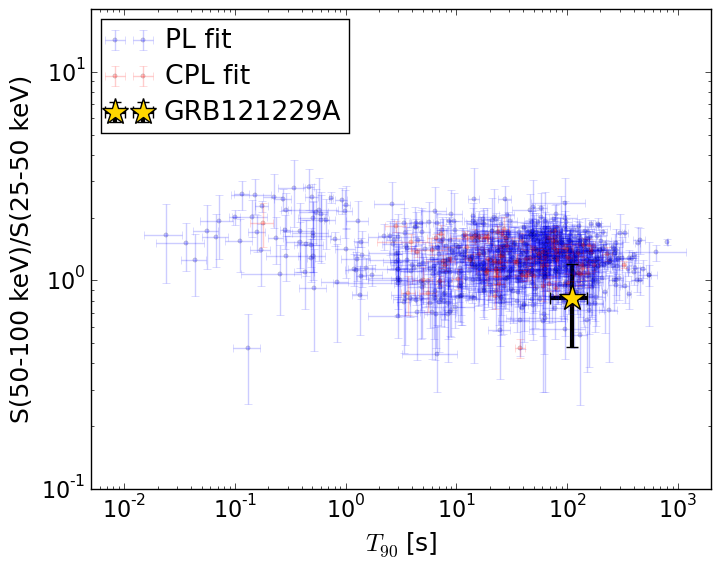
T90                                   = 111.46 sec.
Hardness ratio (energy fluence ratio) = 0.827789603595
S(15-50 keV) vs. S(50-150 keV) plot
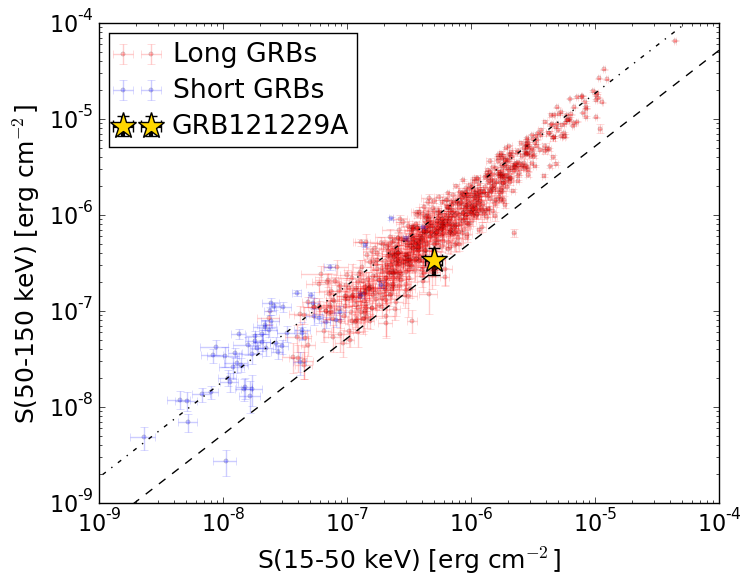
S(15-50 keV)  = 5.043244e-07
S(50-150 keV) = 3.359211e-07
The dash-dotted line and the dashed line traces the fluences calculated from the Band function with Epeak = 15 and 150 keV, respectively. Both lines assume a canonical values of alpha = -1 and beta = -2.5.
Mask shadow pattern
IMX = 1.04067554344, IMY = 0.218813653751
Spacecraft aspect plot
Bright source in the pre-burst/pre-slew/post-slew images
Pre-burst image of 15-350 keV band
Time interval of the image:
-239.000000 -81.668000

# RAcent  DECcent POSerr Theta    Phi  PeakCts   SNR AngSep     Name
#  [deg]    [deg]    ['] [deg]  [deg]                   [']
190.2549 -55.7770    2.7  51.9  -12.7   1.3468   4.2 ------	UNKNOWN
207.2234 -52.9096    3.1  50.0  -25.7   1.1644   3.7 ------	UNKNOWN
Pre-slew background subtracted image of 15-350 keV band
Time interval of the image:
-81.668000 64.808000

# RAcent  DECcent POSerr Theta    Phi  PeakCts   SNR AngSep     Name
#  [deg]    [deg]    ['] [deg]  [deg]                   [']
159.9629  15.9233    2.2  39.9  104.8   3.0019   5.1 ------	UNKNOWN
170.6407  -4.0121    2.8  24.2   73.1   0.8231   4.1 ------	UNKNOWN
191.4245  13.7812    2.8  18.1  153.1   0.6555   4.2 ------	UNKNOWN
181.6243 -41.6512    2.2  39.5   -0.4   1.1223   5.2 ------	UNKNOWN
Post-slew image of 15-350 keV band
Time interval of the image:
135.100600 696.600590

# RAcent  DECcent POSerr Theta    Phi  PeakCts   SNR AngSep     Name
#  [deg]    [deg]    ['] [deg]  [deg]                   [']
135.6297 -40.4453    9.8  38.6   69.6   1.3202   1.2    8.0	Vela X-1
170.2159 -60.4193  108.8  14.8   27.0  -0.0335  -0.1   12.6	Cen X-3
186.8366 -62.7413    1.7  12.3   -6.9   2.2936   6.7    5.2	GX 301-2
189.6647 -11.6281    2.7  39.0  165.4   2.2529   4.4 ------	UNKNOWN
194.2606 -54.8874    3.5   5.0  -42.8   1.0349   3.3 ------	UNKNOWN
210.9862 -52.5695    2.4  13.1  -87.2   1.5028   4.9 ------	UNKNOWN
356.7008 -70.3188    3.9  58.7  -19.2   5.7396   3.0 ------	UNKNOWN
296.2785 -65.8617    3.4  50.7  -44.4   5.7534   3.4 ------	UNKNOWN