Analysis Summary
Notes:
- 1) No attempt has been made to eliminate the non-significant decimal places.
- 2) This batgrbproduct analysis is done using the HEASARC data.
- 3) This batgrbproduct analysis is using the flight position for the mask-weighting calculation.
======================================================================
                  BAT GRB EVENT DATA PROCESSING REPORT
    Process Script Ver: batgrbproduct v2.46
    Process Start Time: Sun Jan 12 05:59:21 EST 2014
             Host Name: batevent1
   Current Working Dir: /local/data/batevent/batevent_reproc/trigger544784
======================================================================

  Trigger: 00544784      Segment: 000

  BAT Trigger Time: 378843064   [s; MET]
      Trigger Stop: 378843128   [s; MET]
               UTC: 2013-01-02T18:10:53.944400    [includes UTCF correction]
       Where From?: TDRSS position message

  BAT
    RA: 311.464423090679   Dec: 49.835123133839  [deg; J2000]

     Catalogged Source?: NO
     Point Source?:      YES
     GRB Indicated?:     YES    [ by BAT flight software ]
     Image S/N Ratio:    9.9
     Image Trigger?:     YES
     Rate S/N Ratio:     0  [ if not an image trigger ]
     Image S/N Ratio:    9.9

  Analysis Position:   [ source = BAT ]
    RA: 311.464423090679   Dec: 49.835123133839  [deg; J2000]

  Refined Position:   [ source = BAT pre-slew burst ]
    RA: 311.415781472512   Dec: 49.8294447612168  [deg; J2000]
        { 20h 45m 39.8s , +49d 49' 46.0" }
         +/- 2.29152214228455 [arcmin] (estimated 90% radius based on SNR)
         +/- 1.19118543971485 [arcmin] (formal 1-sigma fit error)
    SNR: 9.30369447055616

  Angular difference between the analysis and refined position is 1.913092 arcmin

  Partial Coding Fraction: 0.9921875    [ including projection effects ]

  Duration
     T90: 132.77999997139 +/- 17.7711381552947
        Measured from: 22.339999973774
                   to: 155.119999945164     [s; relative to TRIGTIME]
     T50: 71.3879999518394 +/- 44.1382417414895
        Measured from: 28.0239999890327
                   to: 99.4119999408722     [s; relative to TRIGTIME]


  Fluence
     Peak Flux  (peak 1 second)
        Measured from: 23.5320000052452
                   to: 24.5320000052452     [s; relative to TRIGTIME]
     Total Fluence
        Measured from: 15.3759999871254
                   to: 184.332000017166     [s; relative to TRIGTIME]

             Band 1     Band 2     Band 3     Band 4
              15-25      25-50     50-100    100-350     keV
 Total     0.410219   0.498311   0.466869   0.043131
           0.062264   0.063334   0.055639   0.049096 [error]
 Peak      0.012034   0.026223   0.009974   0.006073
           0.004794   0.004910   0.004427   0.003817 [error]

     [ fluence units of on-axis counts / fully illuminated detector ]

======================================================================


====== Table of the duration information =============================

        Value   tstart    tstop
T100  168.956   15.376  184.332
T90   132.780   22.340  155.120
T50    71.388   28.024   99.412
Peak    1.000   23.532   24.532


====== Spectral Analysis Summary =====================================

Model      : spectral model: simple power-law (PL) and cutoff power-law (CPL)
Ph_index   : photon index: E^{Ph_index}
Ph_90err   : 90% error of the photon index
Epeak      : Epeak in keV
Epeak_90err: 90% error of Epeak
Norm       : normalization at 50 keV in both the PL model and CPL model
Nomr_90err : 90% error of the normalization
chi2       : Chi-Squared
dof        : degree of freedo

=== Time-averaged spectral analysis ===
(Best model with acceptable fit: PL)

Model Ph_index Ph_90err_low Ph_90err_hi  Epeak  Epeak_90err_low  Epeak_90err_hi  Norm       Nomr_90err_low    Norm_90err_hi    chi2    dof
PL      -1.546    -0.224      0.217       -           -               -         5.26e-04     -7.21e-05          7.12e-05      53.940   57
CPL     -0.520    -0.913      1.166       71.991     -17.244       144.869      1.73e-03     -1.73e-03          4.57e-03      50.170   56


=== 1-s peak spectral analysis ===
(Best model with acceptable fit: PL)

Model Ph_index Ph_90err_low Ph_90err_hi  Epeak  Epeak_90err_low  Epeak_90err_hi  Norm       Nomr_90err_low    Norm_90err_hi    chi2    dof
PL      -1.646     -0.503     0.465       -           -               -         3.07e-03     -9.81e-04          9.44e-04      51.970   57
CPL     -0.028     -2.145     4.785       49.402      N/A           N/A         2.67e-02        N/A               N/A         50.840   56


=== Fluence/Peak Flux Summary ===

              Model    Band1     Band2     Band3     Band4     Band5     Total
                       15-25     25-50    50-100    100-350    15-150    15-350    keV
Fluence         PL   1.19e-07  2.12e-07  2.90e-07  8.23e-07  8.38e-07  1.44e-06   erg/cm2
      90%_error_low -2.34e-08 -2.75e-08 -5.22e-08 -2.71e-07 -1.24e-07 -3.24e-07   erg/cm2
      90%_error_hi   2.46e-08  2.74e-08  5.22e-08  3.47e-07  1.27e-07  3.86e-07   erg/cm2
Peak flux       PL   1.45e-01  1.34e-01  8.56e-02  8.41e-02  4.00e-01  4.49e-01   ph/cm2/s
      90%_error_low -5.59e-02 -3.67e-02 -3.41e-02 -5.06e-02 -1.09e-01 -1.27e-01   ph/cm2/s
      90%_error_hi   6.03e-02  3.67e-02  3.50e-02  8.38e-02  1.09e-01  1.31e-01   ph/cm2/s

Fluence        CPL   9.94e-08  2.34e-07  3.07e-07  2.41e-07  7.83e-07  8.81e-07   erg/cm2
      90%_error_low -2.97e-08 -3.39e-08 -5.93e-08 -1.51e-07 -1.28e-07 -2.00e-07   erg/cm2
      90%_error_hi   3.00e-08  3.53e-08  6.06e-08  4.63e-07  1.34e-07  4.65e-07   erg/cm2
Peak flux      CPL   1.25e-01  1.62e-01  7.82e-02  1.07e-02  3.75e-01  3.76e-01   ph/cm2/s
      90%_error_low -6.82e-02 -9.22e-02 -7.82e-02 -1.07e-02 -1.12e-01 -1.13e-01   ph/cm2/s
      90%_error_hi   6.90e-02  6.02e-02  4.42e-02  9.35e-02  1.16e-01  1.58e-01   ph/cm2/s

======================================================================
Image
Pre-slew 15.0-350.0 keV image (Event data)
#   RAcent    DECcent   POSerr    Theta     Phi              Peak Cts       SNR   Name
  311.4158    49.8294   0.0205     9.9963   -74.3773         0.8287199      9.304 TRIG_00544784

Foreground time interval of the image:
 15.376  73.501 (delta_t =  58.125 [sec])
Background time interval of the image:
-79.499  15.376 (delta_t =  94.875 [sec])
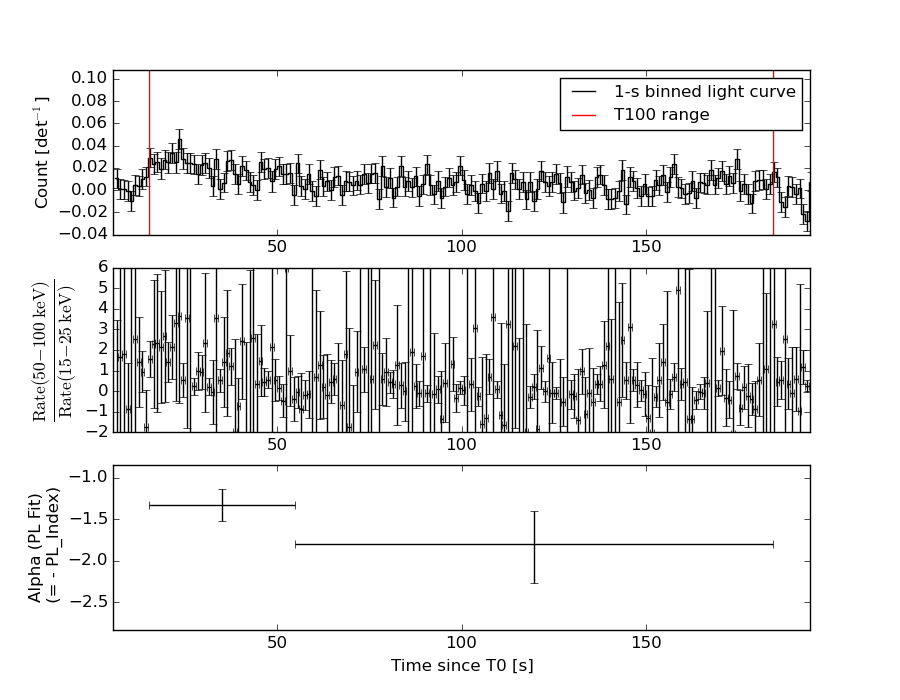
Light Curves
Note: The mask-weighted lightcurves have units of either count/det or counts/sec/det, where a det is 0.4 x 0.4 = 0.16 sq cm.
Full-time range; 1 s binning
Other quick-look light curves:
- 64 ms binning (zoomed)
- 16 ms binning (zoomed)
- 8 ms binning (zoomed)
- 2 ms binning (zoomed)
- SN=5 or 10 s binning (full-time range)
- Raw light curve
Spectra
- 64 ms binning (zoomed)
- 16 ms binning (zoomed)
- 8 ms binning (zoomed)
- 2 ms binning (zoomed)
- SN=5 or 10 s binning (full-time range)
- Raw light curve
Spectra
Notes:
- 1) The fitting includes the systematic errors.
- 2) When the burst includes telescope slew time periods, the fitting uses an average response file made from multiple 5-s response files through out the slew time plus single time preiod for the non-slew times, and weighted by the total counts in the corresponding time period using addrmf. An average response file is needed becuase a spectral fit using the pre-slew DRM will introduce some errors in both a spectral shape and a normalization if the PHA file contains a lot of the slew/post-slew time interval.
- 3) For fits to more complicated models (e.g. a power-law over a cutoff power-law), the BAT team has decided to require a chi-square improvement of more than 6 for each extra dof.
Time averaged spectrum fit using the average DRM
Power-law model
Time interval is from   15.376 sec. to  184.332 sec.

Spectral model in power-law:
------------------------------------------------------------
Parameters  : value       lower 90%   higher 90%
Photon index: -1.54628     ( -0.224206   0.217475 )
Norm@50keV  : 5.26418E-04    ( -7.20957e-05   7.11868e-05 )
------------------------------------------------------------
#Fit statistic : Chi-Squared =          53.94 using 59 PHA bins.
# Reduced chi-squared =         0.9463 for     57 degrees of freedom
# Null hypothesis probability =   5.905744e-01

Photon flux (15-150 keV)    in 169 sec: 6.65718E-02 ( -0.0085272  0.0085329 ) ph/cm2/s
Energy fluence (15-150 keV)             : 8.38083e-07 ( -1.24463e-07  1.26716e-07 ) ergs/cm2
Cutoff power-law model
Time interval is from   15.376 sec. to  184.332 sec.
Spectral model in the cutoff power-law:
------------------------------------------------------------
Parameters  : value       lower 90%   higher 90%
Photon index: -0.519519     ( -0.912842   1.1659 )
Epeak [keV] : 71.9912      ( -17.2513 144.861 )
Norm@50keV  : 1.72869E-03    ( -0.00172829   0.00456877 )
------------------------------------------------------------
#Fit statistic : Chi-Squared =          50.17 using 59 PHA bins.
# Reduced chi-squared =         0.8958 for     56 degrees of freedom
# Null hypothesis probability =   6.943216e-01

Photon flux (15-150 keV)    in 169 sec: 6.36661E-02 ( -0.0089779  0.0089356 ) ph/cm2/s
Energy fluence (15-150 keV)             : 7.8328e-07 ( -1.28271e-07  1.34032e-07 ) ergs/cm2
1-s peak spectrum fit
Power-law model
Time interval is from   23.532 sec. to   24.532 sec.

Spectral model in power-law:
------------------------------------------------------------
Parameters  : value       lower 90%   higher 90%
Photon index: -1.64619     ( -0.502543   0.464745 )
Norm@50keV  : 3.06538E-03    ( -0.000980399   0.000943984 )
------------------------------------------------------------
#Fit statistic : Chi-Squared =          51.97 using 59 PHA bins.
# Reduced chi-squared =         0.9118 for     57 degrees of freedom
# Null hypothesis probability =   6.635907e-01

Photon flux (15-150 keV)    in 1 sec: 0.399777 ( -0.109141  0.109142 ) ph/cm2/s
Energy fluence (15-150 keV)             : 2.85227e-08 ( -9.32099e-09  9.88957e-09 ) ergs/cm2
Cutoff power-law model
Time interval is from   23.532 sec. to   24.532 sec.
Spectral model in the cutoff power-law:
------------------------------------------------------------
Parameters  : value       lower 90%   higher 90%
Photon index: -0.0283379     ( -2.21205   4.71846 )
Epeak [keV] : 49.4019      (   )
Norm@50keV  : 2.67420E-02    (     )
------------------------------------------------------------
#Fit statistic : Chi-Squared =          50.83 using 59 PHA bins.
# Reduced chi-squared =         0.9077 for     56 degrees of freedom
# Null hypothesis probability =   6.703997e-01

Photon flux (15-150 keV)    in 1 sec: 0.374696 ( -0.11171  0.116163 ) ph/cm2/s
Energy fluence (15-150 keV)             : 2.32798e-08 ( -8.47065e-09  1.27067e-08 ) ergs/cm2
Time-resolved spectra
Distribution
T90 vs. Hardness ratio plot
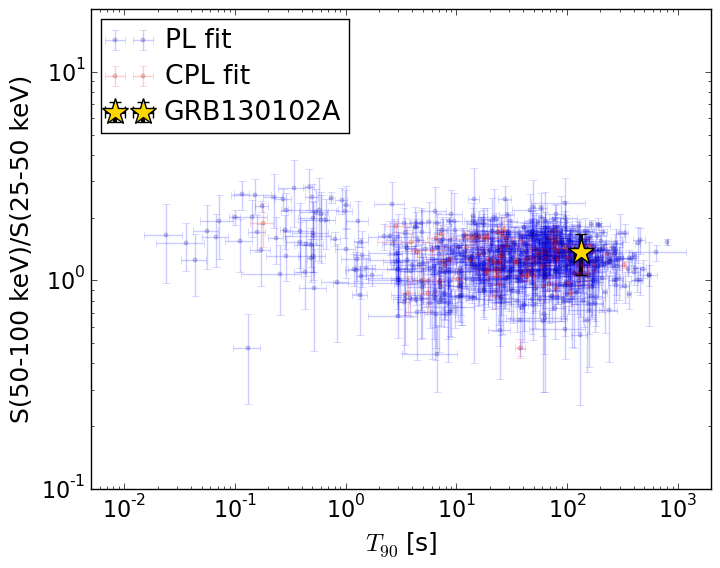
T90                                   = 132.78 sec.
Hardness ratio (energy fluence ratio) = 1.36958818414
S(15-50 keV) vs. S(50-150 keV) plot
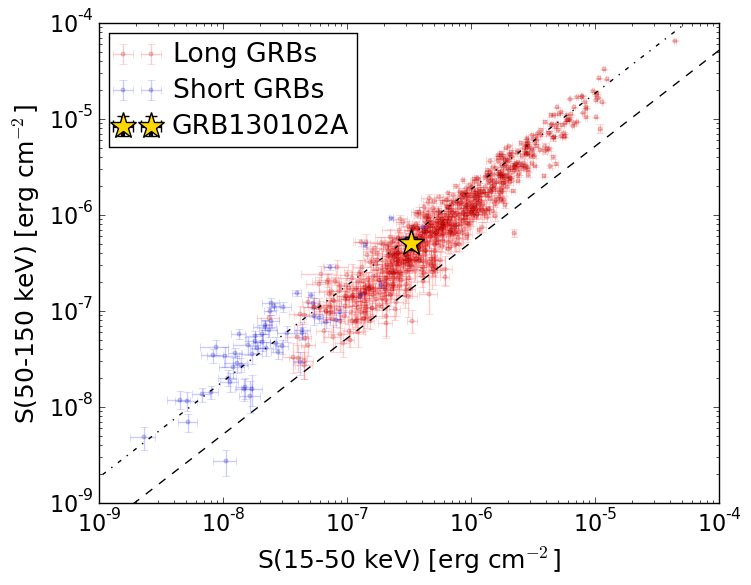
S(15-50 keV)  = 3.305736e-07
S(50-150 keV) = 5.075131e-07
The dash-dotted line and the dashed line traces the fluences calculated from the Band function with Epeak = 15 and 150 keV, respectively. Both lines assume a canonical values of alpha = -1 and beta = -2.5.
Mask shadow pattern
IMX = 4.746703492567145E-02, IMY = 1.697480824723668E-01
Spacecraft aspect plot
Bright source in the pre-burst/pre-slew/post-slew images
Pre-burst image of 15-350 keV band
Time interval of the image:
-79.499410 15.376000

# RAcent  DECcent POSerr Theta    Phi  PeakCts   SNR AngSep     Name
#  [deg]    [deg]    ['] [deg]  [deg]                   [']
254.3043  35.2955    5.8  50.8  -35.9   0.6389   2.0    8.0	Her X-1
299.5096  35.2196    3.2  26.8  -82.8   0.4543   3.6    4.1	Cyg X-1
308.0299  41.0014    1.9  18.4  -89.8   0.6610   6.2    4.7	Cyg X-3
326.3548  38.3878    4.4  17.5 -137.5   0.2346   2.6    9.5	Cyg X-2
142.2661  78.0048    2.5  46.2   47.5   2.0893   4.7 ------	UNKNOWN
178.9958  73.9547    2.9  48.2   34.7   1.5363   4.0 ------	UNKNOWN
318.4352  54.7423    3.1   3.7  -57.1   0.3455   3.7 ------	UNKNOWN
341.9291  12.7988    2.6  45.0 -157.3   0.7859   4.5 ------	UNKNOWN
344.0895   0.4311    2.4  57.6 -156.4   2.7496   4.8 ------	UNKNOWN
260.3541  30.9959    2.4  50.6  -44.5   2.2444   4.7 ------	UNKNOWN
Pre-slew background subtracted image of 15-350 keV band
Time interval of the image:
15.376000 73.500600

# RAcent  DECcent POSerr Theta    Phi  PeakCts   SNR AngSep     Name
#  [deg]    [deg]    ['] [deg]  [deg]                   [']
254.5630  35.4565    6.7  50.6  -36.0   0.4980   1.7    8.6	Her X-1
299.4786  35.3268    6.9  26.7  -82.6  -0.1946  -1.7    9.3	Cyg X-1
308.0140  41.1094    9.2  18.3  -89.6  -0.1163  -1.3   10.4	Cyg X-3
326.0911  38.4653    6.6  17.4 -136.8   0.1529   1.7    9.4	Cyg X-2
311.4158  49.8294    1.2  10.0  -74.4   0.8285   9.3 ------	UNKNOWN
240.8598  38.5768    2.3  55.8  -23.3   1.6983   5.0 ------	UNKNOWN
Post-slew image of 15-350 keV band
Time interval of the image:
105.300600 963.079200

# RAcent  DECcent POSerr Theta    Phi  PeakCts   SNR AngSep     Name
#  [deg]    [deg]    ['] [deg]  [deg]                   [']
254.4578  35.3319    2.5  43.2  -23.3   3.2669   4.5    0.6	Her X-1
299.5410  35.1970    2.2  17.0  -80.9   2.4353   5.2    2.4	Cyg X-1
308.1023  40.9473    0.8   9.2 -100.0   6.0987  13.6    0.5	Cyg X-3
326.1299  38.3888    5.3  15.5 -164.0   0.9051   2.2    4.5	Cyg X-2
298.6654  61.5493    2.8  13.7   37.5   1.6835   4.1 ------	UNKNOWN
328.6771  41.8492    2.8  14.4 -178.8   1.8157   4.2 ------	UNKNOWN
231.4250  41.9083    2.8  53.6   -1.7   5.4810   4.1 ------	UNKNOWN
346.3159   7.7586    2.5  51.1 -162.7   5.0441   4.6 ------	UNKNOWN
260.4367  19.0465    3.6  50.7  -44.4   7.8922   3.2 ------	UNKNOWN
288.6512  13.2387    2.6  41.1  -81.0   8.6273   4.4 ------	UNKNOWN