Analysis Summary
Notes:
- 1) No attempt has been made to eliminate the non-significant decimal places.
- 2) This batgrbproduct analysis is done using the HEASARC data.
- 3) This batgrbproduct analysis is using the flight position for the mask-weighting calculation.
======================================================================
                  BAT GRB EVENT DATA PROCESSING REPORT
    Process Script Ver: batgrbproduct v2.46
    Process Start Time: Sun Jan 12 05:54:40 EST 2014
             Host Name: batevent1
   Current Working Dir: /local/data/batevent/batevent_reproc/trigger546731
======================================================================

  Trigger: 00546731      Segment: 000

  BAT Trigger Time: 380591059.584   [s; MET]
      Trigger Stop: 380591071.744   [s; MET]
               UTC: 2013-01-22T23:44:09.452440    [includes UTCF correction]
       Where From?: TDRSS position message

  BAT
    RA: 194.218399686616   Dec: 59.0153258308736  [deg; J2000]

     Catalogged Source?: NO
     Point Source?:      YES
     GRB Indicated?:     YES    [ by BAT flight software ]
     Image S/N Ratio:    7.76
     Image Trigger?:     NO
     Rate S/N Ratio:     8.66025403784439  [ if not an image trigger ]
     Image S/N Ratio:    7.76

  Analysis Position:   [ source = BAT ]
    RA: 194.218399686616   Dec: 59.0153258308736  [deg; J2000]

  Refined Position:   [ source = BAT pre-slew burst ]
    RA: 194.238683914829   Dec: 59.0135367576015  [deg; J2000]
        { 12h 56m 57.3s , +59d 00' 48.7" }
         +/- 1.9794897783778 [arcmin] (estimated 90% radius based on SNR)
         +/- 0.984849822273606 [arcmin] (formal 1-sigma fit error)
    SNR: 11.4675557645929

  Angular difference between the analysis and refined position is 0.635695 arcmin

  Partial Coding Fraction: 0.890625    [ including projection effects ]

  Duration
     T90: 76.5440000295639 +/- 20.7705160522924
        Measured from: 1.85600000619888
                   to: 78.4000000357628     [s; relative to TRIGTIME]
     T50: 31.9840000271797 +/- 12.3722218174985
        Measured from: 11.0239999890327
                   to: 43.0080000162125     [s; relative to TRIGTIME]


  Fluence
     Peak Flux  (peak 1 second)
        Measured from: 10.8519999980927
                   to: 11.8519999980927     [s; relative to TRIGTIME]
     Total Fluence
        Measured from: 0.192000031471252
                   to: 89.2800000309944     [s; relative to TRIGTIME]

             Band 1     Band 2     Band 3     Band 4
              15-25      25-50     50-100    100-350     keV
 Total     0.294530   0.356876   0.429834   0.169620
           0.048684   0.050865   0.046428   0.045470 [error]
 Peak      0.013284   0.023971   0.014539   0.004925
           0.005324   0.005605   0.005029   0.004868 [error]

     [ fluence units of on-axis counts / fully illuminated detector ]

======================================================================


====== Table of the duration information =============================

        Value   tstart    tstop
T100   89.088    0.192   89.280
T90    76.544    1.856   78.400
T50    31.984   11.024   43.008
Peak    1.000   10.852   11.852


====== Spectral Analysis Summary =====================================

Model      : spectral model: simple power-law (PL) and cutoff power-law (CPL)
Ph_index   : photon index: E^{Ph_index}
Ph_90err   : 90% error of the photon index
Epeak      : Epeak in keV
Epeak_90err: 90% error of Epeak
Norm       : normalization at 50 keV in both the PL model and CPL model
Nomr_90err : 90% error of the normalization
chi2       : Chi-Squared
dof        : degree of freedo

=== Time-averaged spectral analysis ===
(Best model with acceptable fit: N/A)

Model Ph_index Ph_90err_low Ph_90err_hi  Epeak  Epeak_90err_low  Epeak_90err_hi  Norm       Nomr_90err_low    Norm_90err_hi    chi2    dof
PL      -1.167    -0.239      0.244       -           -               -         9.15e-04     -1.12e-04          1.12e-04      79.060   57
CPL     -1.166    -0.237      0.250     9999.350    -9999.350      -9999.350      9.19e-04     -9.19e-04          -6.01e-04      79.080   56


=== 1-s peak spectral analysis ===
(Best model with acceptable fit: PL)

Model Ph_index Ph_90err_low Ph_90err_hi  Epeak  Epeak_90err_low  Epeak_90err_hi  Norm       Nomr_90err_low    Norm_90err_hi    chi2    dof
PL      -1.703     -0.573     0.510       -           -               -         3.29e-03     -1.18e-03          1.12e-03      67.500   57
CPL     -0.849     -1.358     3.776       58.724      N/A           N/A         9.99e-03        N/A               N/A         67.030   56


=== Fluence/Peak Flux Summary ===

              Model    Band1     Band2     Band3     Band4     Band5     Total
                       15-25     25-50    50-100    100-350    15-150    15-350    keV
Fluence         PL   7.62e-08  1.72e-07  3.06e-07  1.28e-06  8.35e-07  1.84e-06   erg/cm2
      90%_error_low -1.86e-08 -2.51e-08 -4.72e-08 -4.08e-07 -1.17e-07 -4.41e-07   erg/cm2
      90%_error_hi   2.01e-08  2.44e-08  4.63e-08  5.35e-07  1.19e-07  5.52e-07   erg/cm2
Peak flux       PL   1.65e-01  1.47e-01  9.04e-02  8.43e-02  4.38e-01  4.86e-01   ph/cm2/s
      90%_error_low -6.81e-02 -4.37e-02 -4.03e-02 -5.52e-02 -1.30e-01 -1.49e-01   ph/cm2/s
      90%_error_hi   7.37e-02  4.37e-02  4.12e-02  9.54e-02  1.30e-01  1.54e-01   ph/cm2/s

Fluence        CPL   7.62e-08  1.69e-07  3.00e-07  1.30e-06  8.40e-07  1.73e-06   erg/cm2
      90%_error_low    N/A    -2.26e-08    N/A    -7.02e-07    N/A    -5.76e-07   erg/cm2
      90%_error_hi     N/A     2.70e-08    N/A     5.38e-07    N/A     6.45e-07   erg/cm2
Peak flux      CPL   1.51e-01  1.63e-01  9.14e-02  2.99e-02  4.26e-01  4.35e-01   ph/cm2/s
      90%_error_low -8.06e-02 -5.54e-02 -9.14e-02 -2.99e-02 -1.33e-01 -1.41e-01   ph/cm2/s
      90%_error_hi   8.12e-02  6.51e-02  4.67e-02  7.63e-02  1.33e-01  1.63e-01   ph/cm2/s

======================================================================
Image
Pre-slew 15.0-350.0 keV image (Event data)
#   RAcent    DECcent   POSerr    Theta     Phi              Peak Cts       SNR   Name
  194.2387    59.0135   0.0167    21.4740  -140.8054         0.9834746     11.468 TRIG_00546731

Foreground time interval of the image:
  0.192  57.117 (delta_t =  56.925 [sec])
Background time interval of the image:
-239.584   0.192 (delta_t = 239.776 [sec])
Light Curves
Note: The mask-weighted lightcurves have units of either count/det or counts/sec/det, where a det is 0.4 x 0.4 = 0.16 sq cm.
Full-time range; 1 s binning
Other quick-look light curves:
- 64 ms binning (zoomed)
- 16 ms binning (zoomed)
- 8 ms binning (zoomed)
- 2 ms binning (zoomed)
- SN=5 or 10 s binning (full-time range)
- Raw light curve
Spectra
- 64 ms binning (zoomed)
- 16 ms binning (zoomed)
- 8 ms binning (zoomed)
- 2 ms binning (zoomed)
- SN=5 or 10 s binning (full-time range)
- Raw light curve
Spectra
Notes:
- 1) The fitting includes the systematic errors.
- 2) When the burst includes telescope slew time periods, the fitting uses an average response file made from multiple 5-s response files through out the slew time plus single time preiod for the non-slew times, and weighted by the total counts in the corresponding time period using addrmf. An average response file is needed becuase a spectral fit using the pre-slew DRM will introduce some errors in both a spectral shape and a normalization if the PHA file contains a lot of the slew/post-slew time interval.
- 3) For fits to more complicated models (e.g. a power-law over a cutoff power-law), the BAT team has decided to require a chi-square improvement of more than 6 for each extra dof.
Time averaged spectrum fit using the average DRM
Power-law model
Time interval is from    0.192 sec. to   89.280 sec.

Spectral model in power-law:
------------------------------------------------------------
Parameters  : value       lower 90%   higher 90%
Photon index: -1.16667     ( -0.239031   0.24401 )
Norm@50keV  : 9.14650E-04    ( -0.000112194   0.000112194 )
------------------------------------------------------------
#Fit statistic : Chi-Squared =          79.06 using 59 PHA bins.
# Reduced chi-squared =          1.387 for     57 degrees of freedom
# Null hypothesis probability =   2.820375e-02

Photon flux (15-150 keV)    in 89.09 sec: 0.106885 ( -0.0134735  0.013531 ) ph/cm2/s
Energy fluence (15-150 keV)             : 8.34793e-07 ( -1.17282e-07  1.18681e-07 ) ergs/cm2
Cutoff power-law model
Time interval is from    0.192 sec. to   89.280 sec.
Spectral model in the cutoff power-law:
------------------------------------------------------------
Parameters  : value       lower 90%   higher 90%
Photon index: -2.90012     ( -0.236851   0.249619 )
Epeak [keV] : 259.677      ( -9999.36 -9999.36 )
Norm@50keV  : 1.10771E-04    ( -0.000110783   0.000206761 )
------------------------------------------------------------
#Fit statistic : Chi-Squared =          77.23 using 59 PHA bins.
# Reduced chi-squared =          1.379 for     56 degrees of freedom
# Null hypothesis probability =   3.153274e-02

Photon flux (15-150 keV)    in 89.09 sec: 0.106862 ( -0.0134956  0.013516 ) ph/cm2/s
Energy fluence (15-150 keV)             : 8.40232e-07 ( 0  0 ) ergs/cm2
1-s peak spectrum fit
Power-law model
Time interval is from   10.852 sec. to   11.852 sec.

Spectral model in power-law:
------------------------------------------------------------
Parameters  : value       lower 90%   higher 90%
Photon index: -1.70281     ( -0.573132   0.509971 )
Norm@50keV  : 3.29334E-03    ( -0.00118352   0.00112283 )
------------------------------------------------------------
#Fit statistic : Chi-Squared =          67.50 using 59 PHA bins.
# Reduced chi-squared =          1.184 for     57 degrees of freedom
# Null hypothesis probability =   1.610657e-01

Photon flux (15-150 keV)    in 1 sec: 0.437841 ( -0.129937  0.129938 ) ph/cm2/s
Energy fluence (15-150 keV)             : 3.04895e-08 ( -1.08938e-08  1.15638e-08 ) ergs/cm2
Cutoff power-law model
Time interval is from   10.852 sec. to   11.852 sec.
Spectral model in the cutoff power-law:
------------------------------------------------------------
Parameters  : value       lower 90%   higher 90%
Photon index: -0.848521     ( -1.35782   3.77638 )
Epeak [keV] : 58.7236      (   )
Norm@50keV  : 9.98578E-03    (     )
------------------------------------------------------------
#Fit statistic : Chi-Squared =          67.03 using 59 PHA bins.
# Reduced chi-squared =          1.197 for     56 degrees of freedom
# Null hypothesis probability =   1.486060e-01

Photon flux (15-150 keV)    in 1 sec: 0.426248 ( -0.132816  0.132956 ) ph/cm2/s
Energy fluence (15-150 keV)             : 2.80627e-08 ( -1.10611e-08  1.28813e-08 ) ergs/cm2
Time-resolved spectra
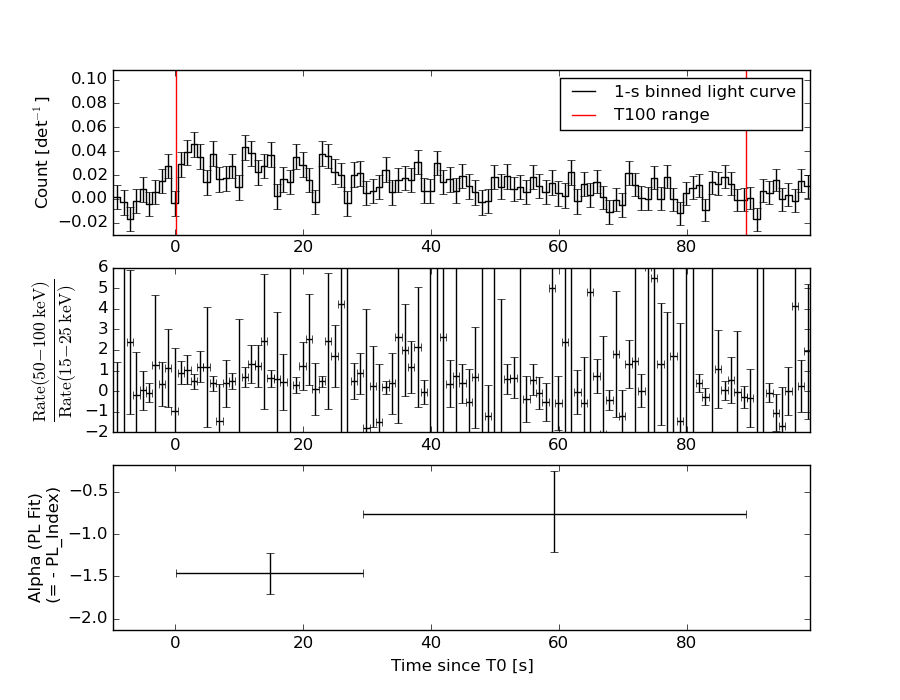
Distribution
T90 vs. Hardness ratio plot
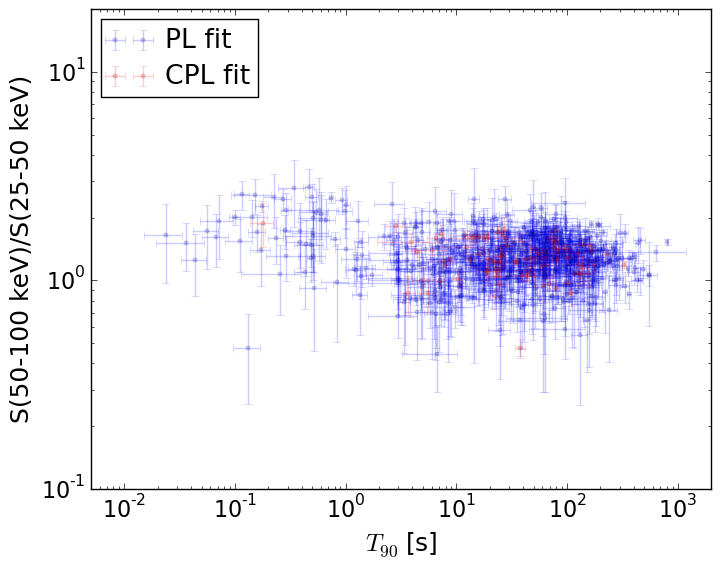
T90                                   = N/A sec.
Hardness ratio (energy fluence ratio) = N/A
S(15-50 keV) vs. S(50-150 keV) plot
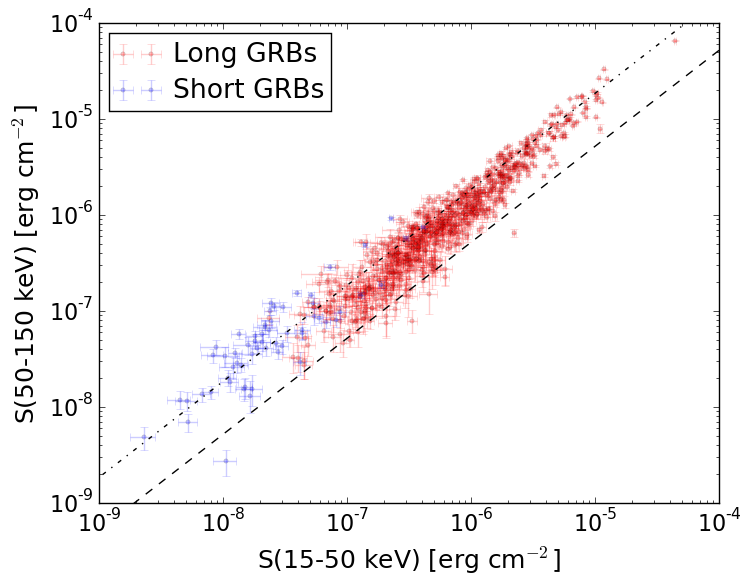
S(15-50 keV)  = N/A
S(50-150 keV) = N/A
The dash-dotted line and the dashed line traces the fluences calculated from the Band function with Epeak = 15 and 150 keV, respectively. Both lines assume a canonical values of alpha = -1 and beta = -2.5.
Mask shadow pattern
IMX = -3.048755972089129E-01, IMY = 2.486025731066294E-01
Spacecraft aspect plot
Bright source in the pre-burst/pre-slew/post-slew images
Pre-burst image of 15-350 keV band
Time interval of the image:
-239.584000 0.192000

# RAcent  DECcent POSerr Theta    Phi  PeakCts   SNR AngSep     Name
#  [deg]    [deg]    ['] [deg]  [deg]                   [']
171.0049  22.4459    2.8  18.8   31.0   0.7265   4.1 ------	UNKNOWN
325.1058  80.8847    2.8  57.3 -160.1   3.8716   4.1 ------	UNKNOWN
218.5698   6.1148    2.8  50.8  -44.6   4.3880   4.1 ------	UNKNOWN
Pre-slew background subtracted image of 15-350 keV band
Time interval of the image:
0.192000 57.116600

# RAcent  DECcent POSerr Theta    Phi  PeakCts   SNR AngSep     Name
#  [deg]    [deg]    ['] [deg]  [deg]                   [']
149.3035  38.1036    2.4  21.3  106.5   0.5065   4.9 ------	UNKNOWN
183.0109   3.0342    2.1  38.0    4.0   0.6513   5.5 ------	UNKNOWN
188.0817  19.2218    2.2  23.4  -13.6   0.4367   5.2 ------	UNKNOWN
194.2387  59.0135    1.0  21.5 -140.8   0.9835  11.5 ------	UNKNOWN
Post-slew image of 15-350 keV band
Time interval of the image:
100.716600 658.416600

# RAcent  DECcent POSerr Theta    Phi  PeakCts   SNR AngSep     Name
#  [deg]    [deg]    ['] [deg]  [deg]                   [']
146.2622  34.7103    2.0  39.5   81.7   7.9602   5.6 ------	UNKNOWN
 92.3526  66.7958    2.4  41.7  152.6   3.2735   4.7 ------	UNKNOWN
 36.3611  65.6343    4.0  54.3  177.0   3.6971   2.9 ------	UNKNOWN
 31.0675  63.4191    3.2  56.9  179.1   7.6069   3.6 ------	UNKNOWN
212.9313   4.7833    4.0  56.1  -14.6   3.7946   2.9 ------	UNKNOWN
234.2710  17.4584    5.0  50.7  -44.5   4.3829   2.4 ------	UNKNOWN
263.9512  47.7286    5.6  41.0  -98.0   3.8004   2.1 ------	UNKNOWN