Analysis Summary
Notes:
- 1) No attempt has been made to eliminate the non-significant decimal places.
- 2) This batgrbproduct analysis is done using the HEASARC data.
- 3) This batgrbproduct analysis is using the flight position for the mask-weighting calculation.
======================================================================
BAT GRB EVENT DATA PROCESSING REPORT
Process Script Ver: batgrbproduct v2.46
Process Start Time: Sun Jan 12 05:44:35 EST 2014
Host Name: batevent1
Current Working Dir: /local/data/batevent/batevent_reproc/trigger547420
======================================================================
Trigger: 00547420 Segment: 000
BAT Trigger Time: 381352219.072 [s; MET]
Trigger Stop: 381352221.12 [s; MET]
UTC: 2013-01-31T19:10:08.907360 [includes UTCF correction]
Where From?: TDRSS position message
BAT
RA: 173.951574019347 Dec: 15.0356350571936 [deg; J2000]
Catalogged Source?: NO
Point Source?: YES
GRB Indicated?: YES [ by BAT flight software ]
Image S/N Ratio: 7.85
Image Trigger?: NO
Rate S/N Ratio: 16.7332005306815 [ if not an image trigger ]
Image S/N Ratio: 7.85
Analysis Position: [ source = BAT ]
RA: 173.951574019347 Dec: 15.0356350571936 [deg; J2000]
Refined Position: [ source = BAT pre-slew burst ]
RA: 173.957887257058 Dec: 15.0313793477333 [deg; J2000]
{ 11h 35m 49.9s , +15d 01' 53.0" }
+/- 1.71345478529764 [arcmin] (estimated 90% radius based on SNR)
+/- 0.768278815737424 [arcmin] (formal 1-sigma fit error)
SNR: 14.0933616358161
Angular difference between the analysis and refined position is 0.446129 arcmin
Partial Coding Fraction: 0.515625 [ including projection effects ]
Duration
T90: 4.29999995231628 +/- 0.257402418116644
Measured from: -0.0680000185966492
to: 4.23199993371964 [s; relative to TRIGTIME]
T50: 2.79999995231628 +/- 0.872715334057104
Measured from: 0.667999982833862
to: 3.46799993515015 [s; relative to TRIGTIME]
Fluence
Peak Flux (peak 1 second)
Measured from: -0.280000030994415
to: 0.719999969005585 [s; relative to TRIGTIME]
Total Fluence
Measured from: -0.280000030994415
to: 4.36799997091293 [s; relative to TRIGTIME]
Band 1 Band 2 Band 3 Band 4
15-25 25-50 50-100 100-350 keV
Total 0.106469 0.153480 0.152075 0.057015
0.016598 0.017615 0.016266 0.014758 [error]
Peak 0.036060 0.037579 0.037186 0.016293
0.007695 0.008148 0.007696 0.007098 [error]
[ fluence units of on-axis counts / fully illuminated detector ]
======================================================================
====== Table of the duration information =============================
Value tstart tstop
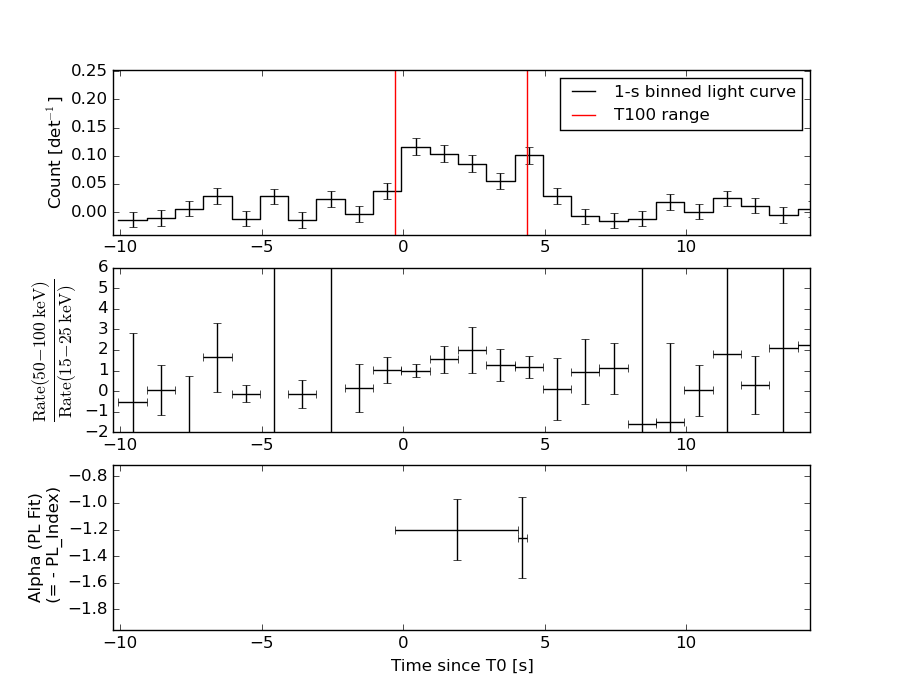
T100 4.648 -0.280 4.368
T90 4.300 -0.068 4.232
T50 2.800 0.668 3.468
Peak 1.000 -0.280 0.720
====== Spectral Analysis Summary =====================================
Model : spectral model: simple power-law (PL) and cutoff power-law (CPL)
Ph_index : photon index: E^{Ph_index}
Ph_90err : 90% error of the photon index
Epeak : Epeak in keV
Epeak_90err: 90% error of Epeak
Norm : normalization at 50 keV in both the PL model and CPL model
Nomr_90err : 90% error of the normalization
chi2 : Chi-Squared
dof : degree of freedo
=== Time-averaged spectral analysis ===
(Best model with acceptable fit: PL)
Model Ph_index Ph_90err_low Ph_90err_hi Epeak Epeak_90err_low Epeak_90err_hi Norm Nomr_90err_low Norm_90err_hi chi2 dof
PL -1.148 -0.202 0.207 - - - 7.06e-03 -7.77e-04 7.74e-04 54.190 57
CPL -1.096 -0.255 0.532 987.079 -987.079 -987.079 7.46e-03 N/A N/A 54.350 56
=== 1-s peak spectral analysis ===
(Best model with acceptable fit: PL)
Model Ph_index Ph_90err_low Ph_90err_hi Epeak Epeak_90err_low Epeak_90err_hi Norm Nomr_90err_low Norm_90err_hi chi2 dof
PL -1.369 -0.396 0.396 - - - 7.98e-03 -1.70e-03 1.67e-03 50.320 57
CPL -1.376 -1.304 0.913 9999.340 -9999.340 -9999.340 7.99e-03 -1.69e-03 1.30e-02 50.330 56
=== Fluence/Peak Flux Summary ===
Model Band1 Band2 Band3 Band4 Band5 Total
15-25 25-50 50-100 100-350 15-150 15-350 keV
Fluence PL 3.02e-08 6.88e-08 1.24e-07 5.31e-07 3.38e-07 7.55e-07 erg/cm2
90%_error_low -6.61e-09 -9.20e-09 -1.60e-08 -1.43e-07 -4.05e-08 -1.53e-07 erg/cm2
90%_error_hi 7.09e-09 8.99e-09 1.58e-08 1.78e-07 4.08e-08 1.83e-07 erg/cm2
Peak flux PL 2.90e-01 3.15e-01 2.44e-01 3.10e-01 9.65e-01 1.16e+00 ph/cm2/s
90%_error_low -1.05e-01 -7.27e-02 -6.67e-02 -1.47e-01 -2.01e-01 -2.49e-01 ph/cm2/s
90%_error_hi 1.16e-01 7.03e-02 6.47e-02 2.17e-01 2.02e-01 2.58e-01 ph/cm2/s
Fluence CPL 3.01e-08 6.84e-08 1.23e-07 5.33e-07 3.40e-07 7.13e-07 erg/cm2
90%_error_low N/A -1.02e-08 -1.73e-08 -2.86e-07 -4.83e-08 -2.45e-07 erg/cm2
90%_error_hi N/A 1.08e-08 2.04e-08 8.11e-08 4.58e-08 3.57e-07 erg/cm2
Peak flux CPL 2.97e-01 3.14e-01 2.42e-01 3.47e-01 9.74e-01 1.16e+00 ph/cm2/s
90%_error_low -1.15e-01 -7.27e-02 N/A N/A -2.14e-01 -2.92e-01 ph/cm2/s
90%_error_hi 1.07e-01 7.22e-02 N/A N/A 2.49e-01 2.58e-01 ph/cm2/s
======================================================================
Image
Pre-slew 15.0-350.0 keV image (Event data)
#   RAcent    DECcent   POSerr    Theta     Phi              Peak Cts       SNR   Name
  173.9579    15.0314   0.0136    33.1253    28.1078         0.4901496     14.093 TRIG_00547420

Foreground time interval of the image:
 -0.280   4.368 (delta_t =   4.648 [sec])
Background time interval of the image:
-239.072  -0.280 (delta_t = 238.792 [sec])
Light Curves
Note: The mask-weighted lightcurves have units of either count/det or counts/sec/det, where a det is 0.4 x 0.4 = 0.16 sq cm.
Full-time range; 1 s binning
Other quick-look light curves:
- 64 ms binning (zoomed)
- 16 ms binning (zoomed)
- 8 ms binning (zoomed)
- 2 ms binning (zoomed)
- SN=5 or 10 s binning (full-time range)
- Raw light curve
Spectra
- 64 ms binning (zoomed)
- 16 ms binning (zoomed)
- 8 ms binning (zoomed)
- 2 ms binning (zoomed)
- SN=5 or 10 s binning (full-time range)
- Raw light curve
Spectra
Notes:
- 1) The fitting includes the systematic errors.
- 2) When the burst includes telescope slew time periods, the fitting uses an average response file made from multiple 5-s response files through out the slew time plus single time preiod for the non-slew times, and weighted by the total counts in the corresponding time period using addrmf. An average response file is needed becuase a spectral fit using the pre-slew DRM will introduce some errors in both a spectral shape and a normalization if the PHA file contains a lot of the slew/post-slew time interval.
- 3) For fits to more complicated models (e.g. a power-law over a cutoff power-law), the BAT team has decided to require a chi-square improvement of more than 6 for each extra dof.
Time averaged spectrum fit using the average DRM
Power-law model

Time interval is from   -0.280 sec. to    4.368 sec.

Spectral model in power-law:
------------------------------------------------------------
Parameters  : value       lower 90%   higher 90%
Photon index: -1.14808     ( -0.20185   0.206772 )
Norm@50keV  : 7.06300E-03    ( -0.000776536   0.000774146 )
------------------------------------------------------------
#Fit statistic : Chi-Squared =          54.19 using 59 PHA bins.
# Reduced chi-squared =         0.9507 for     57 degrees of freedom
# Null hypothesis probability =   5.810726e-01

Photon flux (15-150 keV)    in 4.648 sec: 0.823499 ( -0.094167  0.094455 ) ph/cm2/s
Energy fluence (15-150 keV)             : 3.38186e-07 ( -4.05086e-08  4.07675e-08 ) ergs/cm2
Cutoff power-law model
Time interval is from   -0.280 sec. to    4.368 sec.
Spectral model in the cutoff power-law:
------------------------------------------------------------
Parameters  : value       lower 90%   higher 90%
Photon index: -1.14334     ( -0.254709   0.531892 )
Epeak [keV] : 1.00000E+04      ( -10000 -10000 )
Norm@50keV  : 7.09869E-03    (     )
------------------------------------------------------------
#Fit statistic : Chi-Squared =          54.21 using 59 PHA bins.
# Reduced chi-squared =         0.9680 for     56 degrees of freedom
# Null hypothesis probability =   5.430444e-01

Photon flux (15-150 keV)    in 4.648 sec: 0.823353 ( -0.094198  0.094414 ) ph/cm2/s
Energy fluence (15-150 keV)             : 3.39505e-07 ( -4.8335e-08  4.58459e-08 ) ergs/cm2
1-s peak spectrum fit
Power-law model
Time interval is from   -0.280 sec. to    0.720 sec.

Spectral model in power-law:
------------------------------------------------------------
Parameters  : value       lower 90%   higher 90%
Photon index: -1.36914     ( -0.396311   0.396304 )
Norm@50keV  : 7.97515E-03    ( -0.00169539   0.00167233 )
------------------------------------------------------------
#Fit statistic : Chi-Squared =          50.32 using 59 PHA bins.
# Reduced chi-squared =         0.8829 for     57 degrees of freedom
# Null hypothesis probability =   7.219014e-01

Photon flux (15-150 keV)    in 1 sec: 0.964655 ( -0.201014  0.201555 ) ph/cm2/s
Energy fluence (15-150 keV)             : 7.75729e-08 ( -1.86044e-08  1.90233e-08 ) ergs/cm2
Cutoff power-law model
Time interval is from   -0.280 sec. to    0.720 sec.
Spectral model in the cutoff power-law:
------------------------------------------------------------
Parameters  : value       lower 90%   higher 90%
Photon index: -1.37622     ( -1.30509   0.912285 )
Epeak [keV] : 9999.34      ( -9999.36 -9999.36 )
Norm@50keV  : 7.99273E-03    ( -0.00169588   0.0129964 )
------------------------------------------------------------
#Fit statistic : Chi-Squared =          50.33 using 59 PHA bins.
# Reduced chi-squared =         0.8988 for     56 degrees of freedom
# Null hypothesis probability =   6.883984e-01

Photon flux (15-150 keV)    in 1 sec: 0.973763 ( -0.213955  0.248737 ) ph/cm2/s
Energy fluence (15-150 keV)             : 3.31345e-08 ( 0  0 ) ergs/cm2
Time-resolved spectra
Distribution
T90 vs. Hardness ratio plot
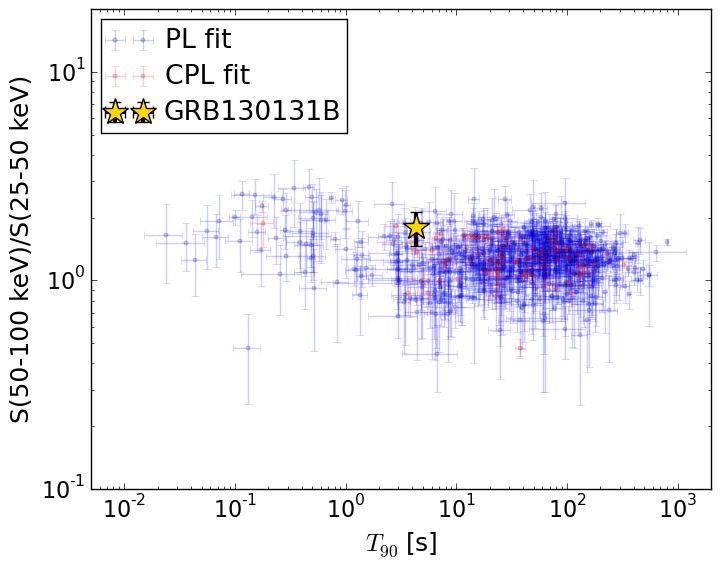
T90                                   = 4.3 sec.
Hardness ratio (energy fluence ratio) = 1.80501167347
S(15-50 keV) vs. S(50-150 keV) plot
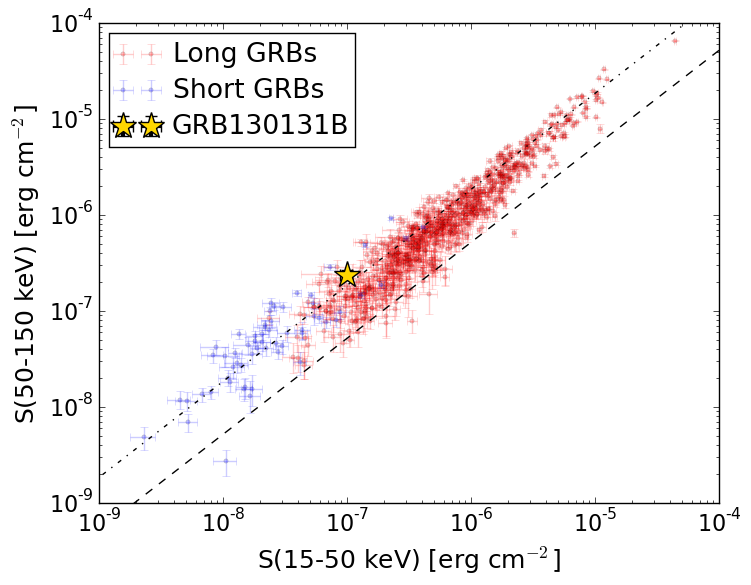
S(15-50 keV)  = 9.900692e-08
S(50-150 keV) = 2.391826e-07
The dash-dotted line and the dashed line traces the fluences calculated from the Band function with Epeak = 15 and 150 keV, respectively. Both lines assume a canonical values of alpha = -1 and beta = -2.5.
Mask shadow pattern
IMX = 5.755639469620980E-01, IMY = -3.074235065807378E-01
Spacecraft aspect plot
Bright source in the pre-burst/pre-slew/post-slew images
Pre-burst image of 15-350 keV band
Time interval of the image:
-239.072000 -0.280000

# RAcent  DECcent POSerr Theta    Phi  PeakCts   SNR AngSep     Name
#  [deg]    [deg]    ['] [deg]  [deg]                   [']
154.5202  79.7038    2.3  32.2 -152.4   1.1161   5.0 ------	UNKNOWN
207.5532  17.2154    3.1  42.8  -23.5   1.0909   3.7 ------	UNKNOWN
227.3521  28.3508    4.1  47.2  -53.2   2.6283   2.8 ------	UNKNOWN
Pre-slew background subtracted image of 15-350 keV band
Time interval of the image:
-0.280000 4.368000

# RAcent  DECcent POSerr Theta    Phi  PeakCts   SNR AngSep     Name
#  [deg]    [deg]    ['] [deg]  [deg]                   [']
173.9579  15.0314    0.8  33.1   28.1   0.4902  14.1 ------	UNKNOWN
 53.7705  63.8383    2.6  57.8 -174.4   0.5451   4.4 ------	UNKNOWN
Post-slew image of 15-350 keV band
Time interval of the image:
92.828590 645.928600

# RAcent  DECcent POSerr Theta    Phi  PeakCts   SNR AngSep     Name
#  [deg]    [deg]    ['] [deg]  [deg]                   [']
159.7254  57.1423    3.2  43.5  160.3   2.8171   3.7 ------	UNKNOWN
163.8046 -25.0413    2.5  41.3    5.4   2.1777   4.5 ------	UNKNOWN
193.6337  70.6935    3.0  57.0  179.1   8.6760   3.9 ------	UNKNOWN
204.2786 -26.2490    4.0  50.7  -44.4   5.0944   2.9 ------	UNKNOWN
212.7305   0.2382    2.2  41.1  -81.0   8.2294   5.2 ------	UNKNOWN
214.0993   4.2619    3.1  41.0  -87.5   6.3316   3.8 ------	UNKNOWN