Analysis Summary
Notes:
- 1) No attempt has been made to eliminate the non-significant decimal places.
- 2) This batgrbproduct analysis is done using the HEASARC data.
- 3) This batgrbproduct analysis is using the flight position for the mask-weighting calculation.
======================================================================
BAT GRB EVENT DATA PROCESSING REPORT
Process Script Ver: batgrbproduct v2.46
Process Start Time: Sun Jan 12 05:28:33 EST 2014
Host Name: batevent1
Current Working Dir: /local/data/batevent/batevent_reproc/trigger548276
======================================================================
Trigger: 00548276 Segment: 000
BAT Trigger Time: 382246602.368 [s; MET]
Trigger Stop: 382246610.56 [s; MET]
UTC: 2013-02-11T03:36:32.164500 [includes UTCF correction]
Where From?: TDRSS position message
BAT
RA: 147.522617639919 Dec: -42.3387481449984 [deg; J2000]
Catalogged Source?: NO
Point Source?: YES
GRB Indicated?: YES [ by BAT flight software ]
Image S/N Ratio: 7.01
Image Trigger?: NO
Rate S/N Ratio: 9.38083151964686 [ if not an image trigger ]
Image S/N Ratio: 7.01
Analysis Position: [ source = BAT ]
RA: 147.522617639919 Dec: -42.3387481449984 [deg; J2000]
Refined Position: [ source = BAT pre-slew burst ]
RA: 147.518209461479 Dec: -42.3315182282187 [deg; J2000]
{ 09h 50m 04.4s , -42d 19' 53.5" }
+/- 2.15856975934095 [arcmin] (estimated 90% radius based on SNR)
+/- 0.849971320969526 [arcmin] (formal 1-sigma fit error)
SNR: 10.1330049214531
Angular difference between the analysis and refined position is 0.475820 arcmin
Partial Coding Fraction: 0.40625 [ including projection effects ]
Duration
T90: 30.7519999146461 +/- 6.35497978439702
Measured from: -1.42399996519089
to: 29.3279999494553 [s; relative to TRIGTIME]
T50: 9.54399996995926 +/- 6.72705727252734
Measured from: 3.06400001049042
to: 12.6079999804497 [s; relative to TRIGTIME]
Fluence
Peak Flux (peak 1 second)
Measured from: -1.5799999833107
to: -0.579999983310699 [s; relative to TRIGTIME]
Total Fluence
Measured from: -3.40399998426437
to: 32.3120000362396 [s; relative to TRIGTIME]
Band 1 Band 2 Band 3 Band 4
15-25 25-50 50-100 100-350 keV
Total 0.397292 0.447661 0.225546 0.023760
0.053078 0.052888 0.045113 0.038439 [error]
Peak 0.022329 0.035542 0.023731 0.006513
0.008798 0.008814 0.007934 0.006377 [error]
[ fluence units of on-axis counts / fully illuminated detector ]
======================================================================
====== Table of the duration information =============================
Value tstart tstop
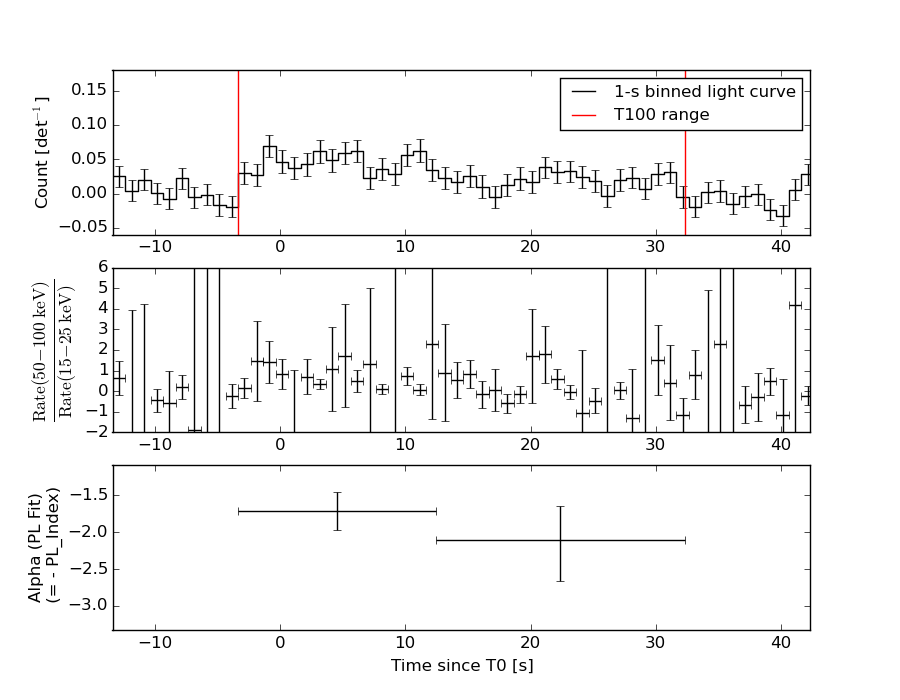
T100 35.716 -3.404 32.312
T90 30.752 -1.424 29.328
T50 9.544 3.064 12.608
Peak 1.000 -1.580 -0.580
====== Spectral Analysis Summary =====================================
Model : spectral model: simple power-law (PL) and cutoff power-law (CPL)
Ph_index : photon index: E^{Ph_index}
Ph_90err : 90% error of the photon index
Epeak : Epeak in keV
Epeak_90err: 90% error of Epeak
Norm : normalization at 50 keV in both the PL model and CPL model
Nomr_90err : 90% error of the normalization
chi2 : Chi-Squared
dof : degree of freedo
=== Time-averaged spectral analysis ===
(Best model with acceptable fit: PL)
Model Ph_index Ph_90err_low Ph_90err_hi Epeak Epeak_90err_low Epeak_90err_hi Norm Nomr_90err_low Norm_90err_hi chi2 dof
PL -1.853 -0.255 0.243 - - - 1.98e-03 -3.19e-04 3.11e-04 61.910 57
CPL -1.692 -0.618 0.975 84.742 -84.720 -84.742 2.44e-03 -2.44e-03 6.15e-03 61.800 56
=== 1-s peak spectral analysis ===
(Best model with acceptable fit: PL)
Model Ph_index Ph_90err_low Ph_90err_hi Epeak Epeak_90err_low Epeak_90err_hi Norm Nomr_90err_low Norm_90err_hi chi2 dof
PL -1.554 -0.492 0.466 - - - 5.96e-03 -1.79e-03 1.76e-03 69.770 57
CPL -0.240 -1.662 3.688 69.266 -23.626 -69.266 2.63e-02 -2.63e-02 1.64e+00 68.520 56
=== Fluence/Peak Flux Summary ===
Model Band1 Band2 Band3 Band4 Band5 Total
15-25 25-50 50-100 100-350 15-150 15-350 keV
Fluence PL 1.26e-07 1.87e-07 2.07e-07 4.33e-07 6.52e-07 9.53e-07 erg/cm2
90%_error_low -2.52e-08 -2.54e-08 -4.45e-08 -1.62e-07 -1.03e-07 -2.13e-07 erg/cm2
90%_error_hi 2.61e-08 2.54e-08 4.49e-08 2.17e-07 1.05e-07 2.55e-07 erg/cm2
Peak flux PL 2.58e-01 2.52e-01 1.72e-01 1.83e-01 7.55e-01 8.65e-01 ph/cm2/s
90%_error_low -1.12e-01 -7.69e-02 -6.30e-02 -1.05e-01 -2.21e-01 -2.50e-01 ph/cm2/s
90%_error_hi 1.27e-01 7.57e-02 6.19e-02 1.60e-01 2.22e-01 2.52e-01 ph/cm2/s
Fluence CPL 1.24e-07 1.91e-07 2.07e-07 3.22e-07 6.42e-07 8.44e-07 erg/cm2
90%_error_low -2.75e-08 -2.87e-08 -4.67e-08 -2.49e-07 -1.15e-07 -2.85e-07 erg/cm2
90%_error_hi 2.77e-08 3.33e-08 4.63e-08 1.53e-07 1.12e-07 1.90e-07 erg/cm2
Peak flux CPL 1.99e-01 2.80e-01 1.94e-01 6.43e-02 7.21e-01 7.37e-01 ph/cm2/s
90%_error_low -1.34e-01 -9.12e-02 -7.53e-02 -6.43e-02 -2.31e-01 -2.45e-01 ph/cm2/s
90%_error_hi 1.54e-01 9.90e-02 7.98e-02 1.73e-01 2.30e-01 3.01e-01 ph/cm2/s
======================================================================
Image
Pre-slew 15.0-350.0 keV image (Event data)
#   RAcent    DECcent   POSerr    Theta     Phi              Peak Cts       SNR   Name
  147.5182   -42.3315   0.0189    34.1083    39.1001         1.1217662     10.133 TRIG_00548276

Foreground time interval of the image:
 -3.404  32.312 (delta_t =  35.716 [sec])
Background time interval of the image:
-239.368  -3.404 (delta_t = 235.964 [sec])
Light Curves
Note: The mask-weighted lightcurves have units of either count/det or counts/sec/det, where a det is 0.4 x 0.4 = 0.16 sq cm.
Full-time range; 1 s binning
Other quick-look light curves:
- 64 ms binning (zoomed)
- 16 ms binning (zoomed)
- 8 ms binning (zoomed)
- 2 ms binning (zoomed)
- SN=5 or 10 s binning (full-time range)
- Raw light curve
Spectra
- 64 ms binning (zoomed)
- 16 ms binning (zoomed)
- 8 ms binning (zoomed)
- 2 ms binning (zoomed)
- SN=5 or 10 s binning (full-time range)
- Raw light curve
Spectra
Notes:
- 1) The fitting includes the systematic errors.
- 2) When the burst includes telescope slew time periods, the fitting uses an average response file made from multiple 5-s response files through out the slew time plus single time preiod for the non-slew times, and weighted by the total counts in the corresponding time period using addrmf. An average response file is needed becuase a spectral fit using the pre-slew DRM will introduce some errors in both a spectral shape and a normalization if the PHA file contains a lot of the slew/post-slew time interval.
- 3) For fits to more complicated models (e.g. a power-law over a cutoff power-law), the BAT team has decided to require a chi-square improvement of more than 6 for each extra dof.
Time averaged spectrum fit using the average DRM
Power-law model

Time interval is from   -3.404 sec. to   32.312 sec.

Spectral model in power-law:
------------------------------------------------------------
Parameters  : value       lower 90%   higher 90%
Photon index: -1.85273     ( -0.255446   0.243409 )
Norm@50keV  : 1.98432E-03    ( -0.000319047   0.000310529 )
------------------------------------------------------------
#Fit statistic : Chi-Squared =          61.91 using 59 PHA bins.
# Reduced chi-squared =          1.086 for     57 degrees of freedom
# Null hypothesis probability =   3.051781e-01

Photon flux (15-150 keV)    in 35.72 sec: 0.279242 ( -0.0383  0.038326 ) ph/cm2/s
Energy fluence (15-150 keV)             : 6.51811e-07 ( -1.03154e-07  1.05094e-07 ) ergs/cm2
Cutoff power-law model
Time interval is from   -3.404 sec. to   32.312 sec.
Spectral model in the cutoff power-law:
------------------------------------------------------------
Parameters  : value       lower 90%   higher 90%
Photon index: -1.69209     ( -0.618229   0.975161 )
Epeak [keV] : 84.7415      ( -84.7204 -84.7415 )
Norm@50keV  : 2.44189E-03    ( -0.00244189   0.00615125 )
------------------------------------------------------------
#Fit statistic : Chi-Squared =          61.80 using 59 PHA bins.
# Reduced chi-squared =          1.104 for     56 degrees of freedom
# Null hypothesis probability =   2.766341e-01

Photon flux (15-150 keV)    in 35.72 sec: 0.277656 ( -0.039139  0.019684 ) ph/cm2/s
Energy fluence (15-150 keV)             : 6.41803e-07 ( -1.15408e-07  1.12371e-07 ) ergs/cm2
1-s peak spectrum fit
Power-law model
Time interval is from   -1.580 sec. to   -0.580 sec.

Spectral model in power-law:
------------------------------------------------------------
Parameters  : value       lower 90%   higher 90%
Photon index: -1.55388     ( -0.492169   0.465746 )
Norm@50keV  : 5.96080E-03    ( -0.0017918   0.00176072 )
------------------------------------------------------------
#Fit statistic : Chi-Squared =          69.77 using 59 PHA bins.
# Reduced chi-squared =          1.224 for     57 degrees of freedom
# Null hypothesis probability =   1.193639e-01

Photon flux (15-150 keV)    in 1 sec: 0.755478 ( -0.220854  0.221689 ) ph/cm2/s
Energy fluence (15-150 keV)             : 5.60919e-08 ( -1.76911e-08  1.80733e-08 ) ergs/cm2
Cutoff power-law model
Time interval is from   -1.580 sec. to   -0.580 sec.
Spectral model in the cutoff power-law:
------------------------------------------------------------
Parameters  : value       lower 90%   higher 90%
Photon index: -0.24015     ( -1.66296   3.68785 )
Epeak [keV] : 69.2655      ( -23.6272 -69.2666 )
Norm@50keV  : 2.63034E-02    ( -0.0263168   1.6449 )
------------------------------------------------------------
#Fit statistic : Chi-Squared =          68.52 using 59 PHA bins.
# Reduced chi-squared =          1.223 for     56 degrees of freedom
# Null hypothesis probability =   1.217200e-01

Photon flux (15-150 keV)    in 1 sec: 0.720856 ( -0.231069  0.22976 ) ph/cm2/s
Energy fluence (15-150 keV)             : 5.30078e-08 ( -1.80415e-08  1.87733e-08 ) ergs/cm2
Time-resolved spectra
Distribution
T90 vs. Hardness ratio plot
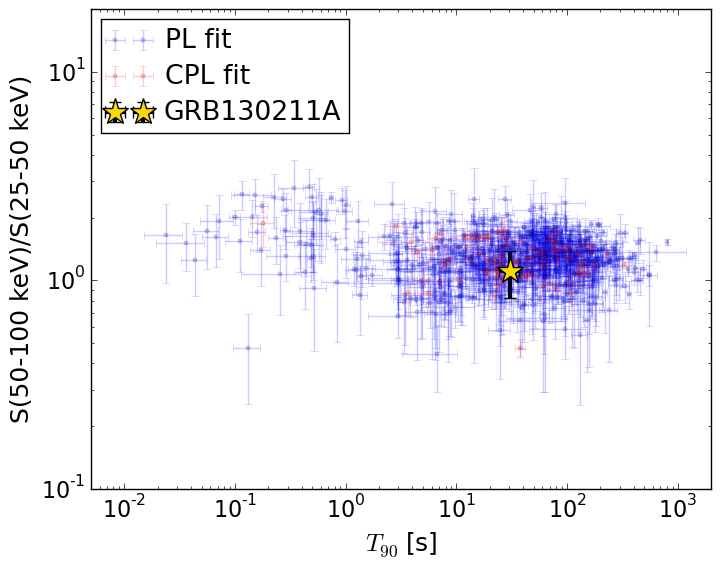
T90                                   = 30.752 sec.
Hardness ratio (energy fluence ratio) = 1.10751612798
S(15-50 keV) vs. S(50-150 keV) plot
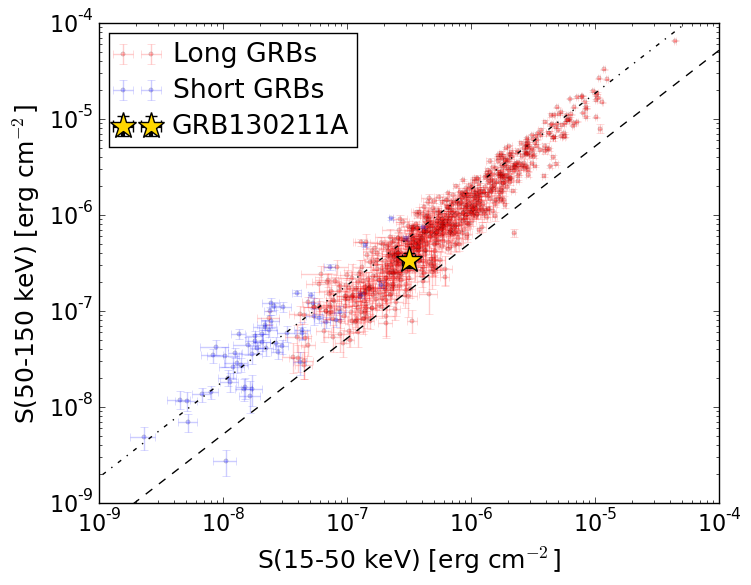
S(15-50 keV)  = 3.132416e-07
S(50-150 keV) = 3.385676e-07
The dash-dotted line and the dashed line traces the fluences calculated from the Band function with Epeak = 15 and 150 keV, respectively. Both lines assume a canonical values of alpha = -1 and beta = -2.5.
Mask shadow pattern
IMX = 5.255861683523052E-01, IMY = -4.271340771280909E-01
Spacecraft aspect plot
Bright source in the pre-burst/pre-slew/post-slew images
Pre-burst image of 15-350 keV band
Time interval of the image:
-239.368000 -3.404000

# RAcent  DECcent POSerr Theta    Phi  PeakCts   SNR AngSep     Name
#  [deg]    [deg]    ['] [deg]  [deg]                   [']
135.4586 -40.4910    3.0  42.8   34.1   1.5952   3.8    5.0	Vela X-1
170.2822 -60.6238    1.0  18.5   -1.0   1.9366  11.6    1.0	Cen X-3
186.6555 -62.5882    8.5  14.2  -25.4   0.2421   1.4   10.9	GX 301-2
244.9694 -15.6426    0.7  51.8 -157.1   8.4822  16.3    0.6	Sco X-1
256.1038 -37.8041    8.1  43.6 -125.9  -0.8284  -1.4    6.1	4U 1700-377
256.4443 -36.4238  112.3  44.6 -127.3   0.0624   0.1    0.4	GX 349+2
184.3435 -14.3026    2.7  36.5  116.2   1.8993   4.3 ------	UNKNOWN
197.0856 -13.5923    2.0  35.9  137.3   1.8929   5.6 ------	UNKNOWN
135.4406 -50.6938    3.0  38.0   20.2   1.0212   3.9 ------	UNKNOWN
150.6217 -49.2085    3.2  29.3   28.8   0.8085   3.6 ------	UNKNOWN
152.9373 -82.4213    2.6  35.4  -34.9   1.0714   4.4 ------	UNKNOWN
 54.4135 -70.5819    2.6  56.9  -29.8   4.7886   4.4 ------	UNKNOWN
Pre-slew background subtracted image of 15-350 keV band
Time interval of the image:
-3.404000 32.312000

# RAcent  DECcent POSerr Theta    Phi  PeakCts   SNR AngSep     Name
#  [deg]    [deg]    ['] [deg]  [deg]                   [']
135.7005 -40.5576    2.7  42.6   34.2   0.6473   4.2    7.8	Vela X-1
170.7014 -60.6750    7.6  18.3   -1.4   0.0924   1.5   11.8	Cen X-3
186.4241 -62.7042    6.5  14.3  -25.3   0.1025   1.8    7.5	GX 301-2
244.9822 -15.6377   67.6  51.8 -157.0   0.0287   0.2    0.2	Sco X-1
255.9612 -37.7143   14.4  43.5 -126.1  -0.1482  -0.8    7.9	4U 1700-377
256.5894 -36.3316    4.9  44.7 -127.3   0.4903   2.3    9.2	GX 349+2
147.5182 -42.3315    1.1  34.1   39.1   1.1218  10.1 ------	UNKNOWN
224.9184  -0.0585    2.3  55.1  171.7   1.6494   5.1 ------	UNKNOWN
Post-slew image of 15-350 keV band
Time interval of the image:
102.932620 463.532600

# RAcent  DECcent POSerr Theta    Phi  PeakCts   SNR AngSep     Name
#  [deg]    [deg]    ['] [deg]  [deg]                   [']
135.5040 -40.5747    0.9   9.2   10.3   2.7519  12.8    1.6	Vela X-1
170.3347 -60.6406    1.1  22.9 -116.0   2.9030  10.7    1.2	Cen X-3
186.6230 -62.6647    4.6  30.5 -121.6   0.8067   2.5    6.4	GX 301-2
150.5628 -16.3673    3.1  26.1   99.9   1.4150   3.7 ------	UNKNOWN
 66.3653 -58.1219    3.4  50.8  -44.5   4.6415   3.4 ------	UNKNOWN
117.8731 -82.2195    2.3  41.0  -80.9   5.0554   5.1 ------	UNKNOWN
 72.6462 -68.7927    3.2  45.7  -57.6   4.4650   3.6 ------	UNKNOWN