Analysis Summary
Notes:
- 1) No attempt has been made to eliminate the non-significant decimal places.
- 2) This batgrbproduct analysis is done using the HEASARC data.
- 3) This batgrbproduct analysis is using the flight position for the mask-weighting calculation.
======================================================================
                  BAT GRB EVENT DATA PROCESSING REPORT
    Process Script Ver: batgrbproduct v2.46
    Process Start Time: Sun Jan 12 05:17:20 EST 2014
             Host Name: batevent1
   Current Working Dir: /local/data/batevent/batevent_reproc/trigger548927
======================================================================

  Trigger: 00548927      Segment: 000

  BAT Trigger Time: 382745734.848   [s; MET]
      Trigger Stop: 382745735.872   [s; MET]
               UTC: 2013-02-16T22:15:24.622820    [includes UTCF correction]
       Where From?: TDRSS position message

  BAT
    RA: 67.8981836700403   Dec: 14.6647956247236  [deg; J2000]

     Catalogged Source?: NO
     Point Source?:      YES
     GRB Indicated?:     YES    [ by BAT flight software ]
     Image S/N Ratio:    20.84
     Image Trigger?:     NO
     Rate S/N Ratio:     59.9499791492875  [ if not an image trigger ]
     Image S/N Ratio:    20.84

  Analysis Position:   [ source = BAT ]
    RA: 67.8981836700403   Dec: 14.6647956247236  [deg; J2000]

  Refined Position:   [ source = BAT pre-slew burst ]
    RA: 67.9008255033316   Dec: 14.6693083113055  [deg; J2000]
        { 04h 31m 36.2s , +14d 40' 09.5" }
         +/- 0.646348025878027 [arcmin] (estimated 90% radius based on SNR)
         +/- 0.168300239262678 [arcmin] (formal 1-sigma fit error)
    SNR: 56.7388628594297

  Angular difference between the analysis and refined position is 0.311169 arcmin

  Partial Coding Fraction: 0.546875    [ including projection effects ]

  Duration
     T90: 6.51999998092651 +/- 1.08621174877495
        Measured from: -3.26800000667572
                   to: 3.25199997425079     [s; relative to TRIGTIME]
     T50: 3.69999998807907 +/- 0.173528101137716
        Measured from: -1.62000000476837
                   to: 2.0799999833107     [s; relative to TRIGTIME]


  Fluence
     Peak Flux  (peak 1 second)
        Measured from: 1.10799998044968
                   to: 2.10799998044968     [s; relative to TRIGTIME]
     Total Fluence
        Measured from: -6.1599999666214
                   to: 4.30800002813339     [s; relative to TRIGTIME]

             Band 1     Band 2     Band 3     Band 4
              15-25      25-50     50-100    100-350     keV
 Total     0.960253   1.622676   1.430902   0.364151
           0.029589   0.033373   0.030951   0.023331 [error]
 Peak      0.129712   0.258201   0.311907   0.116323
           0.009716   0.011903   0.012467   0.009148 [error]

     [ fluence units of on-axis counts / fully illuminated detector ]

======================================================================


====== Table of the duration information =============================

        Value   tstart    tstop
T100   10.468   -6.160    4.308
T90     6.520   -3.268    3.252
T50     3.700   -1.620    2.080
Peak    1.000    1.108    2.108


====== Spectral Analysis Summary =====================================

Model      : spectral model: simple power-law (PL) and cutoff power-law (CPL)
Ph_index   : photon index: E^{Ph_index}
Ph_90err   : 90% error of the photon index
Epeak      : Epeak in keV
Epeak_90err: 90% error of Epeak
Norm       : normalization at 50 keV in both the PL model and CPL model
Nomr_90err : 90% error of the normalization
chi2       : Chi-Squared
dof        : degree of freedo

=== Time-averaged spectral analysis ===
(Best model with acceptable fit: CPL)

Model Ph_index Ph_90err_low Ph_90err_hi  Epeak  Epeak_90err_low  Epeak_90err_hi  Norm       Nomr_90err_low    Norm_90err_hi    chi2    dof
PL      -1.352    -0.044      0.044       -           -               -         2.99e-02     -7.48e-04          7.48e-04      90.260   57
CPL     -0.812    -0.191      0.199      124.449     -19.030        36.710      5.21e-02     -9.10e-03          1.15e-02      65.280   56


=== 1-s peak spectral analysis ===
(Best model with acceptable fit: PL)

Model Ph_index Ph_90err_low Ph_90err_hi  Epeak  Epeak_90err_low  Epeak_90err_hi  Norm       Nomr_90err_low    Norm_90err_hi    chi2    dof
PL      -0.951     -0.078     0.079       -           -               -         5.64e-02     -2.63e-03          2.62e-03      61.760   57
CPL     -0.587     -0.319     0.343      229.803     -83.057       770.109      8.13e-02     -2.17e-02          3.20e-02      57.940   56


=== Fluence/Peak Flux Summary ===

              Model    Band1     Band2     Band3     Band4     Band5     Total
                       15-25     25-50    50-100    100-350    15-150    15-350    keV
Fluence         PL   3.48e-07  6.99e-07  1.10e-06  3.79e-06  3.05e-06  5.93e-06   erg/cm2
      90%_error_low -1.72e-08 -2.08e-08 -3.18e-08 -2.43e-07 -8.01e-08 -2.60e-07   erg/cm2
      90%_error_hi   1.76e-08  2.08e-08  3.17e-08  2.54e-07  8.02e-08  2.69e-07   erg/cm2
Peak flux       PL   1.38e+00  1.92e+00  1.99e+00  3.77e+00  6.48e+00  9.06e+00   ph/cm2/s
      90%_error_low -1.29e-01 -1.13e-01 -9.75e-02 -3.84e-01 -3.05e-01 -4.58e-01   ph/cm2/s
      90%_error_hi   1.34e-01  1.12e-01  9.72e-02  4.10e-01  3.06e-01  4.65e-01   ph/cm2/s

Fluence        CPL   3.03e-07  7.21e-07  1.15e-06  2.02e-06  2.97e-06  4.20e-06   erg/cm2
      90%_error_low -2.19e-08 -2.29e-08 -3.81e-08 -3.66e-07 -8.61e-08 -3.69e-07   erg/cm2
      90%_error_hi   2.24e-08  2.30e-08  3.83e-08  4.67e-07  8.59e-08  4.65e-07   erg/cm2
Peak flux      CPL   1.24e+00  1.96e+00  2.09e+00  2.68e+00  6.40e+00  7.96e+00   ph/cm2/s
      90%_error_low -1.66e-01 -1.20e-01 -1.28e-01 -6.63e-01 -3.12e-01 -7.34e-01   ph/cm2/s
      90%_error_hi   1.72e-01  1.21e-01  1.29e-01  9.49e-01  3.12e-01  9.74e-01   ph/cm2/s

======================================================================
Image
Pre-slew 15.0-350.0 keV image (Event data)
#   RAcent    DECcent   POSerr    Theta     Phi              Peak Cts       SNR   Name
   67.9008    14.6693   0.0034    32.5947   -48.0889         4.5594392     56.739 TRIG_00548927

Foreground time interval of the image:
 -6.160   4.308 (delta_t =  10.468 [sec])
Background time interval of the image:
-168.347  -6.160 (delta_t = 162.187 [sec])
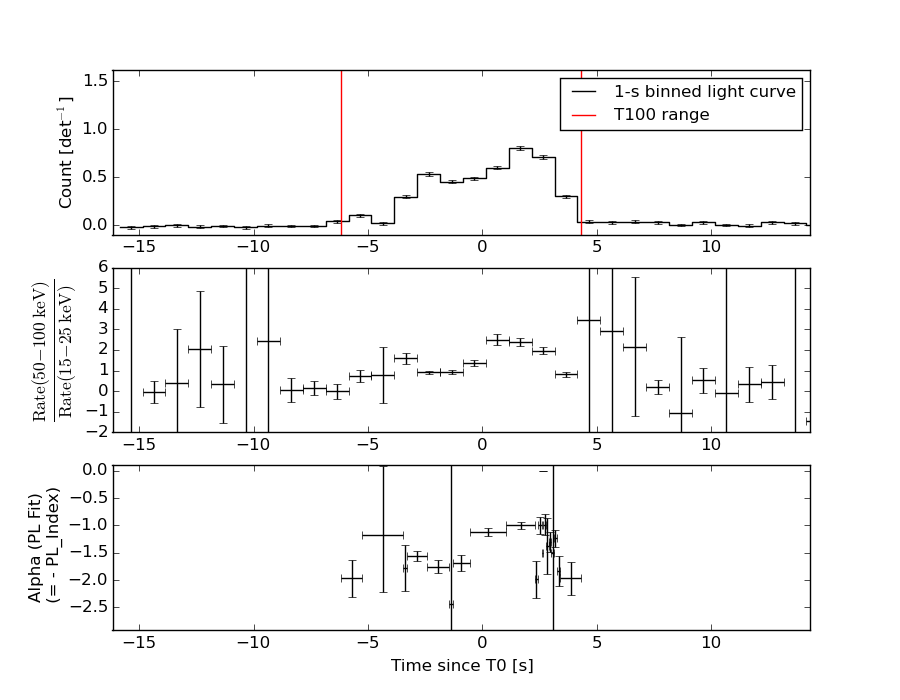
Light Curves
Note: The mask-weighted lightcurves have units of either count/det or counts/sec/det, where a det is 0.4 x 0.4 = 0.16 sq cm.
Full-time range; 1 s binning
Other quick-look light curves:
Spectra
Notes:
- 1) The fitting includes the systematic errors.
- 2) When the burst includes telescope slew time periods, the fitting uses an average response file made from multiple 5-s response files through out the slew time plus single time preiod for the non-slew times, and weighted by the total counts in the corresponding time period using addrmf. An average response file is needed becuase a spectral fit using the pre-slew DRM will introduce some errors in both a spectral shape and a normalization if the PHA file contains a lot of the slew/post-slew time interval.
- 3) For fits to more complicated models (e.g. a power-law over a cutoff power-law), the BAT team has decided to require a chi-square improvement of more than 6 for each extra dof.
Time averaged spectrum fit using the average DRM
Power-law model
Time interval is from   -6.160 sec. to    4.308 sec.

Spectral model in power-law:
------------------------------------------------------------
Parameters  : value       lower 90%   higher 90%
Photon index: -1.35226     ( -0.0444226   0.0445016 )
Norm@50keV  : 2.98586E-02    ( -0.000748457   0.000748359 )
------------------------------------------------------------
#Fit statistic : Chi-Squared =          90.26 using 59 PHA bins.
# Reduced chi-squared =          1.584 for     57 degrees of freedom
# Null hypothesis probability =   3.293068e-03

Photon flux (15-150 keV)    in 10.47 sec: 3.59882 ( -0.09822  0.09844 ) ph/cm2/s
Energy fluence (15-150 keV)             : 3.05209e-06 ( -8.01032e-08  8.02353e-08 ) ergs/cm2
Cutoff power-law model
Time interval is from   -6.160 sec. to    4.308 sec.
Spectral model in the cutoff power-law:
------------------------------------------------------------
Parameters  : value       lower 90%   higher 90%
Photon index: -0.812013     ( -0.191067   0.199335 )
Epeak [keV] : 124.449      ( -19.0295 36.7099 )
Norm@50keV  : 5.21105E-02    ( -0.00909516   0.0115217 )
------------------------------------------------------------
#Fit statistic : Chi-Squared =          65.28 using 59 PHA bins.
# Reduced chi-squared =          1.166 for     56 degrees of freedom
# Null hypothesis probability =   1.854768e-01

Photon flux (15-150 keV)    in 10.47 sec: 3.48422 ( -0.10464  0.10498 ) ph/cm2/s
Energy fluence (15-150 keV)             : 2.97048e-06 ( -8.61335e-08  8.59002e-08 ) ergs/cm2
1-s peak spectrum fit
Power-law model
Time interval is from    1.108 sec. to    2.108 sec.

Spectral model in power-law:
------------------------------------------------------------
Parameters  : value       lower 90%   higher 90%
Photon index: -0.950934     ( -0.0783464   0.0792066 )
Norm@50keV  : 5.64013E-02    ( -0.00262931   0.00262416 )
------------------------------------------------------------
#Fit statistic : Chi-Squared =          61.76 using 59 PHA bins.
# Reduced chi-squared =          1.083 for     57 degrees of freedom
# Null hypothesis probability =   3.100333e-01

Photon flux (15-150 keV)    in 1 sec: 6.48008 ( -0.30527  0.30553 ) ph/cm2/s
Energy fluence (15-150 keV)             : 6.20912e-07 ( -3.07653e-08  3.08514e-08 ) ergs/cm2
Cutoff power-law model
Time interval is from    1.108 sec. to    2.108 sec.
Spectral model in the cutoff power-law:
------------------------------------------------------------
Parameters  : value       lower 90%   higher 90%
Photon index: -0.587068     ( -0.318577   0.343211 )
Epeak [keV] : 229.803      ( -83.0571 770.109 )
Norm@50keV  : 8.12535E-02    ( -0.0216616   0.0320138 )
------------------------------------------------------------
#Fit statistic : Chi-Squared =          57.94 using 59 PHA bins.
# Reduced chi-squared =          1.035 for     56 degrees of freedom
# Null hypothesis probability =   4.037020e-01

Photon flux (15-150 keV)    in 1 sec: 6.40471 ( -0.3121  0.31232 ) ph/cm2/s
Energy fluence (15-150 keV)             : 6.1379e-07 ( -3.19682e-08  3.18345e-08 ) ergs/cm2
Time-resolved spectra
Distribution
T90 vs. Hardness ratio plot
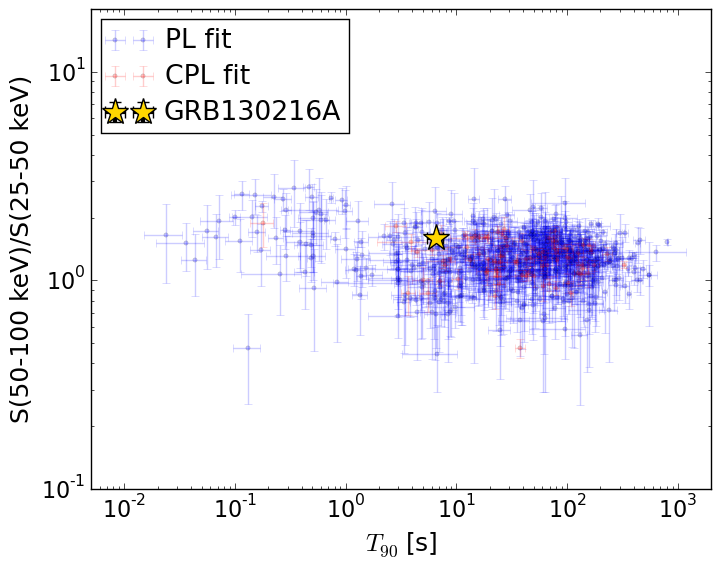
T90                                   = 6.52 sec.
Hardness ratio (energy fluence ratio) = 1.60003681725
S(15-50 keV) vs. S(50-150 keV) plot
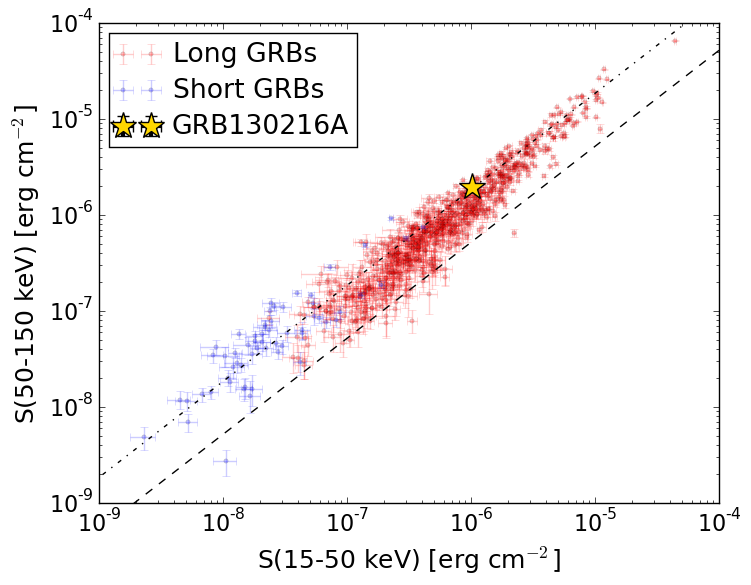
S(15-50 keV)  = 1.0247667e-06
S(50-150 keV) = 1.9457238e-06
The dash-dotted line and the dashed line traces the fluences calculated from the Band function with Epeak = 15 and 150 keV, respectively. Both lines assume a canonical values of alpha = -1 and beta = -2.5.
Mask shadow pattern
IMX = 4.271023482529318E-01, IMY = 4.758283727882991E-01
Spacecraft aspect plot
Bright source in the pre-burst/pre-slew/post-slew images
Pre-burst image of 15-350 keV band
Time interval of the image:
-168.347400 -6.160000

# RAcent  DECcent POSerr Theta    Phi  PeakCts   SNR AngSep     Name
#  [deg]    [deg]    ['] [deg]  [deg]                   [']
 83.6392  22.0178    0.3  22.5  -18.8   6.9641  42.1    0.4	Crab
115.8484  -1.9546    2.7  17.8  139.7   0.7244   4.4 ------	UNKNOWN
122.9684 -33.5864    3.0  45.2  176.4   1.2974   3.9 ------	UNKNOWN
 96.2496   7.7234    2.5   4.0  -39.4   0.7839   4.6 ------	UNKNOWN
112.2295 -50.8335    2.6  57.8 -165.4   3.9281   4.5 ------	UNKNOWN
 51.9266  15.0596    3.3  47.9  -51.2   2.9315   3.5 ------	UNKNOWN
Pre-slew background subtracted image of 15-350 keV band
Time interval of the image:
-6.160000 4.308000

# RAcent  DECcent POSerr Theta    Phi  PeakCts   SNR AngSep     Name
#  [deg]    [deg]    ['] [deg]  [deg]                   [']
 83.6477  22.0368   92.5  22.5  -18.8   0.0065   0.1    1.6	Crab
122.6391  33.4773    2.5  34.7   58.4   0.4057   4.6 ------	UNKNOWN
123.6321 -23.0828    2.6  37.2  166.0   0.3520   4.4 ------	UNKNOWN
 67.9008  14.6693    0.2  32.6  -48.1   4.5595  56.7 ------	UNKNOWN
 59.7713  -4.0701    2.0  41.3  -79.3   1.2641   5.7 ------	UNKNOWN
Post-slew image of 15-350 keV band
Time interval of the image: