Analysis Summary
Notes:
- 1) No attempt has been made to eliminate the non-significant decimal places.
- 2) This batgrbproduct analysis is done using the HEASARC data.
- 3) This batgrbproduct analysis is using the flight position for the mask-weighting calculation.
======================================================================
BAT GRB EVENT DATA PROCESSING REPORT
Process Script Ver: batgrbproduct v2.46
Process Start Time: Sun Jan 12 04:58:30 EST 2014
Host Name: batevent1
Current Working Dir: /local/data/batevent/batevent_reproc/trigger551126
======================================================================
Trigger: 00551126 Segment: 000
BAT Trigger Time: 385044343.296 [s; MET]
Trigger Stop: 385044355.456 [s; MET]
UTC: 2013-03-15T12:45:32.970220 [includes UTCF correction]
Where From?: TDRSS position message
BAT
RA: 157.542476803624 Dec: -51.8102228367283 [deg; J2000]
Catalogged Source?: NO
Point Source?: YES
GRB Indicated?: YES [ by BAT flight software ]
Image S/N Ratio: 8.07
Image Trigger?: NO
Rate S/N Ratio: 10.6301458127346 [ if not an image trigger ]
Image S/N Ratio: 8.07
Analysis Position: [ source = BAT ]
RA: 157.542476803624 Dec: -51.8102228367283 [deg; J2000]
Refined Position: [ source = BAT pre-slew burst ]
RA: 157.54192132379 Dec: -51.7952974134817 [deg; J2000]
{ 10h 30m 10.1s , -51d 47' 43.1" }
+/- 1.33822522045647 [arcmin] (estimated 90% radius based on SNR)
+/- 0.511332951102274 [arcmin] (formal 1-sigma fit error)
SNR: 20.0614520961373
Angular difference between the analysis and refined position is 0.895763 arcmin
Partial Coding Fraction: 0.421875 [ including projection effects ]
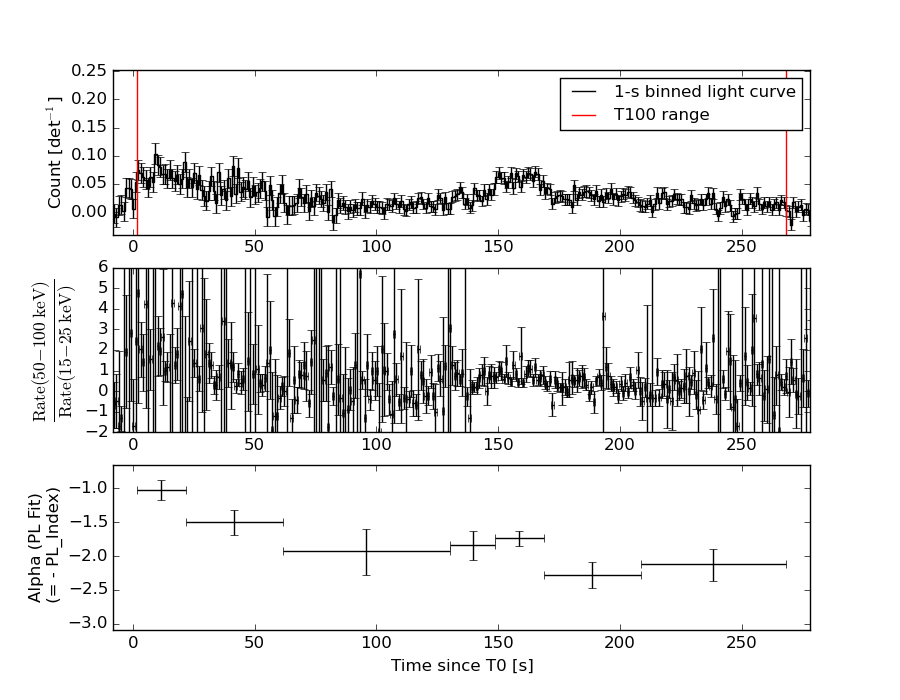
Duration
T90: 230.507999956608 +/- 17.9689910938007
Measured from: 7.63599997758865
to: 238.143999934196 [s; relative to TRIGTIME]
T50: 138.939999938011 +/- 9.95173307156065
Measured from: 34.3280000090599
to: 173.267999947071 [s; relative to TRIGTIME]
Fluence
Peak Flux (peak 1 second)
Measured from: 8.40799999237061
to: 9.40799999237061 [s; relative to TRIGTIME]
Total Fluence
Measured from: 1.6240000128746
to: 267.995999991894 [s; relative to TRIGTIME]
Band 1 Band 2 Band 3 Band 4
15-25 25-50 50-100 100-350 keV
Total 2.374187 2.916598 2.038402 0.405682
0.111176 0.113993 0.098584 0.081744 [error]
Peak 0.011009 0.044977 0.055766 0.007795
0.009266 0.010166 0.009385 0.007232 [error]
[ fluence units of on-axis counts / fully illuminated detector ]
======================================================================
====== Table of the duration information =============================
Value tstart tstop
T100 266.372 1.624 267.996
T90 230.508 7.636 238.144
T50 138.940 34.328 173.268
Peak 1.000 8.408 9.408
====== Spectral Analysis Summary =====================================
Model : spectral model: simple power-law (PL) and cutoff power-law (CPL)
Ph_index : photon index: E^{Ph_index}
Ph_90err : 90% error of the photon index
Epeak : Epeak in keV
Epeak_90err: 90% error of Epeak
Norm : normalization at 50 keV in both the PL model and CPL model
Nomr_90err : 90% error of the normalization
chi2 : Chi-Squared
dof : degree of freedo
=== Time-averaged spectral analysis ===
(Best model with acceptable fit: PL)
Model Ph_index Ph_90err_low Ph_90err_hi Epeak Epeak_90err_low Epeak_90err_hi Norm Nomr_90err_low Norm_90err_hi chi2 dof
PL -1.725 -0.084 0.083 - - - 1.84e-03 -8.86e-05 8.82e-05 70.960 57
CPL -1.342 -0.334 0.363 83.564 -19.887 191.004 2.89e-03 -9.23e-04 1.51e-03 67.090 56
=== 1-s peak spectral analysis ===
(Best model with acceptable fit: PL)
Model Ph_index Ph_90err_low Ph_90err_hi Epeak Epeak_90err_low Epeak_90err_hi Norm Nomr_90err_low Norm_90err_hi chi2 dof
PL -1.072 -0.362 0.396 - - - 8.38e-03 -2.08e-03 2.05e-03 64.440 57
CPL 0.487 -1.667 2.799 92.322 -28.125 -92.322 4.07e-02 -4.07e-02 4.74e-01 62.030 56
=== Fluence/Peak Flux Summary ===
Model Band1 Band2 Band3 Band4 Band5 Total
15-25 25-50 50-100 100-350 15-150 15-350 keV
Fluence PL 7.73e-07 1.24e-06 1.50e-06 3.55e-06 4.53e-06 7.06e-06 erg/cm2
90%_error_low -5.97e-08 -5.87e-08 -9.61e-08 -4.63e-07 -2.27e-07 -5.44e-07 erg/cm2
90%_error_hi 6.12e-08 5.86e-08 9.61e-08 5.08e-07 2.28e-07 5.78e-07 erg/cm2
Peak flux PL 2.29e-01 2.98e-01 2.83e-01 4.78e-01 9.69e-01 1.29e+00 ph/cm2/s
90%_error_low -1.00e-01 -9.22e-02 -6.89e-02 -1.97e-01 -2.46e-01 -3.06e-01 ph/cm2/s
90%_error_hi 1.19e-01 9.10e-02 6.85e-02 2.65e-01 2.50e-01 3.11e-01 ph/cm2/s
Fluence CPL 7.25e-07 1.28e-06 1.52e-06 2.01e-06 4.39e-06 5.54e-06 erg/cm2
90%_error_low -7.21e-08 -7.09e-08 -1.02e-07 -7.37e-07 -2.58e-07 -7.81e-07 erg/cm2
90%_error_hi 7.31e-08 7.21e-08 1.03e-07 1.27e-06 2.58e-07 1.28e-06 erg/cm2
Peak flux CPL 1.51e-01 3.21e-01 3.40e-01 1.65e-01 9.28e-01 9.78e-01 ph/cm2/s
90%_error_low -1.07e-01 -1.12e-01 -9.26e-02 -1.65e-01 -2.48e-01 -2.83e-01 ph/cm2/s
90%_error_hi 1.41e-01 1.11e-01 9.80e-02 3.91e-01 2.54e-01 4.15e-01 ph/cm2/s
======================================================================
Image
Pre-slew 15.0-350.0 keV image (Event data)
#   RAcent    DECcent   POSerr    Theta     Phi              Peak Cts       SNR   Name
  157.5419   -51.7953   0.0096    43.9895    -0.5539         3.0014198     20.061 TRIG_00551126

Foreground time interval of the image:
  1.624  60.805 (delta_t =  59.181 [sec])
Background time interval of the image:
-239.296   1.624 (delta_t = 240.920 [sec])
Light Curves
Note: The mask-weighted lightcurves have units of either count/det or counts/sec/det, where a det is 0.4 x 0.4 = 0.16 sq cm.
Full-time range; 1 s binning
Other quick-look light curves:
- 64 ms binning (zoomed)
- 16 ms binning (zoomed)
- 8 ms binning (zoomed)
- 2 ms binning (zoomed)
- SN=5 or 10 s binning (full-time range)
- Raw light curve
Spectra
- 64 ms binning (zoomed)
- 16 ms binning (zoomed)
- 8 ms binning (zoomed)
- 2 ms binning (zoomed)
- SN=5 or 10 s binning (full-time range)
- Raw light curve
Spectra
Notes:
- 1) The fitting includes the systematic errors.
- 2) When the burst includes telescope slew time periods, the fitting uses an average response file made from multiple 5-s response files through out the slew time plus single time preiod for the non-slew times, and weighted by the total counts in the corresponding time period using addrmf. An average response file is needed becuase a spectral fit using the pre-slew DRM will introduce some errors in both a spectral shape and a normalization if the PHA file contains a lot of the slew/post-slew time interval.
- 3) For fits to more complicated models (e.g. a power-law over a cutoff power-law), the BAT team has decided to require a chi-square improvement of more than 6 for each extra dof.
Time averaged spectrum fit using the average DRM
Power-law model
Time interval is from    1.624 sec. to  267.996 sec.

Spectral model in power-law:
------------------------------------------------------------
Parameters  : value       lower 90%   higher 90%
Photon index: -1.72532     ( -0.0841517   0.0833578 )
Norm@50keV  : 1.83911E-03    ( -8.86058e-05   8.82366e-05 )
------------------------------------------------------------
#Fit statistic : Chi-Squared =          70.96 using 59 PHA bins.
# Reduced chi-squared =          1.245 for     57 degrees of freedom
# Null hypothesis probability =   1.011420e-01

Photon flux (15-150 keV)    in 266.4 sec: 0.246466 ( -0.011795  0.011819 ) ph/cm2/s
Energy fluence (15-150 keV)             : 4.52851e-06 ( -2.26568e-07  2.27629e-07 ) ergs/cm2
Cutoff power-law model
Time interval is from    1.624 sec. to  267.996 sec.
Spectral model in the cutoff power-law:
------------------------------------------------------------
Parameters  : value       lower 90%   higher 90%
Photon index: -1.34163     ( -0.334473   0.362809 )
Epeak [keV] : 83.5640      ( -19.8877 191.003 )
Norm@50keV  : 2.89137E-03    ( -0.000922551   0.00150532 )
------------------------------------------------------------
#Fit statistic : Chi-Squared =          67.09 using 59 PHA bins.
# Reduced chi-squared =          1.198 for     56 degrees of freedom
# Null hypothesis probability =   1.473971e-01

Photon flux (15-150 keV)    in 266.4 sec: 0.241087 ( -0.012654  0.012666 ) ph/cm2/s
Energy fluence (15-150 keV)             : 4.38686e-06 ( -2.58154e-07  2.58015e-07 ) ergs/cm2
1-s peak spectrum fit
Power-law model
Time interval is from    8.408 sec. to    9.408 sec.

Spectral model in power-law:
------------------------------------------------------------
Parameters  : value       lower 90%   higher 90%
Photon index: -1.07164     ( -0.362549   0.395927 )
Norm@50keV  : 8.37679E-03    ( -0.00207923   0.00204806 )
------------------------------------------------------------
#Fit statistic : Chi-Squared =          64.44 using 59 PHA bins.
# Reduced chi-squared =          1.131 for     57 degrees of freedom
# Null hypothesis probability =   2.324737e-01

Photon flux (15-150 keV)    in 1 sec: 0.969134 ( -0.246242  0.249866 ) ph/cm2/s
Energy fluence (15-150 keV)             : 8.84016e-08 ( -2.12788e-08  2.13119e-08 ) ergs/cm2
Cutoff power-law model
Time interval is from    8.408 sec. to    9.408 sec.
Spectral model in the cutoff power-law:
------------------------------------------------------------
Parameters  : value       lower 90%   higher 90%
Photon index: 0.487317     ( -1.6674   2.79888 )
Epeak [keV] : 92.3218      ( -28.1254 -92.3219 )
Norm@50keV  : 4.07363E-02    ( -0.0407362   0.474174 )
------------------------------------------------------------
#Fit statistic : Chi-Squared =          62.03 using 59 PHA bins.
# Reduced chi-squared =          1.108 for     56 degrees of freedom
# Null hypothesis probability =   2.699571e-01

Photon flux (15-150 keV)    in 1 sec: 0.927592 ( -0.248274  0.253708 ) ph/cm2/s
Energy fluence (15-150 keV)             : 8.46233e-08 ( -2.24348e-08  2.23314e-08 ) ergs/cm2
Time-resolved spectra
Distribution
T90 vs. Hardness ratio plot
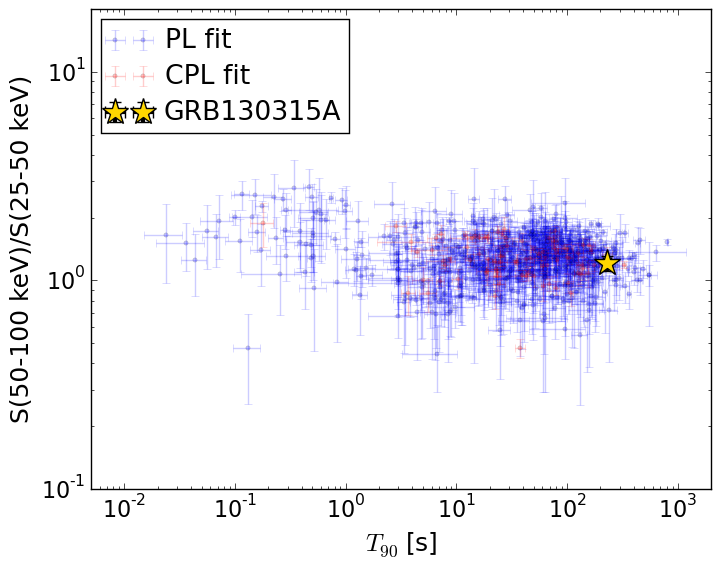
T90                                   = 230.508 sec.
Hardness ratio (energy fluence ratio) = 1.20976191841
S(15-50 keV) vs. S(50-150 keV) plot
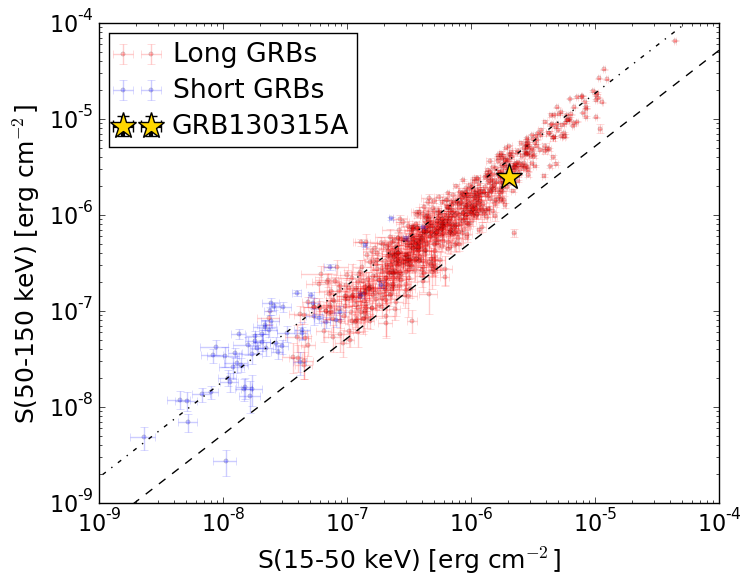
S(15-50 keV)  = 2.011831e-06
S(50-150 keV) = 2.516672e-06
The dash-dotted line and the dashed line traces the fluences calculated from the Band function with Epeak = 15 and 150 keV, respectively. Both lines assume a canonical values of alpha = -1 and beta = -2.5.
Mask shadow pattern
IMX = 9.652878819943155E-01, IMY = 9.332824055802651E-03
Spacecraft aspect plot
Bright source in the pre-burst/pre-slew/post-slew images
Pre-burst image of 15-350 keV band
Time interval of the image:
-239.296000 1.624000

# RAcent  DECcent POSerr Theta    Phi  PeakCts   SNR AngSep     Name
#  [deg]    [deg]    ['] [deg]  [deg]                   [']
135.5418 -40.6005    4.6  50.9   23.3   1.9344   2.5    2.8	Vela X-1
170.5743 -60.6067    5.0  47.9  -15.4   0.8009   2.3    7.7	Cen X-3
186.3186 -62.7987  178.7  48.9  -25.7  -0.0241  -0.1    9.4	GX 301-2
172.3388  30.5519    2.2  46.2  139.1   3.8983   5.2 ------	UNKNOWN
133.6641 -51.7266    2.6  55.9   10.8   4.5460   4.4 ------	UNKNOWN
202.4839  -5.9203    3.0  18.6 -139.0   0.6835   3.8 ------	UNKNOWN
225.2939  31.0733    2.2  59.1 -165.4   7.3814   5.4 ------	UNKNOWN
162.5097 -71.8780    3.1  59.6  -17.1   4.5594   3.7 ------	UNKNOWN
193.0761 -62.9208    3.3  49.3  -29.8   1.3724   3.6 ------	UNKNOWN
Pre-slew background subtracted image of 15-350 keV band
Time interval of the image:
1.624000 60.804600

# RAcent  DECcent POSerr Theta    Phi  PeakCts   SNR AngSep     Name
#  [deg]    [deg]    ['] [deg]  [deg]                   [']
135.4848 -40.4281    5.5  50.9   23.5  -0.7477  -2.1    7.9	Vela X-1
170.2624 -60.5589    3.9  47.9  -15.2   0.4670   3.0    4.2	Cen X-3
186.3233 -62.8733   10.3  49.0  -25.7   0.2186   1.1   11.0	GX 301-2
157.5419 -51.7953    0.6  44.0   -0.6   3.0019  20.1 ------	UNKNOWN
165.1126 -70.2632    2.2  57.7  -17.2   2.0820   5.2 ------	UNKNOWN
Post-slew image of 15-350 keV band
Time interval of the image:
148.604600 585.904650

# RAcent  DECcent POSerr Theta    Phi  PeakCts   SNR AngSep     Name
#  [deg]    [deg]    ['] [deg]  [deg]                   [']
135.5866 -40.5201    1.8  18.8    6.5   1.7071   6.6    3.4	Vela X-1
170.4059 -60.5864    1.6  11.3 -145.5   2.1937   7.1    3.4	Cen X-3
186.3369 -62.8533    6.8  18.8 -154.5   0.5168   1.7   10.1	GX 301-2
145.1730 -16.6425    3.5  36.5   48.2   1.7409   3.3 ------	UNKNOWN
157.5321 -51.7906    0.8   0.0  -81.0   3.5937  13.8 ------	UNKNOWN
 50.1829 -81.9327    3.3  41.2  -99.9   6.1717   3.5 ------	UNKNOWN