Analysis Summary
Notes:
- 1) No attempt has been made to eliminate the non-significant decimal places.
- 2) This batgrbproduct analysis is done using the HEASARC data.
- 3) This batgrbproduct analysis is using the flight position for the mask-weighting calculation.
======================================================================
                  BAT GRB EVENT DATA PROCESSING REPORT
    Process Script Ver: batgrbproduct v2.46
    Process Start Time: Sun Jan 12 04:52:21 EST 2014
             Host Name: batevent1
   Current Working Dir: /local/data/batevent/batevent_reproc/trigger552063
======================================================================

  Trigger: 00552063      Segment: 000

  BAT Trigger Time: 386041664.384   [s; MET]
      Trigger Stop: 386041666.432   [s; MET]
               UTC: 2013-03-27T01:47:34.014540    [includes UTCF correction]
       Where From?: TDRSS position message

  BAT
    RA: 91.9916773554106   Dec: 55.7304273950613  [deg; J2000]

     Catalogged Source?: NO
     Point Source?:      YES
     GRB Indicated?:     YES    [ by BAT flight software ]
     Image S/N Ratio:    7.19
     Image Trigger?:     NO
     Rate S/N Ratio:     8.60232526704263  [ if not an image trigger ]
     Image S/N Ratio:    7.19

  Analysis Position:   [ source = BAT ]
    RA: 91.9916773554106   Dec: 55.7304273950613  [deg; J2000]

  Refined Position:   [ source = BAT pre-slew burst ]
    RA: 91.9789599524498   Dec: 55.7285079971054  [deg; J2000]
        { 06h 07m 55.0s , +55d 43' 42.6" }
         +/- 2.17733765792573 [arcmin] (estimated 90% radius based on SNR)
         +/- 1.27578125513632 [arcmin] (formal 1-sigma fit error)
    SNR: 10.0084600524701

  Angular difference between the analysis and refined position is 0.444837 arcmin

  Partial Coding Fraction: 0.6171875    [ including projection effects ]

  Duration
     T90: 6.37199997901917 +/- 1.40803551100794
        Measured from: -1.89200001955032
                   to: 4.47999995946884     [s; relative to TRIGTIME]
     T50: 2.49199998378754 +/- 1.73239830253822
        Measured from: 0.603999972343445
                   to: 3.09599995613098     [s; relative to TRIGTIME]


  Fluence
     Peak Flux  (peak 1 second)
        Measured from: 0.283999979496002
                   to: 1.283999979496     [s; relative to TRIGTIME]
     Total Fluence
        Measured from: -2.2960000038147
                   to: 5.74400001764297     [s; relative to TRIGTIME]

             Band 1     Band 2     Band 3     Band 4
              15-25      25-50     50-100    100-350     keV
 Total     0.167395   0.147101   0.091400  -0.000906
           0.021134   0.022013   0.019053   0.017123 [error]
 Peak      0.042511   0.044535   0.021855  -0.003081
           0.007455   0.008021   0.007022   0.005835 [error]

     [ fluence units of on-axis counts / fully illuminated detector ]

======================================================================


====== Table of the duration information =============================

        Value   tstart    tstop
T100    8.040   -2.296    5.744
T90     6.372   -1.892    4.480
T50     2.492    0.604    3.096
Peak    1.000    0.284    1.284


====== Spectral Analysis Summary =====================================

Model      : spectral model: simple power-law (PL) and cutoff power-law (CPL)
Ph_index   : photon index: E^{Ph_index}
Ph_90err   : 90% error of the photon index
Epeak      : Epeak in keV
Epeak_90err: 90% error of Epeak
Norm       : normalization at 50 keV in both the PL model and CPL model
Nomr_90err : 90% error of the normalization
chi2       : Chi-Squared
dof        : degree of freedo

=== Time-averaged spectral analysis ===
(Best model with acceptable fit: PL)

Model Ph_index Ph_90err_low Ph_90err_hi  Epeak  Epeak_90err_low  Epeak_90err_hi  Norm       Nomr_90err_low    Norm_90err_hi    chi2    dof
PL      -2.165    -0.332      0.297       -           -               -         3.01e-03     -6.63e-04          6.32e-04      55.030   57
CPL     -2.315    -0.272      0.995      134.244      N/A           N/A         2.48e-03        N/A               N/A         54.880   56


=== 1-s peak spectral analysis ===
(Best model with acceptable fit: PL)

Model Ph_index Ph_90err_low Ph_90err_hi  Epeak  Epeak_90err_low  Epeak_90err_hi  Norm       Nomr_90err_low    Norm_90err_hi    chi2    dof
PL      -2.198     -0.442     0.378       -           -               -         6.35e-03     -1.90e-03          1.80e-03      39.360   57
CPL     -2.409     -0.228     1.593      162.624      N/A           N/A         4.88e-03        N/A               N/A         39.330   56


=== Fluence/Peak Flux Summary ===

              Model    Band1     Band2     Band3     Band4     Band5     Total
                       15-25     25-50    50-100    100-350    15-150    15-350    keV
Fluence         PL   5.80e-08  7.13e-08  6.36e-08  9.80e-08  2.27e-07  2.91e-07   erg/cm2
      90%_error_low -1.15e-08 -1.11e-08 -1.86e-08 -4.66e-08 -4.18e-08 -7.15e-08   erg/cm2
      90%_error_hi   1.18e-08  1.09e-08  1.94e-08  6.83e-08  4.33e-08  8.81e-08   erg/cm2
Peak flux       PL   5.13e-01  3.43e-01  1.49e-01  8.98e-02  1.05e+00  1.10e+00   ph/cm2/s
      90%_error_low -1.30e-01 -7.01e-02 -5.61e-02 -5.06e-02 -2.02e-01 -2.14e-01   ph/cm2/s
      90%_error_hi   1.33e-01  6.86e-02  5.93e-02  7.95e-02  2.02e-01  2.16e-01   ph/cm2/s

Fluence        CPL   5.61e-08  6.58e-08  6.32e-08  7.81e-08  2.27e-07  2.71e-07   erg/cm2
      90%_error_low -9.93e-09 -3.25e-08    N/A       N/A       N/A       N/A      erg/cm2
      90%_error_hi   1.14e-08  1.59e-08    N/A       N/A       N/A       N/A      erg/cm2
Peak flux      CPL   5.11e-01  3.25e-01  1.39e-01  9.39e-02  1.02e+00  1.07e+00   ph/cm2/s
      90%_error_low -1.49e-01 -1.75e-01 -1.39e-01     N/A   -4.27e-01     N/A     ph/cm2/s
      90%_error_hi   1.36e-01  8.50e-02  6.65e-02     N/A    2.35e-01     N/A     ph/cm2/s

======================================================================
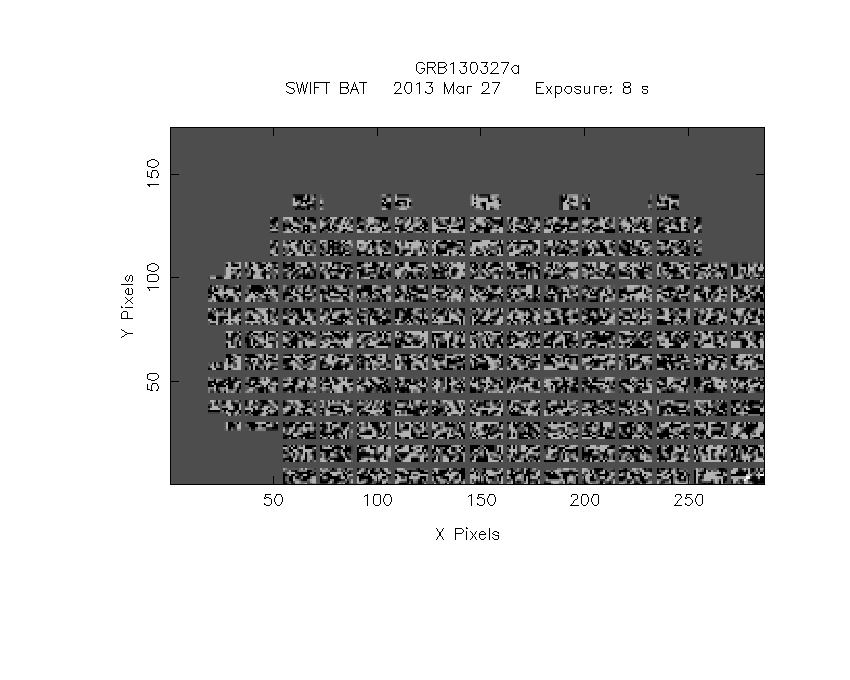
Image
Pre-slew 15.0-350.0 keV image (Event data)
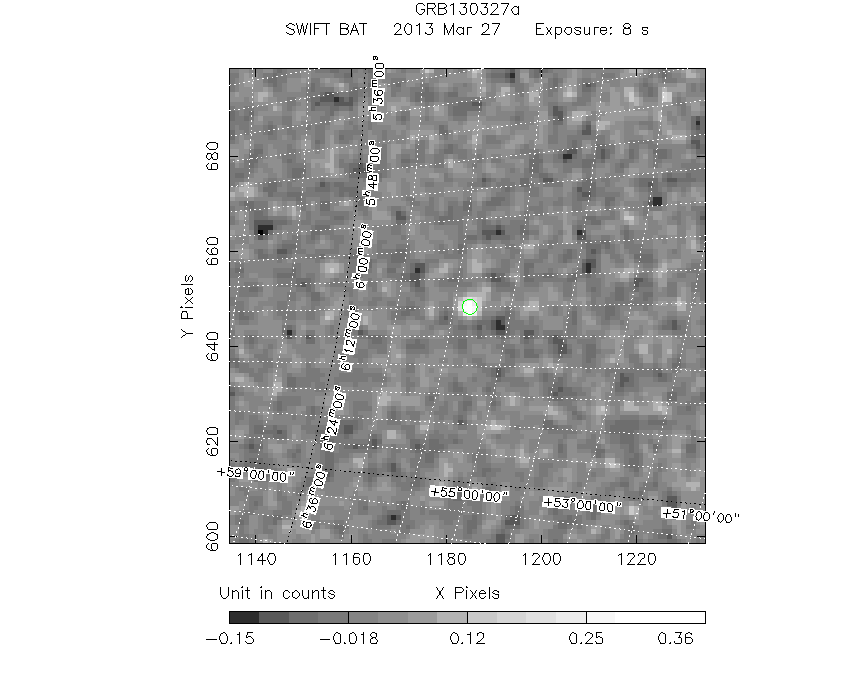
#   RAcent    DECcent   POSerr    Theta     Phi              Peak Cts       SNR   Name
   91.9790    55.7285   0.0192    36.3509  -150.6459         0.4060423     10.008 TRIG_00552063

Foreground time interval of the image:
 -2.296   5.744 (delta_t =   8.040 [sec])
Background time interval of the image:
-89.683  -2.296 (delta_t =  87.387 [sec])
Light Curves
Note: The mask-weighted lightcurves have units of either count/det or counts/sec/det, where a det is 0.4 x 0.4 = 0.16 sq cm.
Full-time range; 1 s binning
Other quick-look light curves:
- 64 ms binning (zoomed)
- 16 ms binning (zoomed)
- 8 ms binning (zoomed)
- 2 ms binning (zoomed)
- SN=5 or 10 s binning (full-time range)
- Raw light curve
Spectra
- 64 ms binning (zoomed)
- 16 ms binning (zoomed)
- 8 ms binning (zoomed)
- 2 ms binning (zoomed)
- SN=5 or 10 s binning (full-time range)
- Raw light curve
Spectra
Notes:
- 1) The fitting includes the systematic errors.
- 2) When the burst includes telescope slew time periods, the fitting uses an average response file made from multiple 5-s response files through out the slew time plus single time preiod for the non-slew times, and weighted by the total counts in the corresponding time period using addrmf. An average response file is needed becuase a spectral fit using the pre-slew DRM will introduce some errors in both a spectral shape and a normalization if the PHA file contains a lot of the slew/post-slew time interval.
- 3) For fits to more complicated models (e.g. a power-law over a cutoff power-law), the BAT team has decided to require a chi-square improvement of more than 6 for each extra dof.
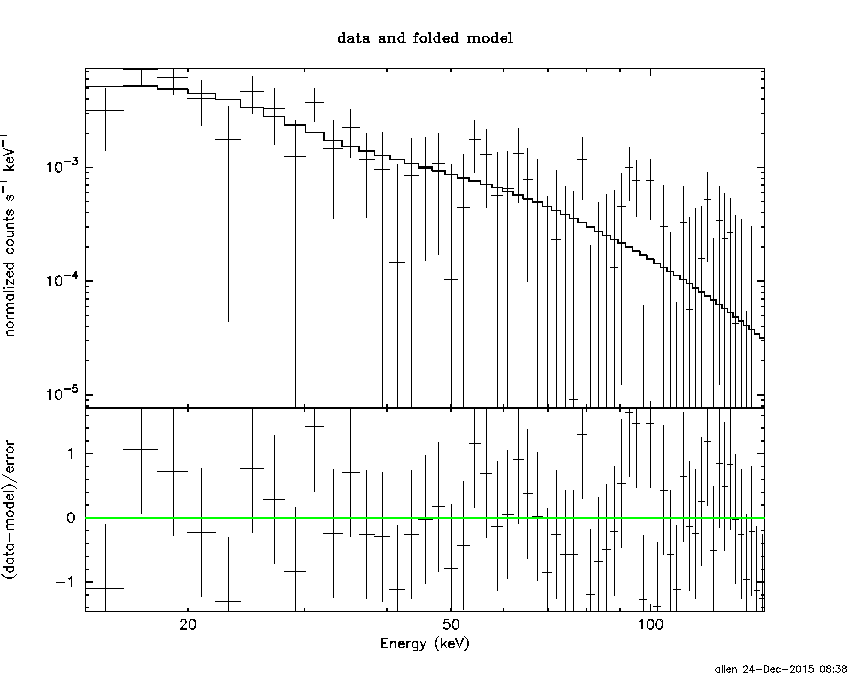
Time averaged spectrum fit using the average DRM
Power-law model
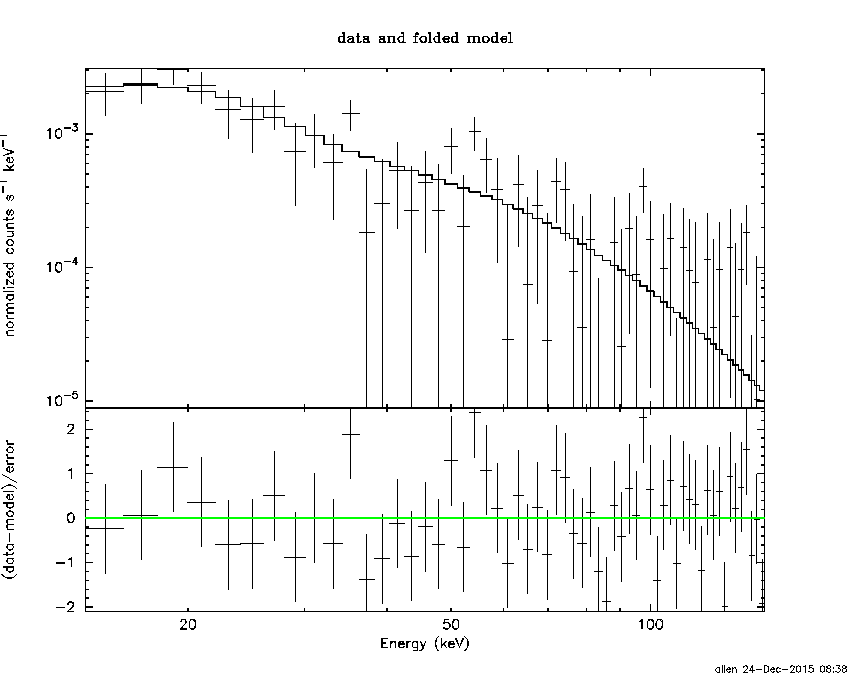
Time interval is from   -2.296 sec. to    5.744 sec.

Spectral model in power-law:
------------------------------------------------------------
Parameters  : value       lower 90%   higher 90%
Photon index: -2.16507     ( -0.332479   0.296776 )
Norm@50keV  : 3.01483E-03    ( -0.000662641   0.000632131 )
------------------------------------------------------------
#Fit statistic : Chi-Squared =          55.03 using 59 PHA bins.
# Reduced chi-squared =         0.9655 for     57 degrees of freedom
# Null hypothesis probability =   5.492533e-01

Photon flux (15-150 keV)    in 8.04 sec: 0.490174 ( -0.071731  0.071733 ) ph/cm2/s
Energy fluence (15-150 keV)             : 2.26885e-07 ( -4.18446e-08  4.3297e-08 ) ergs/cm2
Cutoff power-law model
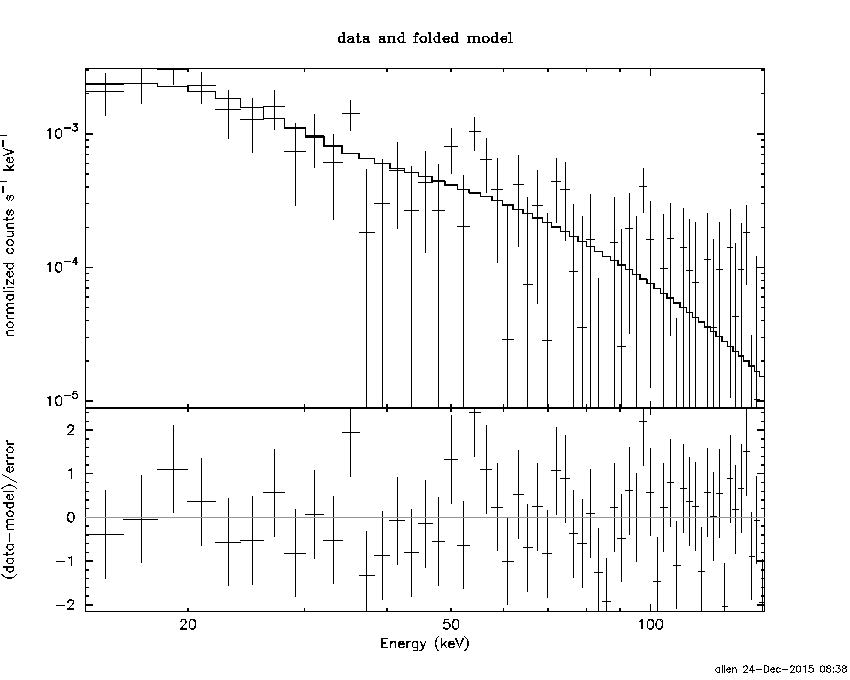
Time interval is from   -2.296 sec. to    5.744 sec.
Spectral model in the cutoff power-law:
------------------------------------------------------------
Parameters  : value       lower 90%   higher 90%
Photon index: -2.37401     ( -0.21277   1.0541 )
Epeak [keV] : 150.348      (   )
Norm@50keV  : 2.32958E-03    (     )
------------------------------------------------------------
#Fit statistic : Chi-Squared =          54.87 using 59 PHA bins.
# Reduced chi-squared =         0.9798 for     56 degrees of freedom
# Null hypothesis probability =   5.177368e-01

Photon flux (15-150 keV)    in 8.04 sec: 0.486892 ( -0.071272  0.071398 ) ph/cm2/s
Energy fluence (15-150 keV)             : 2.26603e-07 ( 0  0 ) ergs/cm2
1-s peak spectrum fit
Power-law model
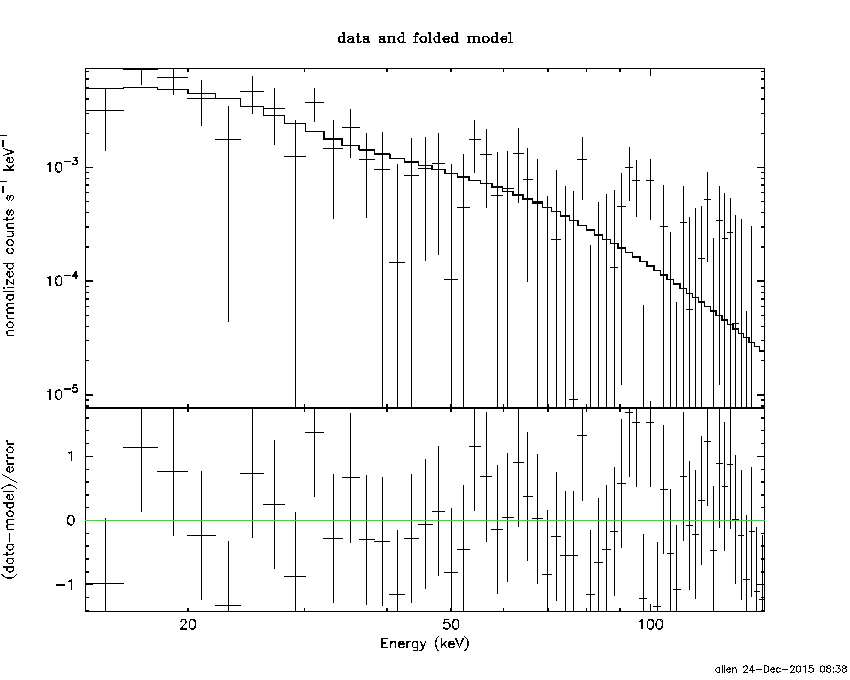
Time interval is from    0.284 sec. to    1.284 sec.

Spectral model in power-law:
------------------------------------------------------------
Parameters  : value       lower 90%   higher 90%
Photon index: -2.19771     ( -0.441886   0.378384 )
Norm@50keV  : 6.34830E-03    ( -0.00189773   0.00180362 )
------------------------------------------------------------
#Fit statistic : Chi-Squared =          39.36 using 59 PHA bins.
# Reduced chi-squared =         0.6905 for     57 degrees of freedom
# Null hypothesis probability =   9.638948e-01

Photon flux (15-150 keV)    in 1 sec: 1.04982 ( -0.20158  0.20161 ) ph/cm2/s
Energy fluence (15-150 keV)             : 5.96802e-08 ( -1.46421e-08  1.53645e-08 ) ergs/cm2
Cutoff power-law model
Time interval is from    0.284 sec. to    1.284 sec.
Spectral model in the cutoff power-law:
------------------------------------------------------------
Parameters  : value       lower 90%   higher 90%
Photon index: -2.40948     ( -0.235226   1.58518 )
Epeak [keV] : 162.624      (   )
Norm@50keV  : 4.88295E-03    (     )
------------------------------------------------------------
#Fit statistic : Chi-Squared =          39.33 using 59 PHA bins.
# Reduced chi-squared =         0.7022 for     56 degrees of freedom
# Null hypothesis probability =   9.555910e-01

Photon flux (15-150 keV)    in 1 sec: 1.01772 ( -0.426584  0.23501 ) ph/cm2/s
Energy fluence (15-150 keV)             : 0 ( 0  0 ) ergs/cm2
Time-resolved spectra
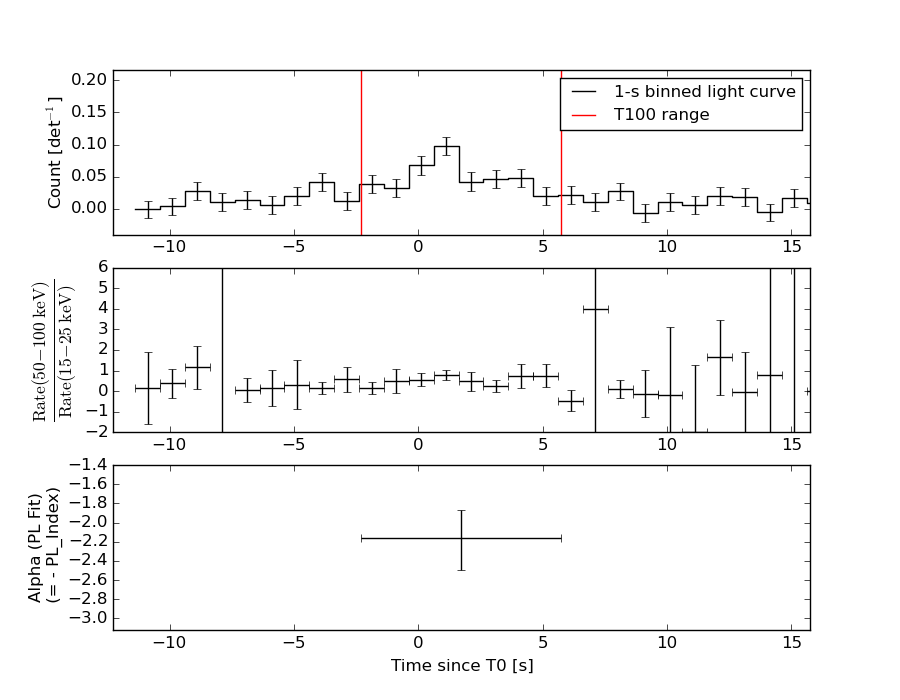
Distribution
T90 vs. Hardness ratio plot
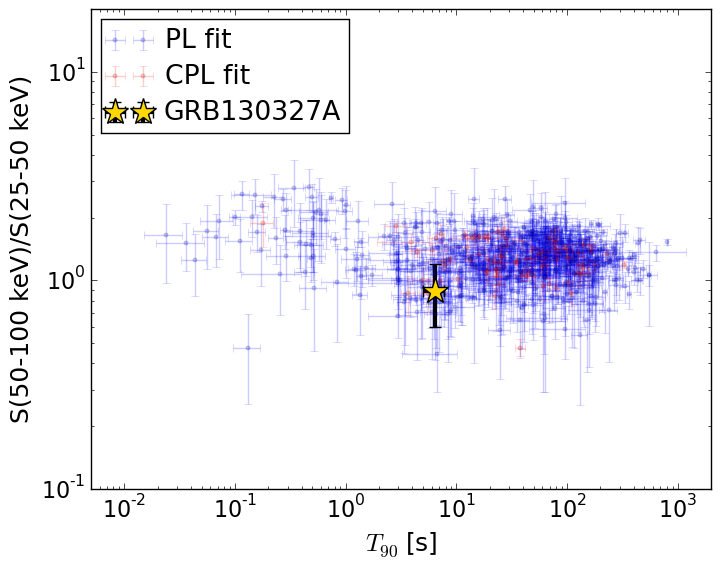
T90                                   = 6.372 sec.
Hardness ratio (energy fluence ratio) = 0.891928410051
S(15-50 keV) vs. S(50-150 keV) plot
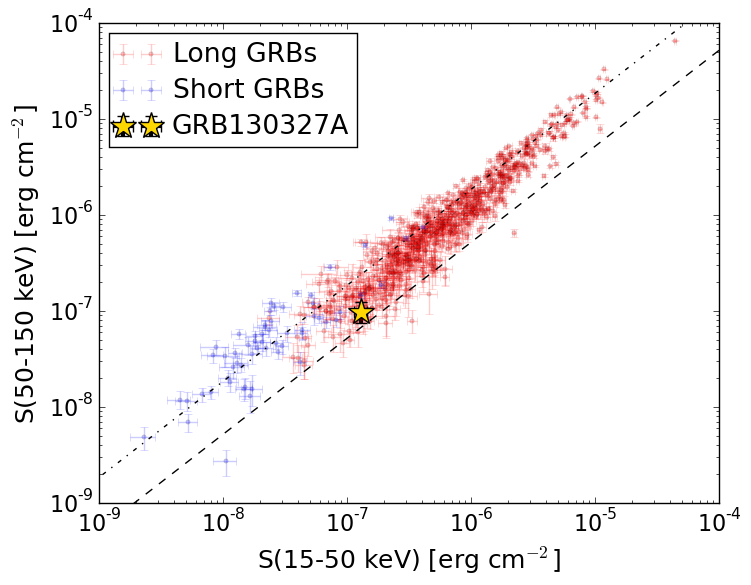
S(15-50 keV)  = 1.2932886e-07
S(50-150 keV) = 9.755767e-08
The dash-dotted line and the dashed line traces the fluences calculated from the Band function with Epeak = 15 and 150 keV, respectively. Both lines assume a canonical values of alpha = -1 and beta = -2.5.
Mask shadow pattern
IMX = -6.414519398469432E-01, IMY = 3.607626099574490E-01
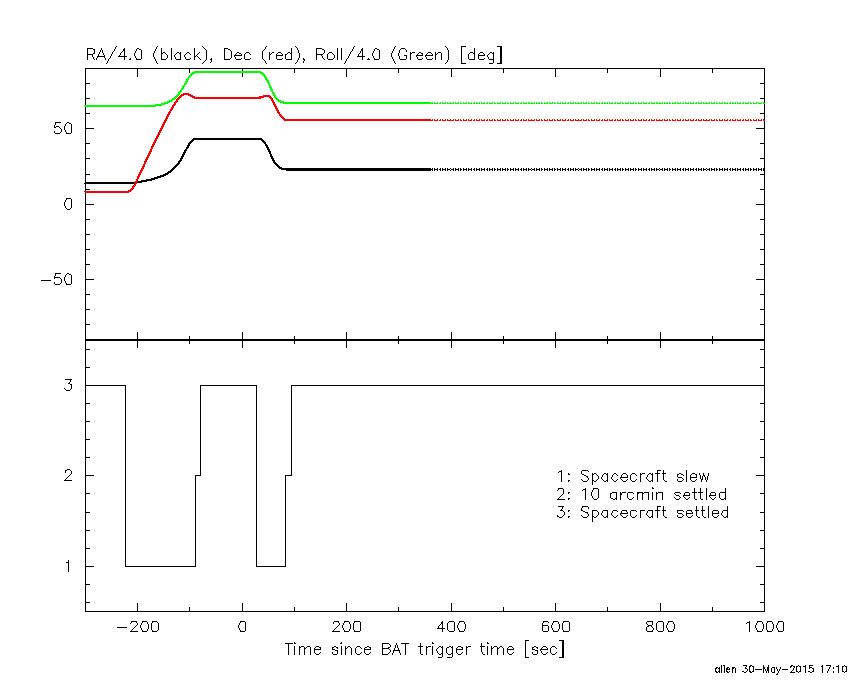
Spacecraft aspect plot
Bright source in the pre-burst/pre-slew/post-slew images
Pre-burst image of 15-350 keV band
Time interval of the image:
-89.683400 -2.296000

# RAcent  DECcent POSerr Theta    Phi  PeakCts   SNR AngSep     Name
#  [deg]    [deg]    ['] [deg]  [deg]                   [']
254.3944  35.3688    5.1  53.8    4.9   0.8568   2.3    3.5	Her X-1
266.8183  38.2471    3.0  55.2   -7.7   1.3517   3.8 ------	UNKNOWN
272.9096  45.1551    2.3  50.8  -16.5   1.1531   5.0 ------	UNKNOWN
Pre-slew background subtracted image of 15-350 keV band
Time interval of the image:
-2.296000 5.744000

# RAcent  DECcent POSerr Theta    Phi  PeakCts   SNR AngSep     Name
#  [deg]    [deg]    ['] [deg]  [deg]                   [']
254.6529  35.2554    0.0  54.0    4.7   0.1873   1.7   10.9	Her X-1
230.4152  29.8480    2.6  51.0   31.1   0.6841   4.5 ------	UNKNOWN
263.8695  43.4444    2.3  49.6   -7.9   0.3177   5.0 ------	UNKNOWN
267.4174  38.3149    2.7  55.3   -8.3   0.3955   4.3 ------	UNKNOWN
 91.9791  55.7285    1.2  36.4 -150.6   0.4058  10.0 ------	UNKNOWN
Post-slew image of 15-350 keV band
Time interval of the image:
83.316600 962.711600

# RAcent  DECcent POSerr Theta    Phi  PeakCts   SNR AngSep     Name
#  [deg]    [deg]    ['] [deg]  [deg]                   [']
 83.6361  22.0124    0.2  34.3 -164.1  35.3049  53.6    0.2	Crab
 86.1361  17.5541    2.9  38.5 -168.9   3.1495   3.9 ------	UNKNOWN
293.5752  68.0740    2.7  55.2   -7.6   9.1690   4.3 ------	UNKNOWN
 41.8395  66.5317    2.7  25.6  -43.0   2.4788   4.3 ------	UNKNOWN
353.4916  55.3938    4.5  50.7  -44.5  10.0360   2.6 ------	UNKNOWN
 40.6359  33.7894    3.8  41.3  -98.1  10.5990   3.1 ------	UNKNOWN