Analysis Summary
Notes:
- 1) No attempt has been made to eliminate the non-significant decimal places.
- 2) This batgrbproduct analysis is done using the HEASARC data.
- 3) This batgrbproduct analysis is using the flight position for the mask-weighting calculation.
======================================================================
BAT GRB EVENT DATA PROCESSING REPORT
Process Script Ver: batgrbproduct v2.46
Process Start Time: Sun Jan 12 04:34:01 EST 2014
Host Name: batevent1
Current Working Dir: /local/data/batevent/batevent_reproc/trigger553847
======================================================================
Trigger: 00553847 Segment: 000
BAT Trigger Time: 388004464 [s; MET]
Trigger Stop: 388004528 [s; MET]
UTC: 2013-04-18T19:00:53.544240 [includes UTCF correction]
Where From?: TDRSS position message
BAT
RA: 149.043481794784 Dec: 13.6495345491784 [deg; J2000]
Catalogged Source?: NO
Point Source?: YES
GRB Indicated?: YES [ by BAT flight software ]
Image S/N Ratio: 9.78
Image Trigger?: YES
Rate S/N Ratio: 0 [ if not an image trigger ]
Image S/N Ratio: 9.78
Analysis Position: [ source = BAT ]
RA: 149.043481794784 Dec: 13.6495345491784 [deg; J2000]
Refined Position: [ source = BAT pre-slew burst ]
RA: 149.046174219361 Dec: 13.6735206031805 [deg; J2000]
{ 09h 56m 11.1s , +13d 40' 24.7" }
+/- 1.90746203895237 [arcmin] (estimated 90% radius based on SNR)
+/- 0.686867603475828 [arcmin] (formal 1-sigma fit error)
SNR: 12.0911355246573
Angular difference between the analysis and refined position is 1.447699 arcmin
Partial Coding Fraction: 0.8984375 [ including projection effects ]
Duration
T90: 274.923999965191 +/- 39.3195305513169
Measured from: -36.4200000166893
to: 238.503999948502 [s; relative to TRIGTIME]
T50: 142.919999957085 +/- 30.4247480423713
Measured from: -11.4639999866486
to: 131.455999970436 [s; relative to TRIGTIME]
Fluence
Peak Flux (peak 1 second)
Measured from: -37.6759999990463
to: -36.6759999990463 [s; relative to TRIGTIME]
Total Fluence
Measured from: -40.1719999909401
to: 272.972000002861 [s; relative to TRIGTIME]
Band 1 Band 2 Band 3 Band 4
15-25 25-50 50-100 100-350 keV
Total 1.252580 1.495362 0.522518 0.113974
0.099321 0.101952 0.089316 0.079598 [error]
Peak 0.027599 0.036905 0.000270 0.002243
0.008548 0.008343 0.007472 0.006831 [error]
[ fluence units of on-axis counts / fully illuminated detector ]
======================================================================
====== Table of the duration information =============================
Value tstart tstop
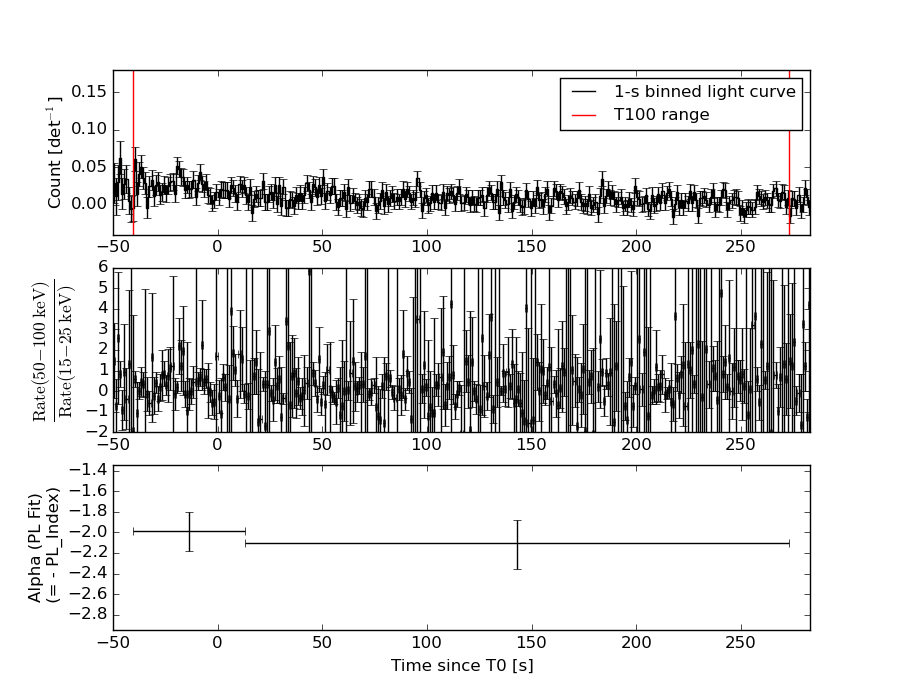
T100 313.144 -40.172 272.972
T90 274.924 -36.420 238.504
T50 142.920 -11.464 131.456
Peak 1.000 -37.676 -36.676
====== Spectral Analysis Summary =====================================
Model : spectral model: simple power-law (PL) and cutoff power-law (CPL)
Ph_index : photon index: E^{Ph_index}
Ph_90err : 90% error of the photon index
Epeak : Epeak in keV
Epeak_90err: 90% error of Epeak
Norm : normalization at 50 keV in both the PL model and CPL model
Nomr_90err : 90% error of the normalization
chi2 : Chi-Squared
dof : degree of freedo
=== Time-averaged spectral analysis ===
(Best model with acceptable fit: PL)
Model Ph_index Ph_90err_low Ph_90err_hi Epeak Epeak_90err_low Epeak_90err_hi Norm Nomr_90err_low Norm_90err_hi chi2 dof
PL -2.067 -0.174 0.166 - - - 6.11e-04 -7.08e-05 6.95e-05 62.530 57
CPL -1.295 -0.698 1.004 36.060 -34.441 15.911 1.76e-03 -1.09e-03 5.34e-03 59.760 56
=== 1-s peak spectral analysis ===
(Best model with acceptable fit: N/A)
Model Ph_index Ph_90err_low Ph_90err_hi Epeak Epeak_90err_low Epeak_90err_hi Norm Nomr_90err_low Norm_90err_hi chi2 dof
PL -2.569 -0.737 0.555 - - - 3.29e-03 -1.66e-03 1.72e-03 64.170 57
CPL 1.585 -3.307 7.303 30.126 -19.670 8.622 1.48e+00 -1.48e+00 9.67e+04 59.470 56
=== Fluence/Peak Flux Summary ===
Model Band1 Band2 Band3 Band4 Band5 Total
15-25 25-50 50-100 100-350 15-150 15-350 keV
Fluence PL 4.17e-07 5.44e-07 5.19e-07 8.80e-07 1.77e-06 2.36e-06 erg/cm2
90%_error_low -4.99e-08 -4.77e-08 -8.15e-08 -2.45e-07 -1.86e-07 -3.45e-07 erg/cm2
90%_error_hi 5.09e-08 4.77e-08 8.36e-08 3.03e-07 1.90e-07 3.90e-07 erg/cm2
Peak flux PL 3.83e-01 2.06e-01 6.94e-02 3.02e-02 6.75e-01 6.89e-01 ph/cm2/s
90%_error_low -1.36e-01 -7.50e-02 -4.08e-02 -3.02e-02 -2.13e-01 -2.18e-01 ph/cm2/s
90%_error_hi 1.41e-01 7.28e-02 5.00e-02 4.94e-02 2.13e-01 2.20e-01 ph/cm2/s
Fluence CPL 3.95e-07 5.92e-07 4.82e-07 2.33e-07 1.62e-06 1.70e-06 erg/cm2
90%_error_low -5.70e-08 -6.83e-08 -1.11e-07 -1.71e-07 -2.19e-07 -2.86e-07 erg/cm2
90%_error_hi 5.66e-08 7.09e-08 1.00e-07 6.56e-07 2.40e-07 6.92e-07 erg/cm2
Peak flux CPL 3.08e-01 3.11e-01 3.82e-02 1.67e-04 6.56e-01 6.58e-01 ph/cm2/s
90%_error_low -3.08e-01 -1.12e-01 -3.82e-02 -1.67e-04 -2.03e-01 -2.05e-01 ph/cm2/s
90%_error_hi 1.65e-01 1.15e-01 5.97e-02 1.14e-02 2.07e-01 2.06e-01 ph/cm2/s
======================================================================
Image
Pre-slew 15.0-350.0 keV image (Event data)
#   RAcent    DECcent   POSerr    Theta     Phi              Peak Cts       SNR   Name
  149.0462    13.6735   0.0159    23.4622     8.9239         1.3631972     12.091 TRIG_00553847

Foreground time interval of the image:
-12.499  73.301 (delta_t =  85.800 [sec])
Background time interval of the image:
Light Curves
Note: The mask-weighted lightcurves have units of either count/det or counts/sec/det, where a det is 0.4 x 0.4 = 0.16 sq cm.
Full-time range; 1 s binning
Other quick-look light curves:
- 64 ms binning (zoomed)
- 16 ms binning (zoomed)
- 8 ms binning (zoomed)
- 2 ms binning (zoomed)
- SN=5 or 10 s binning (full-time range)
- Raw light curve
Spectra
- 64 ms binning (zoomed)
- 16 ms binning (zoomed)
- 8 ms binning (zoomed)
- 2 ms binning (zoomed)
- SN=5 or 10 s binning (full-time range)
- Raw light curve
Spectra
Notes:
- 1) The fitting includes the systematic errors.
- 2) When the burst includes telescope slew time periods, the fitting uses an average response file made from multiple 5-s response files through out the slew time plus single time preiod for the non-slew times, and weighted by the total counts in the corresponding time period using addrmf. An average response file is needed becuase a spectral fit using the pre-slew DRM will introduce some errors in both a spectral shape and a normalization if the PHA file contains a lot of the slew/post-slew time interval.
- 3) For fits to more complicated models (e.g. a power-law over a cutoff power-law), the BAT team has decided to require a chi-square improvement of more than 6 for each extra dof.
Time averaged spectrum fit using the average DRM
Power-law model
Time interval is from  -40.172 sec. to  272.972 sec.

Spectral model in power-law:
------------------------------------------------------------
Parameters  : value       lower 90%   higher 90%
Photon index: -2.06689     ( -0.173933   0.165508 )
Norm@50keV  : 6.11414E-04    ( -7.08451e-05   6.95453e-05 )
------------------------------------------------------------
#Fit statistic : Chi-Squared =          62.53 using 59 PHA bins.
# Reduced chi-squared =          1.097 for     57 degrees of freedom
# Null hypothesis probability =   2.862826e-01

Photon flux (15-150 keV)    in 313.1 sec: 9.46567E-02 ( -0.0081716  0.0081733 ) ph/cm2/s
Energy fluence (15-150 keV)             : 1.77371e-06 ( -1.85885e-07  1.90024e-07 ) ergs/cm2
Cutoff power-law model
Time interval is from  -40.172 sec. to  272.972 sec.
Spectral model in the cutoff power-law:
------------------------------------------------------------
Parameters  : value       lower 90%   higher 90%
Photon index: -1.29476     ( -0.698033   1.00386 )
Epeak [keV] : 36.0597      ( -34.4419 15.91 )
Norm@50keV  : 1.76180E-03    ( -0.00109138   0.00534203 )
------------------------------------------------------------
#Fit statistic : Chi-Squared =          59.76 using 59 PHA bins.
# Reduced chi-squared =          1.067 for     56 degrees of freedom
# Null hypothesis probability =   3.406589e-01

Photon flux (15-150 keV)    in 313.1 sec: 9.16470E-02 ( -0.0087099  0.008713 ) ph/cm2/s
Energy fluence (15-150 keV)             : 1.62276e-06 ( -2.1919e-07  2.39773e-07 ) ergs/cm2
1-s peak spectrum fit
Power-law model
Time interval is from  -37.676 sec. to  -36.676 sec.

Spectral model in power-law:
------------------------------------------------------------
Parameters  : value       lower 90%   higher 90%
Photon index: -2.56949     ( -0.733163   0.558766 )
Norm@50keV  : 3.28866E-03    ( -0.00165737   0.00172448 )
------------------------------------------------------------
#Fit statistic : Chi-Squared =          64.17 using 59 PHA bins.
# Reduced chi-squared =          1.126 for     57 degrees of freedom
# Null hypothesis probability =   2.397810e-01

Photon flux (15-150 keV)    in 1 sec: 0.674594 ( -0.212554  0.213486 ) ph/cm2/s
Energy fluence (15-150 keV)             : 3.35151e-08 ( -1.24754e-08  1.37478e-08 ) ergs/cm2
Cutoff power-law model
Time interval is from  -37.676 sec. to  -36.676 sec.
Spectral model in the cutoff power-law:
------------------------------------------------------------
Parameters  : value       lower 90%   higher 90%
Photon index: 1.58475     ( -3.35102   7.25837 )
Epeak [keV] : 30.1260      ( -19.7381 8.55405 )
Norm@50keV  : 1.48164    ( -1.77319   96687.4 )
------------------------------------------------------------
#Fit statistic : Chi-Squared =          59.47 using 59 PHA bins.
# Reduced chi-squared =          1.062 for     56 degrees of freedom
# Null hypothesis probability =   3.505674e-01

Photon flux (15-150 keV)    in 1 sec: 0.656215 ( -0.203292  0.206972 ) ph/cm2/s
Energy fluence (15-150 keV)             : 0 ( 0  0 ) ergs/cm2
Time-resolved spectra
Distribution
T90 vs. Hardness ratio plot
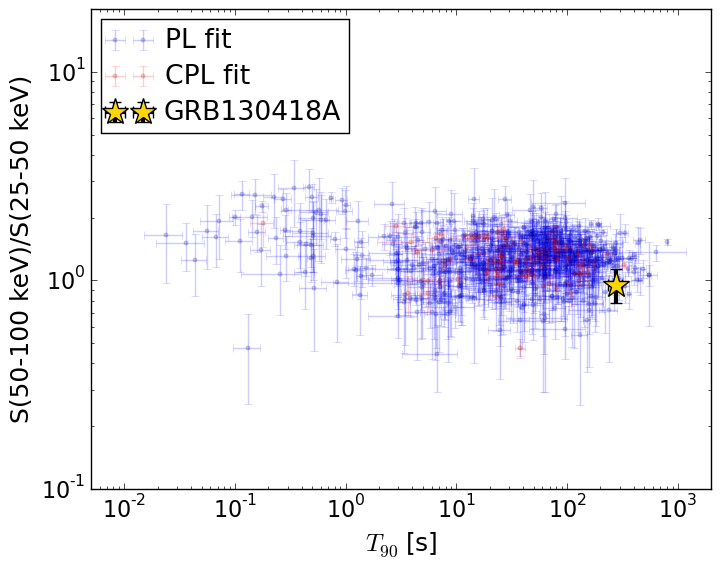
T90                                   = 274.924 sec.
Hardness ratio (energy fluence ratio) = 0.95472862449
S(15-50 keV) vs. S(50-150 keV) plot
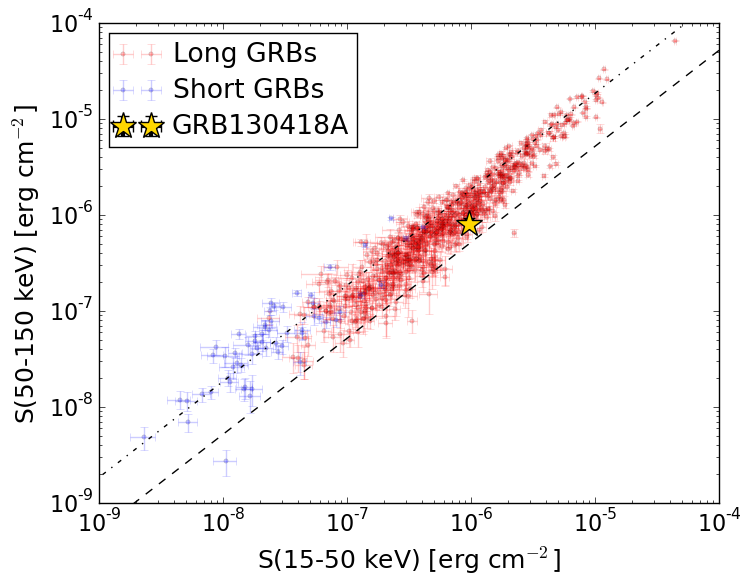
S(15-50 keV)  = 9.614502e-07
S(50-150 keV) = 8.122498e-07
The dash-dotted line and the dashed line traces the fluences calculated from the Band function with Epeak = 15 and 150 keV, respectively. Both lines assume a canonical values of alpha = -1 and beta = -2.5.
Mask shadow pattern
IMX = 4.287745920250035E-01, IMY = -6.732734992307260E-02
Spacecraft aspect plot
Bright source in the pre-burst/pre-slew/post-slew images
Pre-burst image of 15-350 keV band
Time interval of the image:
Pre-slew background subtracted image of 15-350 keV band
Time interval of the image:
-12.499400 73.300640

# RAcent  DECcent POSerr Theta    Phi  PeakCts   SNR AngSep     Name
#  [deg]    [deg]    ['] [deg]  [deg]                   [']
135.5463 -40.4666   21.7  32.7  173.3   0.0726   0.5    5.3	Vela X-1
166.4303   8.2186    2.5  30.8   45.5   0.7249   4.5 ------	UNKNOWN
151.3353 -36.7568    2.1  30.4  148.9   0.7712   5.5 ------	UNKNOWN
149.0462  13.6735    1.0  23.5    8.9   1.3635  12.1 ------	UNKNOWN
125.5357 -49.0590    2.5  42.8 -179.1   0.8027   4.6 ------	UNKNOWN
140.8554  33.3967    2.1  41.5  -12.3   0.8435   5.5 ------	UNKNOWN
111.9364 -48.7412    2.3  47.1 -168.0   1.0332   5.0 ------	UNKNOWN
118.4669 -31.8436    3.1  31.2 -155.9   0.4318   3.7 ------	UNKNOWN
Post-slew image of 15-350 keV band
Time interval of the image:
118.900600 353.900600

# RAcent  DECcent POSerr Theta    Phi  PeakCts   SNR AngSep     Name
#  [deg]    [deg]    ['] [deg]  [deg]                   [']
135.5180 -40.3947    9.7  55.5  172.2   1.3643   1.3    9.6	Vela X-1
151.6856 -33.8839    2.1  47.6  156.7   3.5804   5.5 ------	UNKNOWN
175.5517  25.1485    2.6  27.4   41.0   1.0712   4.5 ------	UNKNOWN
140.9335 -13.0569    3.2  27.9  176.8   0.7285   3.7 ------	UNKNOWN
149.0096  13.6880    1.9   0.0  -66.8   1.0519   6.0 ------	UNKNOWN
108.4854 -30.3136    3.7  58.8 -159.3   4.6528   3.1 ------	UNKNOWN
111.3081  49.5002    3.7  47.3  -53.0   3.1853   3.1 ------	UNKNOWN