Analysis Summary
Notes:
- 1) No attempt has been made to eliminate the non-significant decimal places.
- 2) This batgrbproduct analysis is done using the HEASARC data.
- 3) This batgrbproduct analysis is using the flight position for the mask-weighting calculation.
======================================================================
                  BAT GRB EVENT DATA PROCESSING REPORT
    Process Script Ver: batgrbproduct v2.46
    Process Start Time: Sun Jan 12 04:26:19 EST 2014
             Host Name: batevent1
   Current Working Dir: /local/data/batevent/batevent_reproc/trigger553918
======================================================================

  Trigger: 00553918      Segment: 000

  BAT Trigger Time: 388071040   [s; MET]
      Trigger Stop: 388071152   [s; MET]
               UTC: 2013-04-19T13:30:29.541280    [includes UTCF correction]
       Where From?: TDRSS position message

  BAT
    RA: 355.270512385986   Dec: 9.97717701299357  [deg; J2000]

     Catalogged Source?: NO
     Point Source?:      YES
     GRB Indicated?:     YES    [ by BAT flight software ]
     Image S/N Ratio:    7.58
     Image Trigger?:     YES
     Rate S/N Ratio:     0  [ if not an image trigger ]
     Image S/N Ratio:    7.58

  Analysis Position:   [ source = BAT ]
    RA: 355.270512385986   Dec: 9.97717701299357  [deg; J2000]

  Refined Position:   [ source = BAT pre-slew burst ]
    RA: 355.269332526854   Dec: 9.91665621298506  [deg; J2000]
        { 23h 41m 04.6s , +09d 55' 00.0" }
         +/- 2.42826771355634 [arcmin] (estimated 90% radius based on SNR)
         +/- 1.03978519870536 [arcmin] (formal 1-sigma fit error)
    SNR: 8.56435606752303

  Angular difference between the analysis and refined position is 3.631917 arcmin

  Partial Coding Fraction: 0.828125    [ including projection effects ]

  Duration
     T90: 85.5839999318123 +/- 49.1526537323231
        Measured from: 35.8519999980927
                   to: 121.435999929905     [s; relative to TRIGTIME]
     T50: 25.8639999628067 +/- 19.9513779482757
        Measured from: 53.472000002861
                   to: 79.3359999656677     [s; relative to TRIGTIME]


  Fluence
     Peak Flux  (peak 1 second)
        Measured from: 61.1999999880791
                   to: 62.1999999880791     [s; relative to TRIGTIME]
     Total Fluence
        Measured from: 30.0879999995232
                   to: 169.508000016212     [s; relative to TRIGTIME]

             Band 1     Band 2     Band 3     Band 4
              15-25      25-50     50-100    100-350     keV
 Total     0.340150   0.493462   0.348361   0.149928
           0.068204   0.070184   0.061327   0.053067 [error]
 Peak      0.016204   0.011993   0.019497   0.003054
           0.005919   0.006183   0.005438   0.004693 [error]

     [ fluence units of on-axis counts / fully illuminated detector ]

======================================================================


====== Table of the duration information =============================

        Value   tstart    tstop
T100  139.420   30.088  169.508
T90    85.584   35.852  121.436
T50    25.864   53.472   79.336
Peak    1.000   61.200   62.200


====== Spectral Analysis Summary =====================================

Model      : spectral model: simple power-law (PL) and cutoff power-law (CPL)
Ph_index   : photon index: E^{Ph_index}
Ph_90err   : 90% error of the photon index
Epeak      : Epeak in keV
Epeak_90err: 90% error of Epeak
Norm       : normalization at 50 keV in both the PL model and CPL model
Nomr_90err : 90% error of the normalization
chi2       : Chi-Squared
dof        : degree of freedo

=== Time-averaged spectral analysis ===
(Best model with acceptable fit: PL)

Model Ph_index Ph_90err_low Ph_90err_hi  Epeak  Epeak_90err_low  Epeak_90err_hi  Norm       Nomr_90err_low    Norm_90err_hi    chi2    dof
PL      -1.404    -0.273      0.272       -           -               -         6.27e-04     -9.89e-05          9.83e-05      53.150   57
CPL     -1.050    -0.609      1.346      135.768    -135.768      -135.768      9.44e-04     -4.08e-04          3.34e-03      52.850   56


=== 1-s peak spectral analysis ===
(Best model with acceptable fit: PL)

Model Ph_index Ph_90err_low Ph_90err_hi  Epeak  Epeak_90err_low  Epeak_90err_hi  Norm       Nomr_90err_low    Norm_90err_hi    chi2    dof
PL      -0.902     -0.565     0.643       -           -               -         3.74e-03     -1.26e-03          1.20e-03      54.380   57
CPL     -0.240      0.240     7.088      167.681    -167.681      -167.681      6.83e-03        N/A               N/A         54.230   56


=== Fluence/Peak Flux Summary ===

              Model    Band1     Band2     Band3     Band4     Band5     Total
                       15-25     25-50    50-100    100-350    15-150    15-350    keV
Fluence         PL   1.02e-07  1.99e-07  3.01e-07  9.86e-07  8.44e-07  1.59e-06   erg/cm2
      90%_error_low -2.65e-08 -3.28e-08 -6.10e-08 -3.70e-07 -1.48e-07 -4.26e-07   erg/cm2
      90%_error_hi   2.83e-08  3.24e-08  6.03e-08  5.00e-07  1.50e-07  5.34e-07   erg/cm2
Peak flux       PL   8.71e-02  1.25e-01  1.34e-01  2.67e-01  4.30e-01  6.14e-01   ph/cm2/s
      90%_error_low -5.29e-02 -5.49e-02 -4.34e-02 -1.51e-01 -1.39e-01 -1.99e-01   ph/cm2/s
      90%_error_hi   7.09e-02  5.34e-02  4.25e-02  2.55e-01  1.42e-01  2.28e-01   ph/cm2/s

Fluence        CPL   9.61e-08  2.06e-07  3.08e-07  5.80e-07  8.21e-07  1.19e-06   erg/cm2
      90%_error_low -3.25e-08 -3.83e-08 -6.50e-08 -4.43e-07 -1.65e-07 -4.78e-07   erg/cm2
      90%_error_hi   3.24e-08  4.16e-08  6.77e-08  9.77e-07  1.63e-07  5.56e-07   erg/cm2
Peak flux      CPL   8.26e-02  1.25e-01  1.44e-01  1.62e-01  4.14e-01  5.99e-01   ph/cm2/s
      90%_error_low -6.99e-02 -7.48e-02 -5.24e-02 -1.62e-01 -1.68e-01 -3.50e-01   ph/cm2/s
      90%_error_hi   7.34e-02  5.84e-02  6.96e-02  1.57e-01  1.53e-01  2.15e-01   ph/cm2/s

======================================================================
Image
Pre-slew 15.0-350.0 keV image (Event data)
#   RAcent    DECcent   POSerr    Theta     Phi              Peak Cts       SNR   Name
  355.2693     9.9167   0.0224    23.2316  -133.1994         1.3227284      8.564 TRIG_00553918

Foreground time interval of the image:
 30.088 169.508 (delta_t = 139.420 [sec])
Background time interval of the image:
-239.000  30.088 (delta_t = 269.088 [sec])
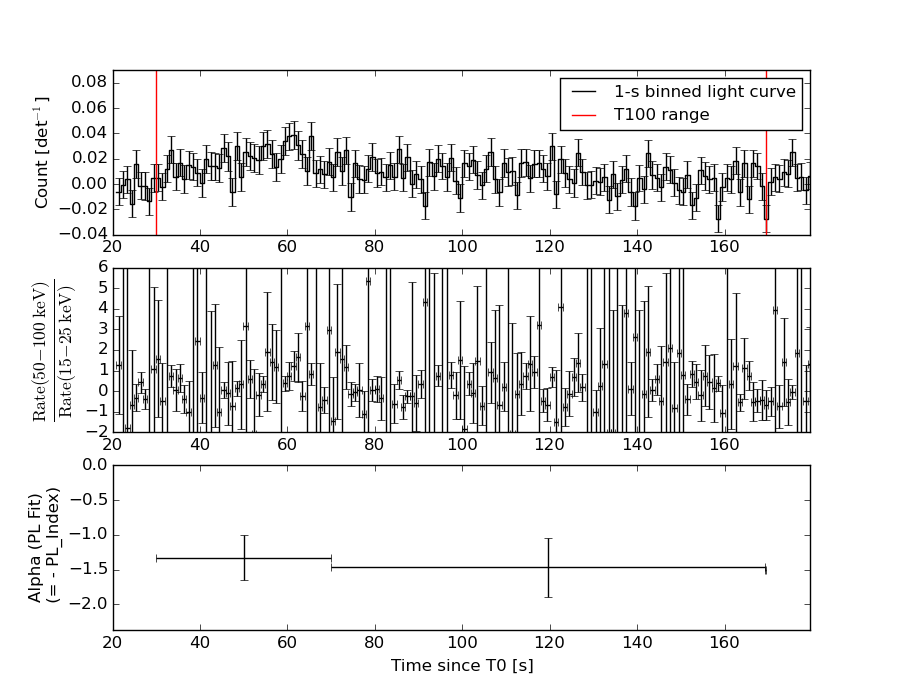
Light Curves
Note: The mask-weighted lightcurves have units of either count/det or counts/sec/det, where a det is 0.4 x 0.4 = 0.16 sq cm.
Full-time range; 1 s binning
Other quick-look light curves:
- 64 ms binning (zoomed)
- 16 ms binning (zoomed)
- 8 ms binning (zoomed)
- 2 ms binning (zoomed)
- SN=5 or 10 s binning (full-time range)
- Raw light curve
Spectra
- 64 ms binning (zoomed)
- 16 ms binning (zoomed)
- 8 ms binning (zoomed)
- 2 ms binning (zoomed)
- SN=5 or 10 s binning (full-time range)
- Raw light curve
Spectra
Notes:
- 1) The fitting includes the systematic errors.
- 2) When the burst includes telescope slew time periods, the fitting uses an average response file made from multiple 5-s response files through out the slew time plus single time preiod for the non-slew times, and weighted by the total counts in the corresponding time period using addrmf. An average response file is needed becuase a spectral fit using the pre-slew DRM will introduce some errors in both a spectral shape and a normalization if the PHA file contains a lot of the slew/post-slew time interval.
- 3) For fits to more complicated models (e.g. a power-law over a cutoff power-law), the BAT team has decided to require a chi-square improvement of more than 6 for each extra dof.
Time averaged spectrum fit using the average DRM
Power-law model

Time interval is from   30.088 sec. to  169.508 sec.

Spectral model in power-law:
------------------------------------------------------------
Parameters  : value       lower 90%   higher 90%
Photon index: -1.40361     ( -0.273367   0.272155 )
Norm@50keV  : 6.27000E-04    ( -9.89179e-05   9.82929e-05 )
------------------------------------------------------------
#Fit statistic : Chi-Squared =          53.15 using 59 PHA bins.
# Reduced chi-squared =         0.9325 for     57 degrees of freedom
# Null hypothesis probability =   6.201383e-01

Photon flux (15-150 keV)    in 139.4 sec: 7.64209E-02 ( -0.0119857  0.0120069 ) ph/cm2/s
Energy fluence (15-150 keV)             : 8.44039e-07 ( -1.47505e-07  1.4977e-07 ) ergs/cm2
Cutoff power-law model
Time interval is from   30.088 sec. to  169.508 sec.
Spectral model in the cutoff power-law:
------------------------------------------------------------
Parameters  : value       lower 90%   higher 90%
Photon index: -1.0505     ( -0.608907   1.34622 )
Epeak [keV] : 135.768      ( -135.768 -135.768 )
Norm@50keV  : 9.43764E-04    ( -0.00040822   0.00334225 )
------------------------------------------------------------
#Fit statistic : Chi-Squared =          52.85 using 59 PHA bins.
# Reduced chi-squared =         0.9438 for     56 degrees of freedom
# Null hypothesis probability =   5.948192e-01

Photon flux (15-150 keV)    in 139.4 sec: 7.52581E-02 ( -0.0126176  0.0125083 ) ph/cm2/s
Energy fluence (15-150 keV)             : 8.21169e-07 ( -1.64718e-07  1.6346e-07 ) ergs/cm2
1-s peak spectrum fit
Power-law model
Time interval is from   61.200 sec. to   62.200 sec.

Spectral model in power-law:
------------------------------------------------------------
Parameters  : value       lower 90%   higher 90%
Photon index: -0.901505     ( -0.565347   0.642544 )
Norm@50keV  : 3.74406E-03    ( -0.00126444   0.00120499 )
------------------------------------------------------------
#Fit statistic : Chi-Squared =          54.38 using 59 PHA bins.
# Reduced chi-squared =         0.9539 for     57 degrees of freedom
# Null hypothesis probability =   5.741676e-01

Photon flux (15-150 keV)    in 1 sec: 0.429737 ( -0.13932  0.141714 ) ph/cm2/s
Energy fluence (15-150 keV)             : 4.19981e-08 ( -1.3564e-08  1.37218e-08 ) ergs/cm2
Cutoff power-law model
Time interval is from   61.200 sec. to   62.200 sec.
Spectral model in the cutoff power-law:
------------------------------------------------------------
Parameters  : value       lower 90%   higher 90%
Photon index: -0.240051     ( 0.236738   7.08501 )
Epeak [keV] : 167.681      ( -166.998 -166.998 )
Norm@50keV  : 6.83444E-03    (     )
------------------------------------------------------------
#Fit statistic : Chi-Squared =          54.23 using 59 PHA bins.
# Reduced chi-squared =         0.9685 for     56 degrees of freedom
# Null hypothesis probability =   5.420047e-01

Photon flux (15-150 keV)    in 1 sec: 0.414433 ( -0.168119  0.152842 ) ph/cm2/s
Energy fluence (15-150 keV)             : 4.09836e-08 ( -1.55856e-08  1.43387e-08 ) ergs/cm2
Time-resolved spectra
Distribution
T90 vs. Hardness ratio plot
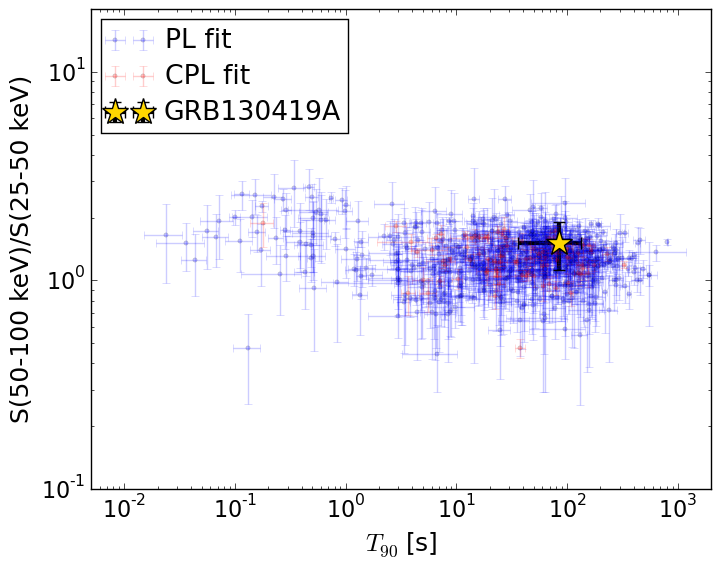
T90                                   = 85.584 sec.
Hardness ratio (energy fluence ratio) = 1.51195929598
S(15-50 keV) vs. S(50-150 keV) plot

S(15-50 keV)  = 3.007318e-07
S(50-150 keV) = 5.433108e-07
The dash-dotted line and the dashed line traces the fluences calculated from the Band function with Epeak = 15 and 150 keV, respectively. Both lines assume a canonical values of alpha = -1 and beta = -2.5.
Mask shadow pattern
IMX = -2.938410813622833E-01, IMY = 3.129159711550278E-01
Spacecraft aspect plot
Bright source in the pre-burst/pre-slew/post-slew images
Pre-burst image of 15-350 keV band
Time interval of the image:
-239.000000 30.088000

# RAcent  DECcent POSerr Theta    Phi  PeakCts   SNR AngSep     Name
#  [deg]    [deg]    ['] [deg]  [deg]                   [']
326.2914  38.2185    7.3  49.1  174.3  -0.8172  -1.6    8.4	Cyg X-2
302.5113  14.4936    3.0  45.0  130.8   3.4091   3.9 ------	UNKNOWN
324.8757  38.7468    3.4  49.9  173.2   1.8019   3.4 ------	UNKNOWN
347.6212 -21.7052    2.0  14.2  -14.1   1.1126   5.8 ------	UNKNOWN
354.9746  23.0301    2.5  34.5 -147.5   1.2135   4.6 ------	UNKNOWN
 24.3641 -51.8975    2.9  55.5  -20.6   2.7271   4.0 ------	UNKNOWN
355.3639  48.6739    5.8  58.7 -159.2   2.8779   2.0 ------	UNKNOWN
  4.5723  36.9978    2.6  50.7 -146.0   2.6106   4.4 ------	UNKNOWN
 25.5260 -17.3767    3.6  43.7  -63.9   3.3289   3.2 ------	UNKNOWN
 23.5268  -8.8829    2.6  41.6  -76.4   3.7168   4.5 ------	UNKNOWN
 12.9839  31.9586    2.0  50.7 -134.9   6.4047   5.7 ------	UNKNOWN
Pre-slew background subtracted image of 15-350 keV band
Time interval of the image:
30.088000 169.508000

# RAcent  DECcent POSerr Theta    Phi  PeakCts   SNR AngSep     Name
#  [deg]    [deg]    ['] [deg]  [deg]                   [']
326.2729  38.2578   22.1  49.1  174.3   0.1894   0.5    6.1	Cyg X-2
355.2693   9.9166    1.3  23.2 -133.2   1.3228   8.6 ------	UNKNOWN
349.2826  41.0764    2.1  50.4 -162.2   1.8750   5.5 ------	UNKNOWN
 18.2583  12.7482    2.2  42.5 -109.9   2.9209   5.1 ------	UNKNOWN
Post-slew image of 15-350 keV band
Time interval of the image:
365.300600 621.700600

# RAcent  DECcent POSerr Theta    Phi  PeakCts   SNR AngSep     Name
#  [deg]    [deg]    ['] [deg]  [deg]                   [']
 83.6314  22.0152    0.3  27.7   -8.0  10.8989  46.1    0.1	Crab
122.3553  17.9037    3.0  44.6   50.0   3.3283   3.8 ------	UNKNOWN
103.9201  20.8337    2.3  32.9   28.6   1.4428   4.9 ------	UNKNOWN
 76.9936 -59.4684    3.3  54.1  177.1   3.3443   3.5 ------	UNKNOWN
 63.3572  -2.3180    2.1  20.8  -88.9   1.3521   5.4 ------	UNKNOWN
 44.2583 -48.8717    2.7  54.7 -156.3   3.6959   4.2 ------	UNKNOWN