Analysis Summary
Notes:
- 1) No attempt has been made to eliminate the non-significant decimal places.
- 2) This batgrbproduct analysis is done using the HEASARC data.
- 3) This batgrbproduct analysis is using the flight position for the mask-weighting calculation.
======================================================================
BAT GRB EVENT DATA PROCESSING REPORT
Process Script Ver: batgrbproduct v2.46
Process Start Time: Sun Jan 12 04:21:37 EST 2014
Host Name: batevent1
Current Working Dir: /local/data/batevent/batevent_reproc/trigger553977
======================================================================
Trigger: 00553977 Segment: 000
BAT Trigger Time: 388135720 [s; MET]
Trigger Stop: 388135784 [s; MET]
UTC: 2013-04-20T07:28:29.538420 [includes UTCF correction]
Where From?: TDRSS position message
BAT
RA: 196.099811619603 Dec: 59.4236969469464 [deg; J2000]
Catalogged Source?: NO
Point Source?: YES
GRB Indicated?: YES [ by BAT flight software ]
Image S/N Ratio: 12.77
Image Trigger?: YES
Rate S/N Ratio: 0 [ if not an image trigger ]
Image S/N Ratio: 12.77
Analysis Position: [ source = BAT ]
RA: 196.099811619603 Dec: 59.4236969469464 [deg; J2000]
Refined Position: [ source = BAT pre-slew burst ]
RA: 196.120226401989 Dec: 59.4221532318767 [deg; J2000]
{ 13h 04m 28.9s , +59d 25' 19.8" }
+/- 0.618923382094513 [arcmin] (estimated 90% radius based on SNR)
+/- 0.185652492286297 [arcmin] (formal 1-sigma fit error)
SNR: 60.3642717565921
Angular difference between the analysis and refined position is 0.629943 arcmin
Partial Coding Fraction: 0.8671875 [ including projection effects ]
Duration
T90: 121.135999977589 +/- 11.7493788427888
Measured from: 37.311999976635
to: 158.447999954224 [s; relative to TRIGTIME]
T50: 28.0799999833107 +/- 2.06763243083796
Measured from: 99.4039999842644
to: 127.483999967575 [s; relative to TRIGTIME]
Fluence
Peak Flux (peak 1 second)
Measured from: 110.667999982834
to: 111.667999982834 [s; relative to TRIGTIME]
Total Fluence
Measured from: -14.9879999756813
to: 188.128000020981 [s; relative to TRIGTIME]
Band 1 Band 2 Band 3 Band 4
15-25 25-50 50-100 100-350 keV
Total 5.354719 5.804453 2.558378 0.380919
0.089882 0.092674 0.079994 0.068841 [error]
Peak 0.124203 0.166023 0.092143 0.012816
0.008029 0.008647 0.006984 0.005313 [error]
[ fluence units of on-axis counts / fully illuminated detector ]
======================================================================
====== Table of the duration information =============================
Value tstart tstop
T100 203.116 -14.988 188.128
T90 121.136 37.312 158.448
T50 28.080 99.404 127.484
Peak 1.000 110.668 111.668
====== Spectral Analysis Summary =====================================
Model : spectral model: simple power-law (PL) and cutoff power-law (CPL)
Ph_index : photon index: E^{Ph_index}
Ph_90err : 90% error of the photon index
Epeak : Epeak in keV
Epeak_90err: 90% error of Epeak
Norm : normalization at 50 keV in both the PL model and CPL model
Nomr_90err : 90% error of the normalization
chi2 : Chi-Squared
dof : degree of freedo
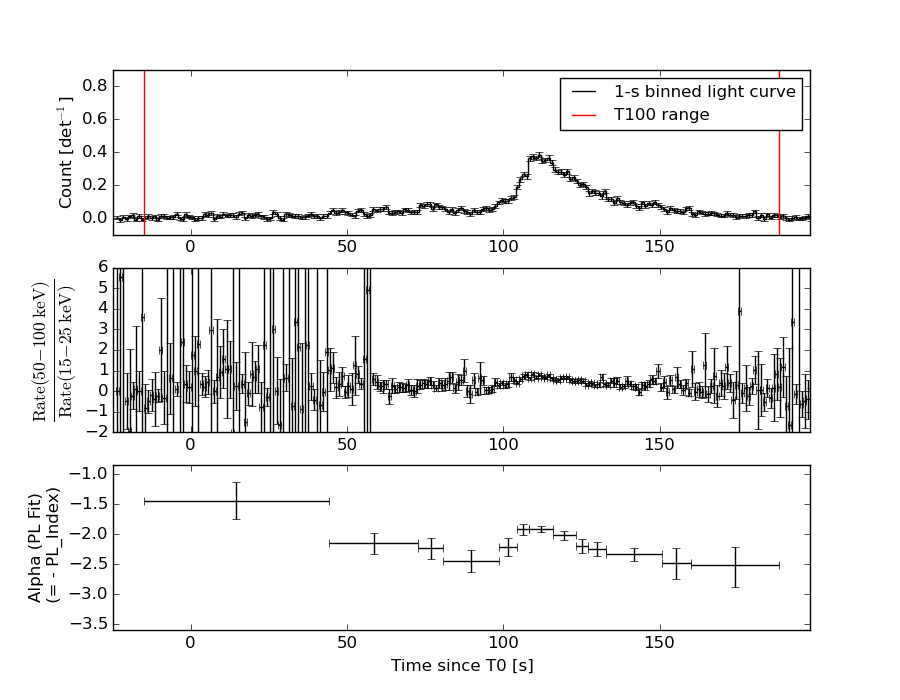
=== Time-averaged spectral analysis ===
(Best model with acceptable fit: PL)
Model Ph_index Ph_90err_low Ph_90err_hi Epeak Epeak_90err_low Epeak_90err_hi Norm Nomr_90err_low Norm_90err_hi chi2 dof
PL -2.183 -0.053 0.053 - - - 3.98e-03 -1.13e-04 1.13e-04 65.770 57
CPL -1.520 -0.243 0.259 33.358 -8.393 4.968 8.81e-03 -2.19e-03 3.17e-03 41.830 56
=== 1-s peak spectral analysis ===
(Best model with acceptable fit: CPL)
Model Ph_index Ph_90err_low Ph_90err_hi Epeak Epeak_90err_low Epeak_90err_hi Norm Nomr_90err_low Norm_90err_hi chi2 dof
PL -1.794 -0.108 0.106 - - - 2.49e-02 -1.70e-03 1.69e-03 61.090 57
CPL -1.030 -0.457 0.515 57.956 -9.045 22.055 6.48e-02 -2.78e-02 5.82e-02 52.370 56
=== Fluence/Peak Flux Summary ===
Model Band1 Band2 Band3 Band4 Band5 Total
15-25 25-50 50-100 100-350 15-150 15-350 keV
Fluence PL 1.97e-06 2.39e-06 2.11e-06 3.20e-06 7.59e-06 9.67e-06 erg/cm2
90%_error_low -8.96e-08 -6.30e-08 -8.38e-08 -2.64e-07 -1.98e-07 -3.36e-07 erg/cm2
90%_error_hi 9.11e-08 6.30e-08 8.40e-08 2.80e-07 1.98e-07 3.45e-07 erg/cm2
Peak flux PL 1.36e+00 1.15e+00 6.65e-01 5.71e-01 3.43e+00 3.75e+00 ph/cm2/s
90%_error_low -1.31e-01 -7.31e-02 -5.80e-02 -9.17e-02 -2.18e-01 -2.33e-01 ph/cm2/s
90%_error_hi 1.34e-01 7.30e-02 5.79e-02 1.02e-01 2.18e-01 2.33e-01 ph/cm2/s
Fluence CPL N/A N/A N/A N/A N/A N/A erg/cm2
90%_error_low -8.96e-08 -6.30e-08 -8.38e-08 -2.64e-07 -1.98e-07 -3.36e-07 erg/cm2
90%_error_hi 9.11e-08 6.30e-08 8.40e-08 2.80e-07 1.98e-07 3.45e-07 erg/cm2
Peak flux CPL 1.23e+00 1.25e+00 6.85e-01 2.43e-01 3.33e+00 3.41e+00 ph/cm2/s
90%_error_low -1.52e-01 -9.42e-02 -6.51e-02 -9.68e-02 -2.25e-01 -2.49e-01 ph/cm2/s
90%_error_hi 1.54e-01 9.67e-02 6.51e-02 1.55e-01 2.25e-01 2.63e-01 ph/cm2/s
======================================================================
Image
Pre-slew 15.0-350.0 keV image (Event data)
#   RAcent    DECcent   POSerr    Theta     Phi              Peak Cts       SNR   Name
  196.1202    59.4222   0.0032    28.5708   -19.0835        15.1380127     60.364 TRIG_00553977

Foreground time interval of the image:
-14.988 188.128 (delta_t = 203.116 [sec])
Background time interval of the image:
-239.000 -14.988 (delta_t = 224.012 [sec])
Light Curves
Note: The mask-weighted lightcurves have units of either count/det or counts/sec/det, where a det is 0.4 x 0.4 = 0.16 sq cm.
Full-time range; 1 s binning
Other quick-look light curves:
- 64 ms binning (zoomed)
- 16 ms binning (zoomed)
- 8 ms binning (zoomed)
- 2 ms binning (zoomed)
- SN=5 or 10 s binning (full-time range)
- Raw light curve
Spectra
- 64 ms binning (zoomed)
- 16 ms binning (zoomed)
- 8 ms binning (zoomed)
- 2 ms binning (zoomed)
- SN=5 or 10 s binning (full-time range)
- Raw light curve
Spectra
Notes:
- 1) The fitting includes the systematic errors.
- 2) When the burst includes telescope slew time periods, the fitting uses an average response file made from multiple 5-s response files through out the slew time plus single time preiod for the non-slew times, and weighted by the total counts in the corresponding time period using addrmf. An average response file is needed becuase a spectral fit using the pre-slew DRM will introduce some errors in both a spectral shape and a normalization if the PHA file contains a lot of the slew/post-slew time interval.
- 3) For fits to more complicated models (e.g. a power-law over a cutoff power-law), the BAT team has decided to require a chi-square improvement of more than 6 for each extra dof.
Time averaged spectrum fit using the average DRM
Power-law model
Time interval is from  -14.988 sec. to  188.128 sec.

Spectral model in power-law:
------------------------------------------------------------
Parameters  : value       lower 90%   higher 90%
Photon index: -2.18283     ( -0.0533654   0.0528974 )
Norm@50keV  : 3.98128E-03    ( -0.000113473   0.000113032 )
------------------------------------------------------------
#Fit statistic : Chi-Squared =          65.77 using 59 PHA bins.
# Reduced chi-squared =          1.154 for     57 degrees of freedom
# Null hypothesis probability =   1.992839e-01

Photon flux (15-150 keV)    in 203.1 sec: 0.653288 ( -0.019355  0.019462 ) ph/cm2/s
Energy fluence (15-150 keV)             : 7.58613e-06 ( -1.98079e-07  1.98355e-07 ) ergs/cm2
Cutoff power-law model
Time interval is from  -14.988 sec. to  188.128 sec.
Spectral model in the cutoff power-law:
------------------------------------------------------------
Parameters  : value       lower 90%   higher 90%
Photon index: -1.52033     ( -0.242763   0.258511 )
Epeak [keV] : 33.3581      ( -8.39554 4.96578 )
Norm@50keV  : 8.81119E-03    ( -0.00219018   0.0031692 )
------------------------------------------------------------
#Fit statistic : Chi-Squared =          41.83 using 59 PHA bins.
# Reduced chi-squared =         0.7470 for     56 degrees of freedom
# Null hypothesis probability =   9.203806e-01

Photon flux (15-150 keV)    in 203.1 sec: 0.616952 ( -0.022685  0.022844 ) ph/cm2/s
Energy fluence (15-150 keV)             : 0 ( 0  0 ) ergs/cm2
1-s peak spectrum fit
Power-law model
Time interval is from  110.668 sec. to  111.668 sec.

Spectral model in power-law:
------------------------------------------------------------
Parameters  : value       lower 90%   higher 90%
Photon index: -1.79369     ( -0.107671   0.105775 )
Norm@50keV  : 2.49332E-02    ( -0.00170197   0.00168895 )
------------------------------------------------------------
#Fit statistic : Chi-Squared =          61.09 using 59 PHA bins.
# Reduced chi-squared =          1.072 for     57 degrees of freedom
# Null hypothesis probability =   3.313328e-01

Photon flux (15-150 keV)    in 1 sec: 3.42756 ( -0.21774  0.21793 ) ph/cm2/s
Energy fluence (15-150 keV)             : 2.29625e-07 ( -1.59469e-08  1.60551e-08 ) ergs/cm2
Cutoff power-law model
Time interval is from  110.668 sec. to  111.668 sec.
Spectral model in the cutoff power-law:
------------------------------------------------------------
Parameters  : value       lower 90%   higher 90%
Photon index: -1.03025     ( -0.457381   0.515239 )
Epeak [keV] : 57.9559      ( -9.04558 22.0548 )
Norm@50keV  : 6.48331E-02    ( -0.0278235   0.0581565 )
------------------------------------------------------------
#Fit statistic : Chi-Squared =          52.37 using 59 PHA bins.
# Reduced chi-squared =         0.9353 for     56 degrees of freedom
# Null hypothesis probability =   6.128938e-01

Photon flux (15-150 keV)    in 1 sec: 3.33373 ( -0.22466  0.22473 ) ph/cm2/s
Energy fluence (15-150 keV)             : 2.16386e-07 ( -1.75843e-08  1.77779e-08 ) ergs/cm2
Time-resolved spectra
Distribution
T90 vs. Hardness ratio plot
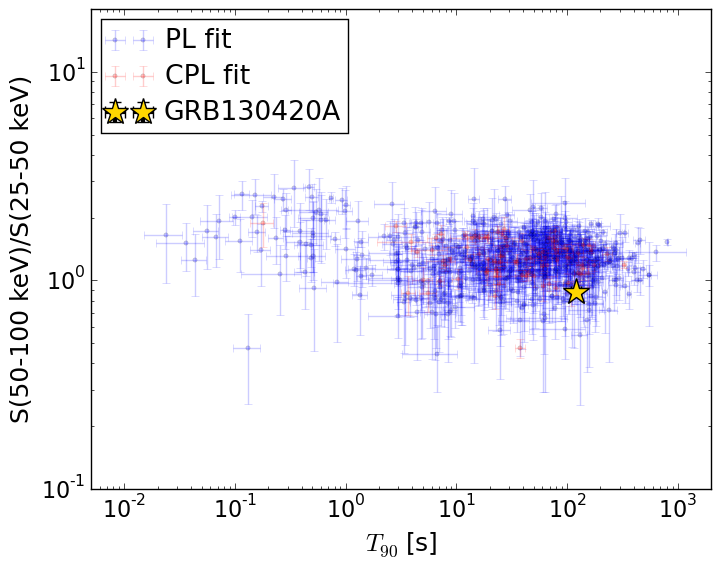
T90                                   = 121.136 sec.
Hardness ratio (energy fluence ratio) = 0.881007847803
S(15-50 keV) vs. S(50-150 keV) plot
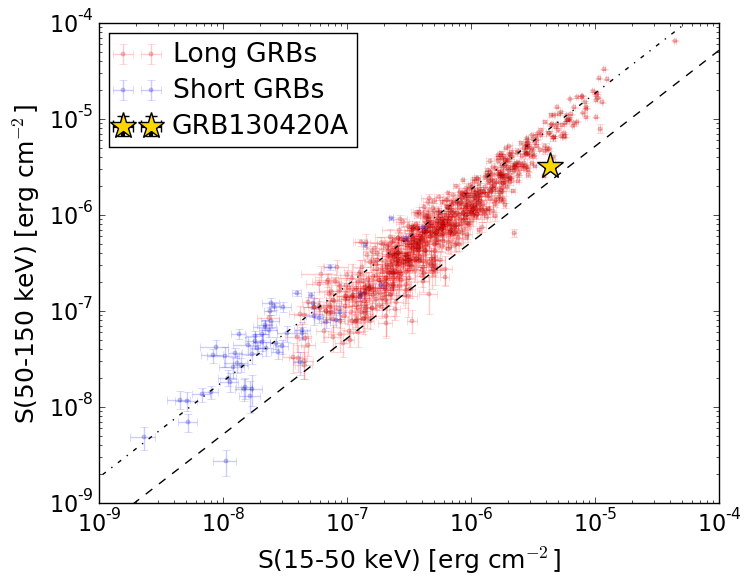
S(15-50 keV)  = 4.362328e-06
S(50-150 keV) = 3.223865e-06
The dash-dotted line and the dashed line traces the fluences calculated from the Band function with Epeak = 15 and 150 keV, respectively. Both lines assume a canonical values of alpha = -1 and beta = -2.5.
Mask shadow pattern
IMX = 5.146293895582025E-01, IMY = 1.780407519443355E-01
Spacecraft aspect plot
Bright source in the pre-burst/pre-slew/post-slew images
Pre-burst image of 15-350 keV band
Time interval of the image:
-239.000000 -14.988000

# RAcent  DECcent POSerr Theta    Phi  PeakCts   SNR AngSep     Name
#  [deg]    [deg]    ['] [deg]  [deg]                   [']
191.4884   6.3957    1.9  39.2   86.4   4.5464   6.0 ------	UNKNOWN
161.4346  -3.5554    2.4  41.9  135.8   2.7871   4.8 ------	UNKNOWN
131.5680   9.0999    3.5  42.5 -175.3   0.9287   3.3 ------	UNKNOWN
124.5734   9.2618    3.0  47.1 -168.0   1.3561   3.8 ------	UNKNOWN
Pre-slew background subtracted image of 15-350 keV band
Time interval of the image:
-14.988000 188.128000

# RAcent  DECcent POSerr Theta    Phi  PeakCts   SNR AngSep     Name
#  [deg]    [deg]    ['] [deg]  [deg]                   [']
165.2465  -3.6810    2.3  41.8  130.1   4.2585   5.1 ------	UNKNOWN
158.2432  -7.4544    2.7  46.2  139.6   4.3155   4.2 ------	UNKNOWN
216.2192  54.5891    2.1  37.3   -4.0   1.7428   5.5 ------	UNKNOWN
134.8137  20.4374    2.7  32.3 -165.6   1.1622   4.3 ------	UNKNOWN
196.1202  59.4222    0.2  28.6  -19.1  15.1381  60.4 ------	UNKNOWN
Post-slew image of 15-350 keV band
Time interval of the image:
719.500580 963.136200

# RAcent  DECcent POSerr Theta    Phi  PeakCts   SNR AngSep     Name
#  [deg]    [deg]    ['] [deg]  [deg]                   [']
254.4972  35.3207    2.2  44.3   18.8   2.3111   5.3    2.3	Her X-1
191.9427  35.6056    2.2  24.0  111.1   1.3404   5.4 ------	UNKNOWN
230.2329  48.9718    2.6  22.2   25.6   0.9066   4.4 ------	UNKNOWN
277.6334  84.4120    2.6  30.2  -66.2   1.2259   4.5 ------	UNKNOWN
 65.0026  76.2630    3.4  40.8  -93.1   3.5059   3.4 ------	UNKNOWN