Analysis Summary
Notes:
- 1) No attempt has been made to eliminate the non-significant decimal places.
- 2) This batgrbproduct analysis is done using the HEASARC data.
- 3) This batgrbproduct analysis is using the flight position for the mask-weighting calculation.
======================================================================
                  BAT GRB EVENT DATA PROCESSING REPORT
    Process Script Ver: batgrbproduct v2.46
    Process Start Time: Sun Jan 12 04:11:43 EST 2014
             Host Name: batevent1
   Current Working Dir: /local/data/batevent/batevent_reproc/trigger553996
======================================================================

  Trigger: 00553996      Segment: 000

  BAT Trigger Time: 388155401.536   [s; MET]
      Trigger Stop: 388155402.048   [s; MET]
               UTC: 2013-04-20T12:56:31.073560    [includes UTCF correction]
       Where From?: TDRSS position message

  BAT
    RA: 183.11962611028   Dec: 54.3864374361318  [deg; J2000]

     Catalogged Source?: NO
     Point Source?:      YES
     GRB Indicated?:     YES    [ by BAT flight software ]
     Image S/N Ratio:    7.39
     Image Trigger?:     NO
     Rate S/N Ratio:     12.6491106406735  [ if not an image trigger ]
     Image S/N Ratio:    7.39

  Analysis Position:   [ source = BAT ]
    RA: 183.11962611028   Dec: 54.3864374361318  [deg; J2000]

  Refined Position:   [ source = BAT pre-slew burst ]
    RA: 183.102289700254   Dec: 54.3750263124822  [deg; J2000]
        { 12h 12m 24.5s , +54d 22' 30.1" }
         +/- 1.10965383602943 [arcmin] (estimated 90% radius based on SNR)
         +/- 0.437913986257339 [arcmin] (formal 1-sigma fit error)
    SNR: 26.2159005966567

  Angular difference between the analysis and refined position is 0.914201 arcmin

  Partial Coding Fraction: 1.015625    [ including projection effects ]

  Duration
     T90: 12.6359999775887 +/- 5.22695322379476
        Measured from: -2.24800002574921
                   to: 10.3879999518394     [s; relative to TRIGTIME]
     T50: 4.06799989938736 +/- 0.795225816250442
        Measured from: 1.06400001049042
                   to: 5.13199990987778     [s; relative to TRIGTIME]


  Fluence
     Peak Flux  (peak 1 second)
        Measured from: 0.912000000476837
                   to: 1.91200000047684     [s; relative to TRIGTIME]
     Total Fluence
        Measured from: -4.61599999666214
                   to: 16.0479999780655     [s; relative to TRIGTIME]

             Band 1     Band 2     Band 3     Band 4
              15-25      25-50     50-100    100-350     keV
 Total     0.261012   0.455856   0.365784   0.074017
           0.023999   0.025635   0.022783   0.018686 [error]
 Peak      0.044047   0.068744   0.060554   0.010679
           0.005799   0.006532   0.006005   0.004473 [error]

     [ fluence units of on-axis counts / fully illuminated detector ]

======================================================================


====== Table of the duration information =============================

        Value   tstart    tstop
T100   20.664   -4.616   16.048
T90    12.636   -2.248   10.388
T50     4.068    1.064    5.132
Peak    1.000    0.912    1.912


====== Spectral Analysis Summary =====================================

Model      : spectral model: simple power-law (PL) and cutoff power-law (CPL)
Ph_index   : photon index: E^{Ph_index}
Ph_90err   : 90% error of the photon index
Epeak      : Epeak in keV
Epeak_90err: 90% error of Epeak
Norm       : normalization at 50 keV in both the PL model and CPL model
Nomr_90err : 90% error of the normalization
chi2       : Chi-Squared
dof        : degree of freedo

=== Time-averaged spectral analysis ===
(Best model with acceptable fit: CPL)

Model Ph_index Ph_90err_low Ph_90err_hi  Epeak  Epeak_90err_low  Epeak_90err_hi  Norm       Nomr_90err_low    Norm_90err_hi    chi2    dof
PL      -1.380    -0.105      0.104       -           -               -         3.58e-03     -2.34e-04          2.34e-04      60.980   57
CPL     -0.113    -0.494      0.557       74.301      -9.721        17.436      1.55e-02     -6.63e-03          1.35e-02      38.220   56


=== 1-s peak spectral analysis ===
(Best model with acceptable fit: PL)

Model Ph_index Ph_90err_low Ph_90err_hi  Epeak  Epeak_90err_low  Epeak_90err_hi  Norm       Nomr_90err_low    Norm_90err_hi    chi2    dof
PL      -1.289     -0.164     0.164       -           -               -         1.19e-02     -1.21e-03          1.21e-03      60.020   57
CPL     -0.561     -0.671     0.802      100.261     -29.633       420.080      2.76e-02     -1.47e-02          4.04e-02      56.550   56


=== Fluence/Peak Flux Summary ===

              Model    Band1     Band2     Band3     Band4     Band5     Total
                       15-25     25-50    50-100    100-350    15-150    15-350    keV
Fluence         PL   8.45e-08  1.67e-07  2.57e-07  8.63e-07  7.18e-07  1.37e-06   erg/cm2
      90%_error_low -8.87e-09 -1.13e-08 -2.11e-08 -1.40e-07 -5.21e-08 -1.58e-07   erg/cm2
      90%_error_hi   9.10e-09  1.12e-08  2.11e-08  1.56e-07  5.26e-08  1.72e-07   erg/cm2
Peak flux       PL   3.99e-01  4.55e-01  3.72e-01  5.10e-01  1.41e+00  1.74e+00   ph/cm2/s
      90%_error_low -6.67e-02 -4.97e-02 -4.61e-02 -1.17e-01 -1.43e-01 -1.85e-01   ph/cm2/s
      90%_error_hi   6.98e-02  4.92e-02  4.57e-02  1.36e-01  1.43e-01  1.88e-01   ph/cm2/s

Fluence        CPL   6.81e-08  1.89e-07  2.75e-07  1.97e-07  6.57e-07  7.29e-07   erg/cm2
      90%_error_low -1.07e-08 -1.44e-08 -2.49e-08 -7.49e-08 -5.56e-08 -9.10e-08   erg/cm2
      90%_error_hi   1.09e-08  1.47e-08  2.51e-08  1.24e-07  5.67e-08  1.30e-07   erg/cm2
Peak flux      CPL   3.51e-01  4.90e-01  3.98e-01  2.40e-01  1.38e+00  1.48e+00   ph/cm2/s
      90%_error_low -8.02e-02 -5.99e-02 -5.34e-02 -1.18e-01 -1.46e-01 -1.91e-01   ph/cm2/s
      90%_error_hi   8.20e-02  6.20e-02  5.49e-02  2.43e-01  1.46e-01  2.61e-01   ph/cm2/s

======================================================================
Image
Pre-slew 15.0-350.0 keV image (Event data)
#   RAcent    DECcent   POSerr    Theta     Phi              Peak Cts       SNR   Name
  183.1023    54.3750   0.0073     8.6449   162.9842         1.0971865     26.216 TRIG_00553996

Foreground time interval of the image:
 -4.616  10.165 (delta_t =  14.781 [sec])
Background time interval of the image:
-239.536  -4.616 (delta_t = 234.920 [sec])
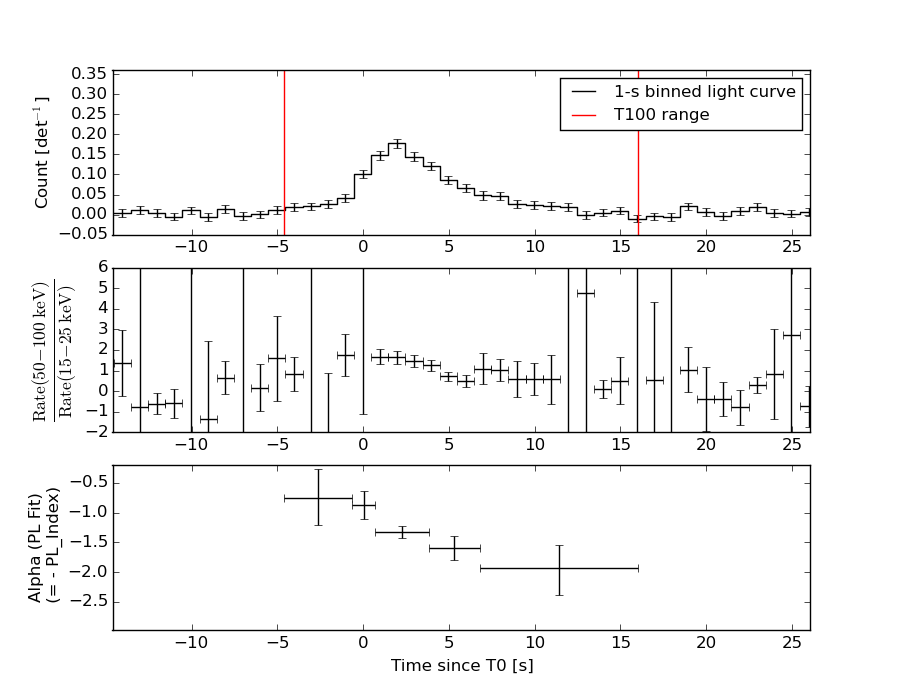
Light Curves
Note: The mask-weighted lightcurves have units of either count/det or counts/sec/det, where a det is 0.4 x 0.4 = 0.16 sq cm.
Full-time range; 1 s binning
Other quick-look light curves:
- 64 ms binning (zoomed)
- 16 ms binning (zoomed)
- 8 ms binning (zoomed)
- 2 ms binning (zoomed)
- SN=5 or 10 s binning (full-time range)
- Raw light curve
Spectra
- 64 ms binning (zoomed)
- 16 ms binning (zoomed)
- 8 ms binning (zoomed)
- 2 ms binning (zoomed)
- SN=5 or 10 s binning (full-time range)
- Raw light curve
Spectra
Notes:
- 1) The fitting includes the systematic errors.
- 2) When the burst includes telescope slew time periods, the fitting uses an average response file made from multiple 5-s response files through out the slew time plus single time preiod for the non-slew times, and weighted by the total counts in the corresponding time period using addrmf. An average response file is needed becuase a spectral fit using the pre-slew DRM will introduce some errors in both a spectral shape and a normalization if the PHA file contains a lot of the slew/post-slew time interval.
- 3) For fits to more complicated models (e.g. a power-law over a cutoff power-law), the BAT team has decided to require a chi-square improvement of more than 6 for each extra dof.
Time averaged spectrum fit using the average DRM
Power-law model
Time interval is from   -4.616 sec. to   16.048 sec.

Spectral model in power-law:
------------------------------------------------------------
Parameters  : value       lower 90%   higher 90%
Photon index: -1.37998     ( -0.104744   0.104414 )
Norm@50keV  : 3.58225E-03    ( -0.000234279   0.000233843 )
------------------------------------------------------------
#Fit statistic : Chi-Squared =          60.98 using 59 PHA bins.
# Reduced chi-squared =          1.070 for     57 degrees of freedom
# Null hypothesis probability =   3.347040e-01

Photon flux (15-150 keV)    in 20.66 sec: 0.434319 ( -0.028173  0.02819 ) ph/cm2/s
Energy fluence (15-150 keV)             : 7.18191e-07 ( -5.21359e-08  5.25708e-08 ) ergs/cm2
Cutoff power-law model
Time interval is from   -4.616 sec. to   16.048 sec.
Spectral model in the cutoff power-law:
------------------------------------------------------------
Parameters  : value       lower 90%   higher 90%
Photon index: -0.112799     ( -0.493662   0.557472 )
Epeak [keV] : 74.3006      ( -9.72074 17.4363 )
Norm@50keV  : 1.55456E-02    ( -0.00662526   0.0134564 )
------------------------------------------------------------
#Fit statistic : Chi-Squared =          38.22 using 59 PHA bins.
# Reduced chi-squared =         0.6826 for     56 degrees of freedom
# Null hypothesis probability =   9.667508e-01

Photon flux (15-150 keV)    in 20.66 sec: 0.413572 ( -0.029231  0.029235 ) ph/cm2/s
Energy fluence (15-150 keV)             : 6.56509e-07 ( -5.55975e-08  5.67224e-08 ) ergs/cm2
1-s peak spectrum fit
Power-law model
Time interval is from    0.912 sec. to    1.912 sec.

Spectral model in power-law:
------------------------------------------------------------
Parameters  : value       lower 90%   higher 90%
Photon index: -1.28913     ( -0.16438   0.163871 )
Norm@50keV  : 1.18593E-02    ( -0.00120866   0.00120562 )
------------------------------------------------------------
#Fit statistic : Chi-Squared =          60.02 using 59 PHA bins.
# Reduced chi-squared =          1.053 for     57 degrees of freedom
# Null hypothesis probability =   3.667624e-01

Photon flux (15-150 keV)    in 1 sec: 1.41206 ( -0.14274  0.1428 ) ph/cm2/s
Energy fluence (15-150 keV)             : 1.1752e-07 ( -1.35208e-08  1.36426e-08 ) ergs/cm2
Cutoff power-law model
Time interval is from    0.912 sec. to    1.912 sec.
Spectral model in the cutoff power-law:
------------------------------------------------------------
Parameters  : value       lower 90%   higher 90%
Photon index: -0.560834     ( -0.670704   0.802204 )
Epeak [keV] : 100.261      ( -29.6329 420.081 )
Norm@50keV  : 2.76033E-02    ( -0.0146866   0.0403714 )
------------------------------------------------------------
#Fit statistic : Chi-Squared =          56.55 using 59 PHA bins.
# Reduced chi-squared =          1.010 for     56 degrees of freedom
# Null hypothesis probability =   4.544605e-01

Photon flux (15-150 keV)    in 1 sec: 1.38187 ( -0.1465  0.14594 ) ph/cm2/s
Energy fluence (15-150 keV)             : 1.11954e-07 ( -1.46882e-08  1.47295e-08 ) ergs/cm2
Time-resolved spectra
Distribution
T90 vs. Hardness ratio plot
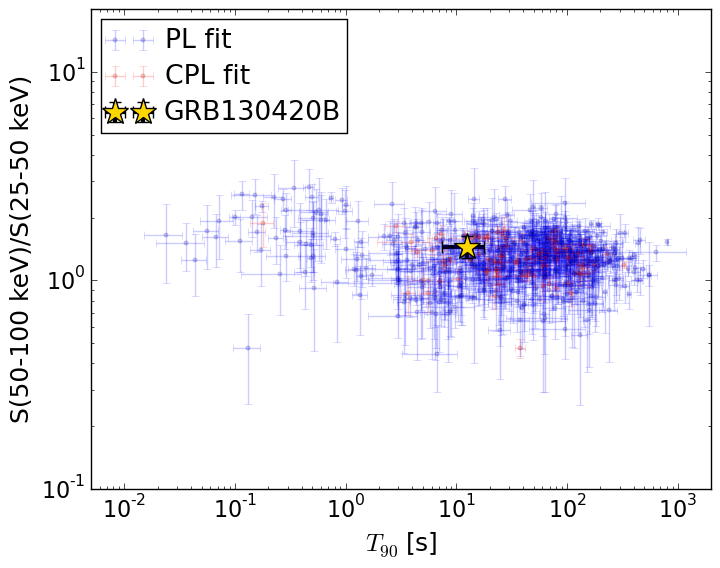
T90                                   = 12.636 sec.
Hardness ratio (energy fluence ratio) = 1.453081693
S(15-50 keV) vs. S(50-150 keV) plot
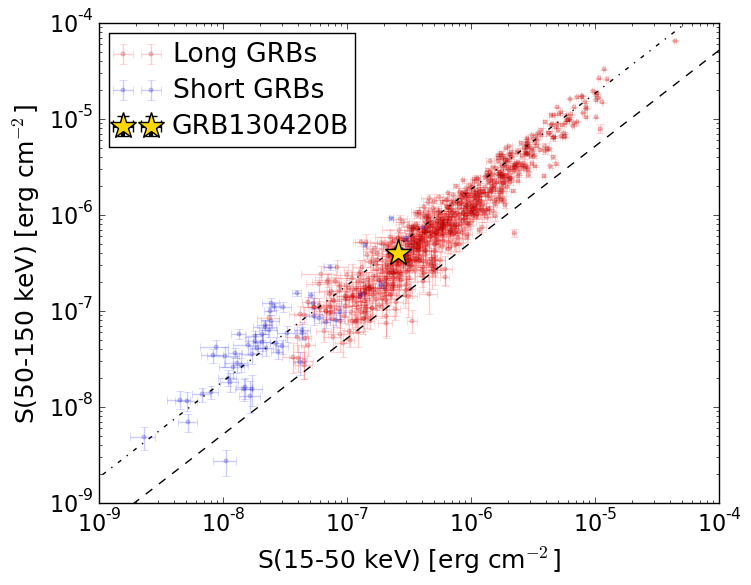
S(15-50 keV)  = 2.5715454e-07
S(50-150 keV) = 3.993556e-07
The dash-dotted line and the dashed line traces the fluences calculated from the Band function with Epeak = 15 and 150 keV, respectively. Both lines assume a canonical values of alpha = -1 and beta = -2.5.
Mask shadow pattern
IMX = -1.453814624393525E-01, IMY = -4.449136204728642E-02
Spacecraft aspect plot
Bright source in the pre-burst/pre-slew/post-slew images
Pre-burst image of 15-350 keV band
Time interval of the image:
-239.536000 -4.616000

# RAcent  DECcent POSerr Theta    Phi  PeakCts   SNR AngSep     Name
#  [deg]    [deg]    ['] [deg]  [deg]                   [']
254.4966  35.3106    2.7  44.4   18.8   1.7080   4.3    2.7	Her X-1
169.7336  17.2123    2.7  46.3  138.7   3.4858   4.2 ------	UNKNOWN
132.9946  33.1649    2.5  48.4 -170.9   1.8080   4.6 ------	UNKNOWN
138.8562  61.0434    3.7  27.5 -138.8   0.6250   3.1 ------	UNKNOWN
 83.1395  70.5742    3.8  41.8 -104.5   2.5350   3.1 ------	UNKNOWN
Pre-slew background subtracted image of 15-350 keV band
Time interval of the image:
-4.616000 10.164620

# RAcent  DECcent POSerr Theta    Phi  PeakCts   SNR AngSep     Name
#  [deg]    [deg]    ['] [deg]  [deg]                   [']
254.3480  35.3165    8.5  44.3   19.0   0.1224   1.4    5.6	Her X-1
254.7634  28.2780    2.7  50.2   24.3   0.7579   4.3 ------	UNKNOWN
230.1737  43.2888    2.4  26.2   35.4   0.2543   4.9 ------	UNKNOWN
183.1023  54.3751    0.4   8.6  163.0   1.0972  26.2 ------	UNKNOWN
273.1531  57.7483    1.9  38.0  -19.4   0.3380   6.1 ------	UNKNOWN
331.4357  73.1352    2.4  44.1  -60.1   0.8025   4.8 ------	UNKNOWN
Post-slew image of 15-350 keV band
Time interval of the image:
38.564590 66.164590

# RAcent  DECcent POSerr Theta    Phi  PeakCts   SNR AngSep     Name
#  [deg]    [deg]    ['] [deg]  [deg]                   [']
254.4744  35.2915    3.0  51.6   17.7   0.7916   3.9    3.2	Her X-1
154.7370   9.0178    2.5  50.7  154.2   1.1821   4.7 ------	UNKNOWN
138.3688  19.0685    2.0  49.0  178.7   0.7170   5.7 ------	UNKNOWN
105.9339  42.2956    3.0  50.0 -133.5   0.9709   3.9 ------	UNKNOWN
319.5085  72.2628    2.1  49.8  -47.2   1.3055   5.6 ------	UNKNOWN