Analysis Summary
Notes:
- 1) No attempt has been made to eliminate the non-significant decimal places.
- 2) This batgrbproduct analysis is done using the HEASARC data.
- 3) This batgrbproduct analysis is using the flight position for the mask-weighting calculation.
======================================================================
                  BAT GRB EVENT DATA PROCESSING REPORT
    Process Script Ver: batgrbproduct v2.46
    Process Start Time: Sun Jan 12 04:04:56 EST 2014
             Host Name: batevent1
   Current Working Dir: /local/data/batevent/batevent_reproc/trigger554620
======================================================================

  Trigger: 00554620      Segment: 000

  BAT Trigger Time: 388741688   [s; MET]
      Trigger Stop: 388741752   [s; MET]
               UTC: 2013-04-27T07:47:57.511640    [includes UTCF correction]
       Where From?: TDRSS position message

  BAT
    RA: 173.138779355743   Dec: 27.6915539178619  [deg; J2000]

     Catalogged Source?: NO
     Point Source?:      YES
     GRB Indicated?:     YES    [ by BAT flight software ]
     Image S/N Ratio:    23.81
     Image Trigger?:     YES
     Rate S/N Ratio:     0  [ if not an image trigger ]
     Image S/N Ratio:    23.81

  Analysis Position:   [ source = BAT ]
    RA: 173.138779355743   Dec: 27.6915539178619  [deg; J2000]

  Refined Position:   [ source = BAT pre-slew burst ]
    RA: 173.149056906524   Dec: 27.7053988484936  [deg; J2000]
        { 11h 32m 35.8s , +27d 42' 19.4" }
         +/- 0.982137400870556 [arcmin] (estimated 90% radius based on SNR)
         +/- 0.238352452217769 [arcmin] (formal 1-sigma fit error)
    SNR: 31.2105110737043

  Angular difference between the analysis and refined position is 0.994062 arcmin

  Partial Coding Fraction: 0.140625    [ including projection effects ]

  Duration
     T90: 244.331999957561 +/- 4.73248855584923
        Measured from: -47.0120000243187
                   to: 197.319999933243     [s; relative to TRIGTIME]
     T50: 22.4959999918938 +/- 0.596335433568541
        Measured from: -43.744000017643
                   to: -21.2480000257492     [s; relative to TRIGTIME]


  Fluence
     Peak Flux  (peak 1 second)
        Measured from: -43.4240000247955
                   to: -42.4240000247955     [s; relative to TRIGTIME]
     Total Fluence
        Measured from: -51.1520000100136
                   to: 660.040000021458     [s; relative to TRIGTIME]

             Band 1     Band 2     Band 3     Band 4
              15-25      25-50     50-100    100-350     keV
 Total   109.839288 171.510934 174.416588  64.949497
           0.355854   0.426354   0.438499   0.347329 [error]
 Peak      5.516924  12.745294  18.743381   8.652996
           0.068270   0.103737   0.131189   0.113289 [error]

     [ fluence units of on-axis counts / fully illuminated detector ]

======================================================================


====== Table of the duration information =============================

        Value   tstart    tstop
T100  711.192  -51.152  660.040
T90   244.332  -47.012  197.320
T50    22.496  -43.744  -21.248
Peak    1.000  -43.424  -42.424


====== Spectral Analysis Summary =====================================

Model      : spectral model: simple power-law (PL) and cutoff power-law (CPL)
Ph_index   : photon index: E^{Ph_index}
Ph_90err   : 90% error of the photon index
Epeak      : Epeak in keV
Epeak_90err: 90% error of Epeak
Norm       : normalization at 50 keV in both the PL model and CPL model
Nomr_90err : 90% error of the normalization
chi2       : Chi-Squared
dof        : degree of freedo

=== Time-averaged spectral analysis ===
(Best model with acceptable fit: PL)

Model Ph_index Ph_90err_low Ph_90err_hi  Epeak  Epeak_90err_low  Epeak_90err_hi  Norm       Nomr_90err_low    Norm_90err_hi    chi2    dof
PL      -1.176    -0.018      0.019       -           -               -         5.13e-02     -6.29e-04          6.25e-04      19.530   57
CPL     -1.169    -0.019      0.038     9995.160    -9995.160      -9995.160      5.16e-02     -5.82e-04          9.34e-04      19.980   56


=== 1-s peak spectral analysis ===
(Best model with acceptable fit: CPL)

Model Ph_index Ph_90err_low Ph_90err_hi  Epeak  Epeak_90err_low  Epeak_90err_hi  Norm       Nomr_90err_low    Norm_90err_hi    chi2    dof
PL      -0.722     -0.023     0.023       -           -               -         3.13e+00     -4.55e-02          4.54e-02      46.320   57
CPL     -0.502     -0.098     0.100      467.392    -122.351       303.925      3.77e+00     -2.95e-01          3.24e-01      31.440   56


=== Fluence/Peak Flux Summary ===

              Model    Band1     Band2     Band3     Band4     Band5     Total
                       15-25     25-50    50-100    100-350    15-150    15-350    keV
Fluence         PL   3.44e-05  7.72e-05  1.37e-04  5.68e-04  3.73e-04  8.16e-04   erg/cm2
      90%_error_low -9.09e-07 -1.27e-06 -1.32e-06 -1.19e-05 -3.67e-06 -1.17e-05   erg/cm2
      90%_error_hi   9.21e-07  1.27e-06  1.32e-06  1.21e-05  3.68e-06  1.18e-05   erg/cm2
Peak flux       PL   1.40e-02  1.87e-01  3.07e+00  3.35e+02  1.09e+01  3.39e+02   ph/cm2/s
      90%_error_low     N/A       N/A       N/A       N/A       N/A       N/A     ph/cm2/s
      90%_error_hi      N/A       N/A       N/A       N/A       N/A       N/A     ph/cm2/s

Fluence        CPL   3.51e-05  7.72e-05  1.36e-04  5.94e-04  3.73e-04  8.13e-04   erg/cm2
      90%_error_low    N/A    -1.33e-06    N/A       N/A    -3.75e-06 -9.42e-06   erg/cm2
      90%_error_hi     N/A     1.21e-06    N/A       N/A     3.57e-06  1.10e-05   erg/cm2
Peak flux      CPL   5.65e+01  9.82e+01  1.23e+02  2.41e+02  3.59e+02  5.19e+02   ph/cm2/s
      90%_error_low -2.79e+00 -2.00e+00 -2.20e+00 -1.69e+01 -5.07e+00 -1.79e+01   ph/cm2/s
      90%_error_hi   2.85e+00  1.99e+00  2.21e+00  1.86e+01  5.08e+00  1.95e+01   ph/cm2/s

======================================================================
Image
Pre-slew 15.0-350.0 keV image (Event data)
#   RAcent    DECcent   POSerr    Theta     Phi              Peak Cts       SNR   Name
  173.1491    27.7054   0.0062    39.1063   -76.1615        32.9468848     31.211 TRIG_00554620

Foreground time interval of the image:
-16.099  72.301 (delta_t =  88.400 [sec])
Background time interval of the image:
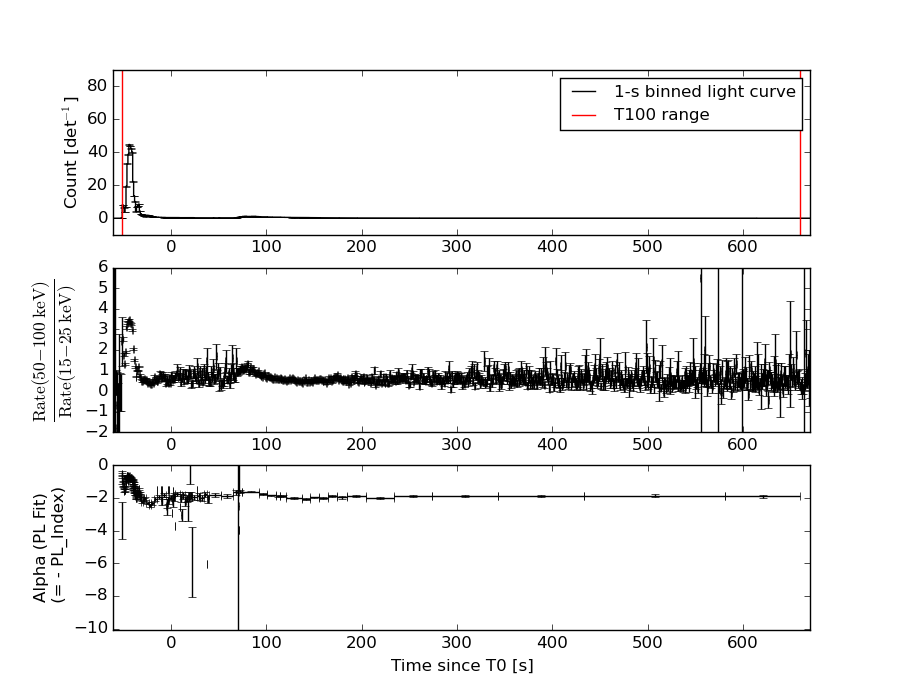
Light Curves
Note: The mask-weighted lightcurves have units of either count/det or counts/sec/det, where a det is 0.4 x 0.4 = 0.16 sq cm.
Full-time range; 1 s binning
Other quick-look light curves:
- 64 ms binning (zoomed)
- 16 ms binning (zoomed)
- 8 ms binning (zoomed)
- 2 ms binning (zoomed)
- SN=5 or 10 s binning (full-time range)
- Raw light curve
Spectra
- 64 ms binning (zoomed)
- 16 ms binning (zoomed)
- 8 ms binning (zoomed)
- 2 ms binning (zoomed)
- SN=5 or 10 s binning (full-time range)
- Raw light curve
Spectra
Notes:
- 1) The fitting includes the systematic errors.
- 2) When the burst includes telescope slew time periods, the fitting uses an average response file made from multiple 5-s response files through out the slew time plus single time preiod for the non-slew times, and weighted by the total counts in the corresponding time period using addrmf. An average response file is needed becuase a spectral fit using the pre-slew DRM will introduce some errors in both a spectral shape and a normalization if the PHA file contains a lot of the slew/post-slew time interval.
- 3) For fits to more complicated models (e.g. a power-law over a cutoff power-law), the BAT team has decided to require a chi-square improvement of more than 6 for each extra dof.
Time averaged spectrum fit using the average DRM
Power-law model
Time interval is from  -51.152 sec. to  660.040 sec.

Spectral model in power-law:
------------------------------------------------------------
Parameters  : value       lower 90%   higher 90%
Photon index: -1.17561     ( -0.0184726   0.0185717 )
Norm@50keV  : 5.13108E-02    ( -0.000628703   0.000625252 )
------------------------------------------------------------
#Fit statistic : Chi-Squared =          19.53 using 59 PHA bins.
# Reduced chi-squared =         0.3426 for     57 degrees of freedom
# Null hypothesis probability =   9.999992e-01

Photon flux (15-150 keV)    in 711.2 sec: 6.00300 ( -0.08277  0.08334 ) ph/cm2/s
Energy fluence (15-150 keV)             : 0.000372865 ( -3.67355e-06  3.67545e-06 ) ergs/cm2
Cutoff power-law model
Time interval is from  -51.152 sec. to  660.040 sec.
Spectral model in the cutoff power-law:
------------------------------------------------------------
Parameters  : value       lower 90%   higher 90%
Photon index: -1.16939     ( -0.0188031   0.0384872 )
Epeak [keV] : 9995.16      ( -9996.47 -9996.47 )
Norm@50keV  : 5.15600E-02    ( -0.00057434   0.000942426 )
------------------------------------------------------------
#Fit statistic : Chi-Squared =          19.98 using 59 PHA bins.
# Reduced chi-squared =         0.3568 for     56 degrees of freedom
# Null hypothesis probability =   9.999978e-01

Photon flux (15-150 keV)    in 711.2 sec: 2.22969 ( -0.1455  0.21412 ) ph/cm2/s
Energy fluence (15-150 keV)             : 0.000372951 ( -3.7511e-06  3.57206e-06 ) ergs/cm2
1-s peak spectrum fit
Power-law model
Time interval is from  -43.424 sec. to  -42.424 sec.

Spectral model in power-law:
------------------------------------------------------------
Parameters  : value       lower 90%   higher 90%
Photon index: -0.722392     ( -0.0228961   0.0230173 )
Norm@50keV  : 3.13131    ( -0.045534   0.0454065 )
------------------------------------------------------------
#Fit statistic : Chi-Squared =          46.32 using 59 PHA bins.
# Reduced chi-squared =         0.8126 for     57 degrees of freedom
# Null hypothesis probability =   8.431694e-01

Photon flux (15-150 keV)    in 1 sec: 10.9140 (    ) ph/cm2/s
Energy fluence (15-150 keV)             : 3.78443e-05 ( -4.8145e-07  4.81392e-07 ) ergs/cm2
Cutoff power-law model
Time interval is from  -43.424 sec. to  -42.424 sec.
Spectral model in the cutoff power-law:
------------------------------------------------------------
Parameters  : value       lower 90%   higher 90%
Photon index: -0.501537     ( -0.0982835   0.100265 )
Epeak [keV] : 467.392      ( -122.351 303.925 )
Norm@50keV  : 3.77096    ( -0.294584   0.324213 )
------------------------------------------------------------
#Fit statistic : Chi-Squared =          31.44 using 59 PHA bins.
# Reduced chi-squared =         0.5614 for     56 degrees of freedom
# Null hypothesis probability =   9.967497e-01

Photon flux (15-150 keV)    in 1 sec: 358.634 ( -5.072  5.082 ) ph/cm2/s
Energy fluence (15-150 keV)             : 3.78896e-05 ( -4.83709e-07  4.83775e-07 ) ergs/cm2
Time-resolved spectra
Distribution
T90 vs. Hardness ratio plot
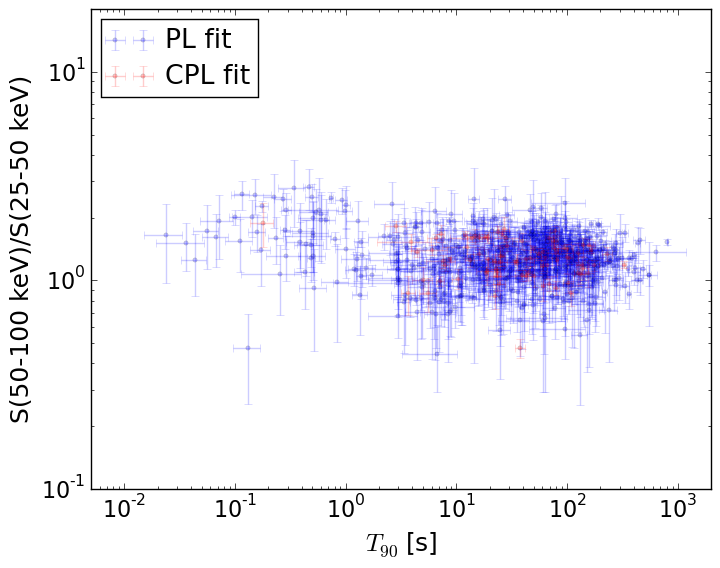
T90                                   = N/A sec.
Hardness ratio (energy fluence ratio) = N/A
S(15-50 keV) vs. S(50-150 keV) plot
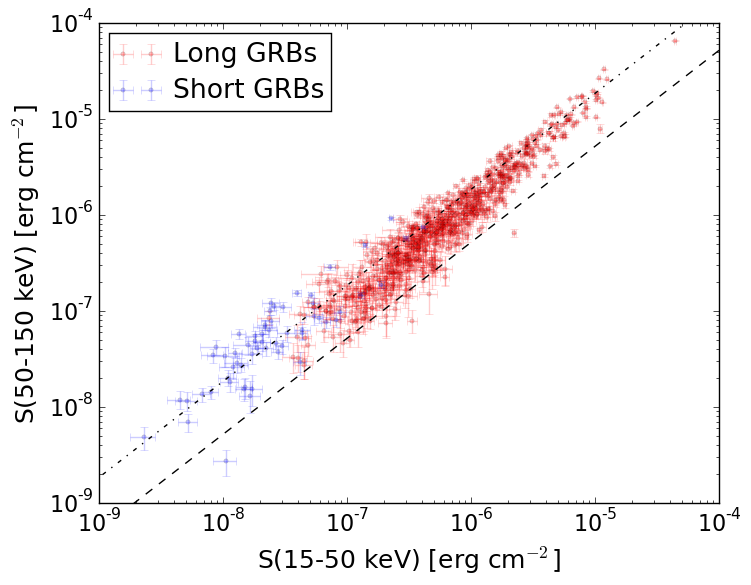
S(15-50 keV)  = N/A
S(50-150 keV) = N/A
The dash-dotted line and the dashed line traces the fluences calculated from the Band function with Epeak = 15 and 150 keV, respectively. Both lines assume a canonical values of alpha = -1 and beta = -2.5.
Mask shadow pattern
IMX = 1.944245717662905E-01, IMY = 7.892653722908463E-01
Spacecraft aspect plot
Bright source in the pre-burst/pre-slew/post-slew images
Pre-burst image of 15-350 keV band
Time interval of the image:
Pre-slew background subtracted image of 15-350 keV band
Time interval of the image:
-16.099400 72.300590

# RAcent  DECcent POSerr Theta    Phi  PeakCts   SNR AngSep     Name
#  [deg]    [deg]    ['] [deg]  [deg]                   [']
186.6075 -47.4850    2.6  42.2  141.3   1.5836   4.5 ------	UNKNOWN
180.4541  28.1589    2.9  36.4  -66.6   2.4061   3.9 ------	UNKNOWN
173.1490  27.7054    0.4  39.1  -76.2  32.9485  31.2 ------	UNKNOWN
Post-slew image of 15-350 keV band
Time interval of the image:
129.700590 963.038700

# RAcent  DECcent POSerr Theta    Phi  PeakCts   SNR AngSep     Name
#  [deg]    [deg]    ['] [deg]  [deg]                   [']
159.3902 -20.9407    3.2  50.4  156.5  11.9243   3.6 ------	UNKNOWN
188.5873   7.3515    2.9  25.0  101.2   4.0808   3.9 ------	UNKNOWN
155.9230   4.6659    2.2  28.3  178.4   4.0306   5.1 ------	UNKNOWN
173.1421  27.7220    0.1   0.0  -62.7  63.2324  94.1 ------	UNKNOWN
206.4331  52.5345    2.7  35.0   -4.6   3.9540   4.3 ------	UNKNOWN
232.9163  74.8166    2.6  55.6  -24.3  11.9473   4.4 ------	UNKNOWN
122.6115  12.4624    3.5  49.5 -137.6   9.3375   3.3 ------	UNKNOWN
120.6475  12.9243    3.7  51.0 -135.9  12.0475   3.1 ------	UNKNOWN